from matplotlib import pyplot

font = {
    'family' : 'SimHei',
    'weight' : 'bold',
    'size'   : '16'}
pyplot.rc('font', **font)


frameTime = [120, 220, 350, 270, 380, 500, 540]
frame = [i for i in range(1, len(frameTime)+1)]
#  生成图表
pyplot.plot(frame, frameTime)
# 设置横坐标为帧号,纵坐标为检测耗时,标题为单帧耗时分析
pyplot.xlabel('帧号')
pyplot.ylabel('检测耗时')
pyplot.title('单帧耗时分析(ms)')
# 设置纵坐标刻度
pyplot.yticks([i for i in range(100, 900, 50)])
pyplot.xticks([i+1 for i in range(0, len(frameTime), 1)])
# 设置填充选项:参数分别对应横坐标,纵坐标,纵坐标填充起始值,填充颜色(可以有更多选项)
# pyplot.fill_between(year, people, 10, color = 'green')
# 显示网格
pyplot.grid(True, linestyle="--", color="gray", linewidth="1", axis='both')
# 保存图片
pyplot.savefig(r"d:\test.png")
# 显示图表
pyplot.show()
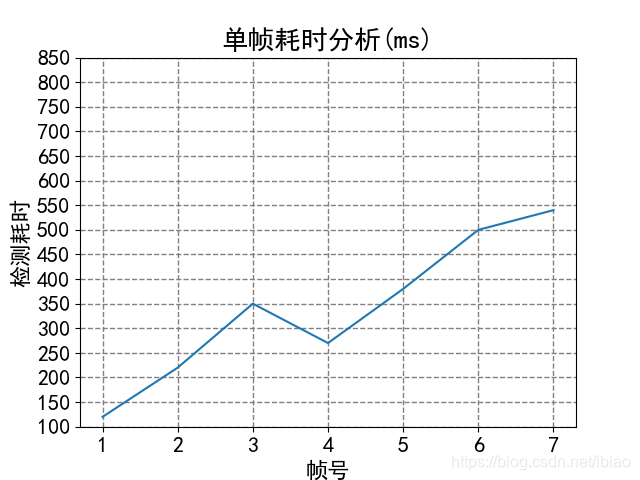


 本文通过实例演示了如何使用Python的Matplotlib库绘制并分析单帧耗时的折线图,包括设置字体、坐标轴标签、标题、刻度、填充选项、网格、保存及显示图表。


 2987
2987

 被折叠的 条评论
为什么被折叠?
被折叠的 条评论
为什么被折叠?
 到【灌水乐园】发言


