


evo工具的使用
kitti格式
evo_traj kitti gnss_pose.txt optimized_pose.txt -p
kitti格式,没有时间戳,这个是最基本的两条轨迹的对比,但是无法进行对齐,不推荐.
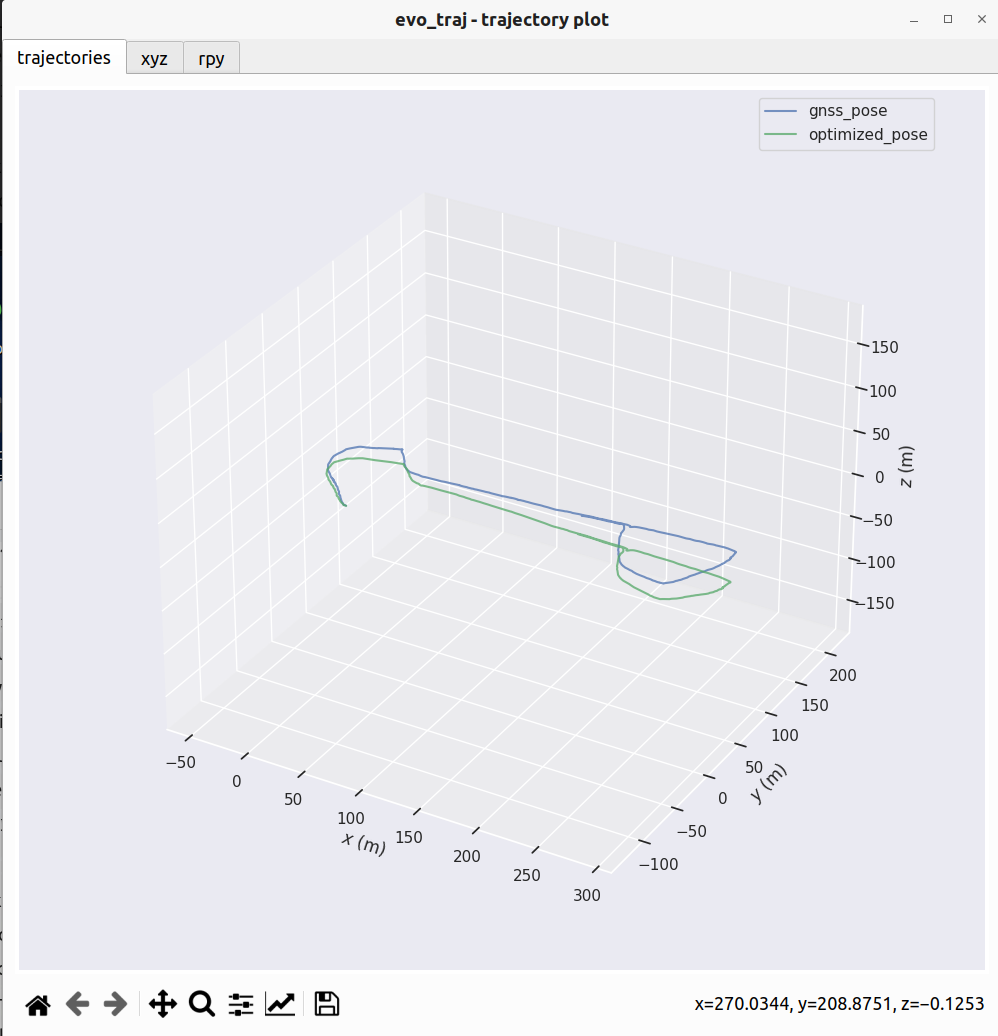
cyun@cyun:~/fast_lio_sam_ws/src/FAST_LIO_SAM/PCD$ evo_traj kitti gnss_pose.txt optimized_pose.txt -p
--------------------------------------------------------------------------------
name:	gnss_pose
infos:	2756 poses, 661.988m path length
--------------------------------------------------------------------------------
name:	optimized_pose
infos:	672 poses, 655.044m path length
kitti格式:r11 r12 r13 tx r21 r22 r23 ty r31 r32 r33 tz
TUM格式:timestamp x y z qx qy qz qw
需要在slam的过程中去记录下这两个txt文件即可.
那这样的两个txt有办法对齐吗,倒也是可以的,以下参考文件:
import numpy as np
import matplotlib.pyplot as plt
from mpl_toolkits.mplot3d import Axes3D
from scipy.spatial import KDTree
import math

def read_kitti_pose(file_path):
    try:
        data = np.loadtxt(file_path)
        return data[:, [3, 7, 11]] # tx, ty, tz
    except Exception as e:
        print(f"Error reading {file_path}: {e}")
        return None

def nearest_neighbor(src, dst):
    '''使用 KDTree 查找最近邻'''
    tree = KDTree(dst)
    distances, indices = tree.query(src)
    return distances, indices

def compute_transformation(src, dst):
    '''使用 SVD 计算从 src 到 dst 的变换'''
    centroid_src = np.mean(src, axis=0)
    centroid_dst = np.mean(dst, axis=0)

    src_centered = src - centroid_src
    dst_centered = dst - centroid_dst

    H = np.dot(src_centered.T, dst_centered)
    U, S, Vt = np.linalg.svd(H)
    R = np.dot(Vt.T, U.T)

    if np.linalg.det(R) < 0:
        Vt[2, :] *= -1
        R = np.dot(Vt.T, U.T)

    t = centroid_dst - np.dot(R, centroid_src)
    return R, t

def icp(src, dst, max_iterations=20, tolerance=1e-5):
    '''简单的 ICP 实现'''
    src_copy = np.copy(src)
    prev_error = float('inf')

    print(f"开始 ICP 配准 (Max Iter: {max_iterations})...")

    final_R = np.eye(3)
    final_t = np.zeros(3)

    # 预处理:先将两者重心对齐,作为良好的初始猜测
    centroid_src = np.mean(src_copy, axis=0)
    centroid_dst = np.mean(dst, axis=0)
    initial_t = centroid_dst - centroid_src
    src_copy += initial_t
    final_t += initial_t

    for i in range(max_iterations):
        # 1. 找最近点
        distances, indices = nearest_neighbor(src_copy, dst)
        dst_nearest = dst[indices]

        # 2. 计算平均误差
        mean_error = np.mean(distances)
        if abs(prev_error - mean_error) < tolerance:
            break
        prev_error = mean_error

        # 3. 计算这一步的变换
        R, t = compute_transformation(src_copy, dst_nearest)

        # 4. 更新点云
        src_copy = np.dot(src_copy, R.T) + t

        # 5. 累积变换矩阵 (用于最终输出)
        final_R = np.dot(R, final_R)
        final_t = np.dot(R, final_t) + t

        print(f"  Iter {i+1}: Mean Error = {mean_error:.4f} m")

    return final_R, final_t, src_copy

# --- 主程序 ---
file_slam = 'optimized_pose.txt'
file_gnss = 'gnss_pose.txt'

xyz_slam = read_kitti_pose(file_slam)
xyz_gnss = read_kitti_pose(file_gnss)

if xyz_slam is not None and xyz_gnss is not None:
    # 降采样 GNSS 以提高 ICP 速度 (可选,但推荐)
    # 如果 GNSS 点太多,ICP 会慢。每隔 5 个点取一个
    xyz_gnss_sparse = xyz_gnss[::1]

    # 执行 ICP
    R, t, xyz_slam_aligned = icp(xyz_slam, xyz_gnss_sparse)

    # 计算最终误差 (基于最近邻,而不是索引对应)
    dists, _ = nearest_neighbor(xyz_slam_aligned, xyz_gnss) # 与完整 GNSS 对比
    rmse = np.sqrt(np.mean(dists**2))
    max_err = np.max(dists)

    print("\n" + "="*50)
    print(" >>> ICP 优化后结果 <<<")
    print("="*50)
    print(f"RMSE (Fit): {rmse:.4f} m")
    print(f"Max Error : {max_err:.4f} m")

    print("\n齐次变换矩阵 T (4x4):")
    T = np.eye(4)
    T[:3, :3] = R
    T[:3, 3] = t
    with np.printoptions(precision=4, suppress=True):
        print(T)

    # 绘图
    fig = plt.figure(figsize=(12, 10))
    ax = fig.add_subplot(111, projection='3d')

    # 画 GNSS
    ax.plot(xyz_gnss[:,0], xyz_gnss[:,1], xyz_gnss[:,2], 'k-', label='GNSS', alpha=0.3)
    # 画 SLAM
    ax.scatter(xyz_slam_aligned[:,0], xyz_slam_aligned[:,1], xyz_slam_aligned[:,2], c=dists, cmap='jet', s=5, label='SLAM (ICP)')

    # 颜色条 (显示误差分布)
    mappable = plt.cm.ScalarMappable(cmap='jet')
    mappable.set_array(dists)
    plt.colorbar(mappable, label='Error (m)')

    ax.set_title(f'Trajectory Comparison (ICP Aligned)\nRMSE: {rmse:.3f}m')
    ax.legend()

    # 比例修正
    all_pts = np.vstack([xyz_gnss, xyz_slam_aligned])
    max_range = np.array([all_pts[:,0].max()-all_pts[:,0].min(), all_pts[:,1].max()-all_pts[:,1].min(), all_pts[:,2].max()-all_pts[:,2].min()]).max() / 2.0
    mid = np.mean(all_pts, axis=0)
    ax.set_xlim(mid[0] - max_range, mid[0] + max_range)
    ax.set_ylim(mid[1] - max_range, mid[1] + max_range)
    ax.set_zlim(mid[2] - max_range, mid[2] + max_range)

    plt.show()
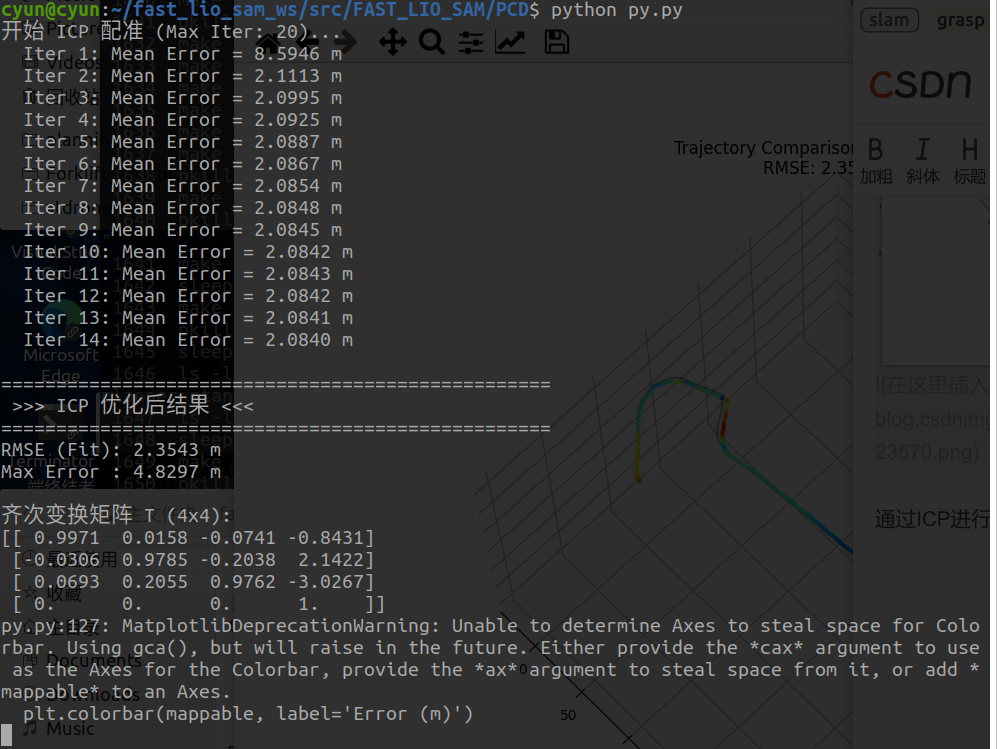
输入就是两个kitti格式的轨迹txt文件
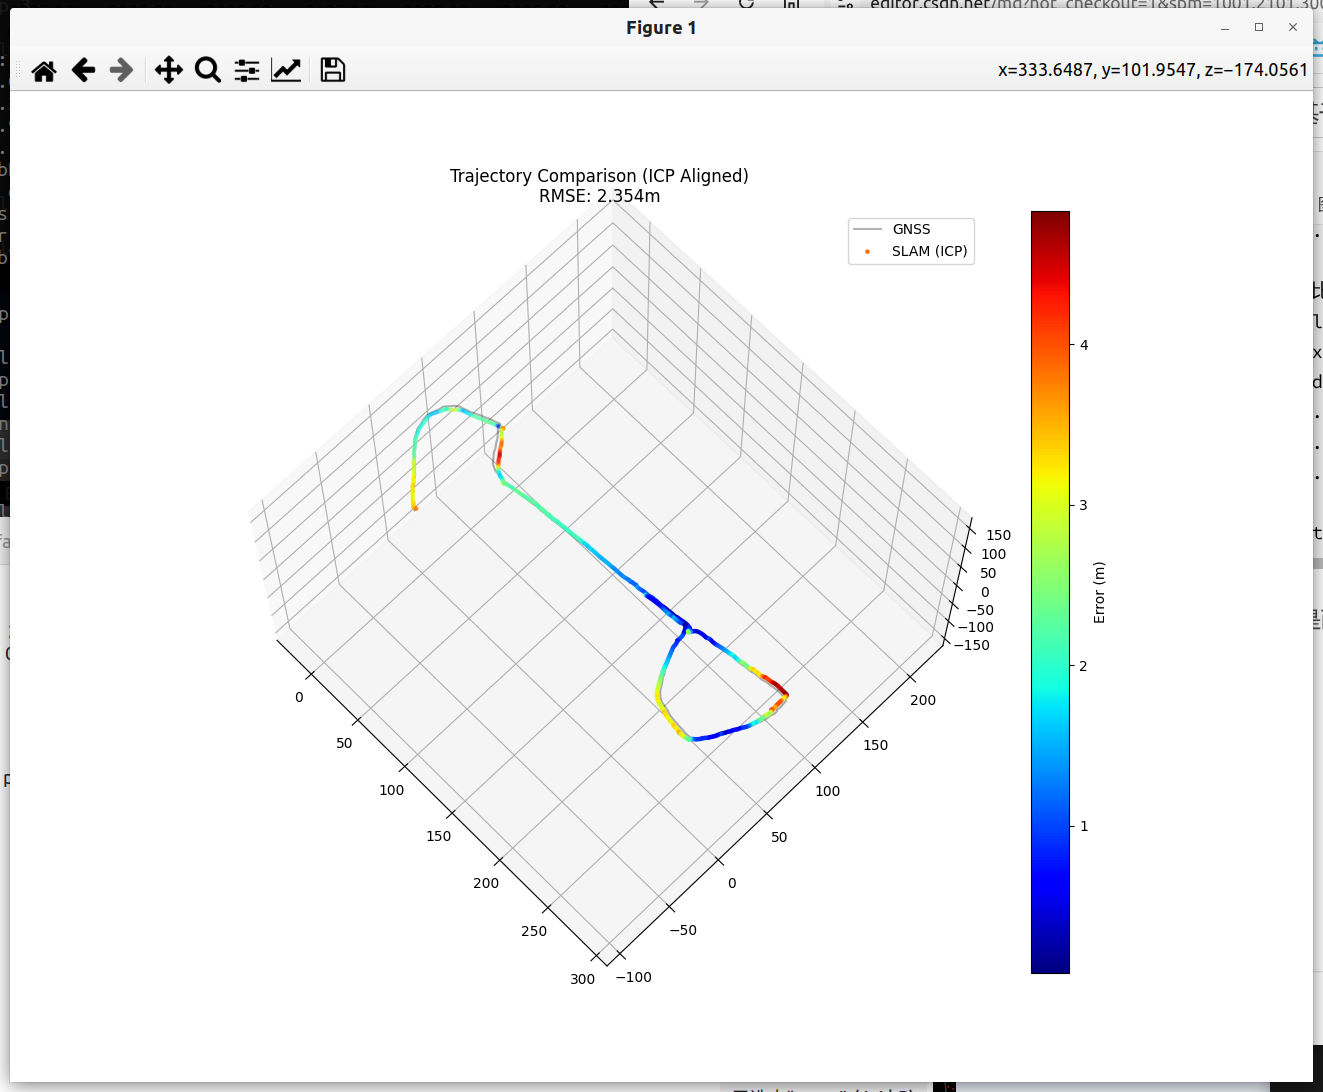
通过ICP进行匹配,计算出变换矩阵即可.
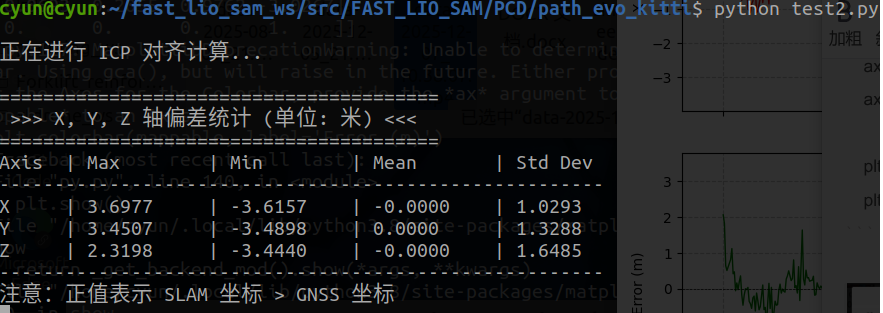
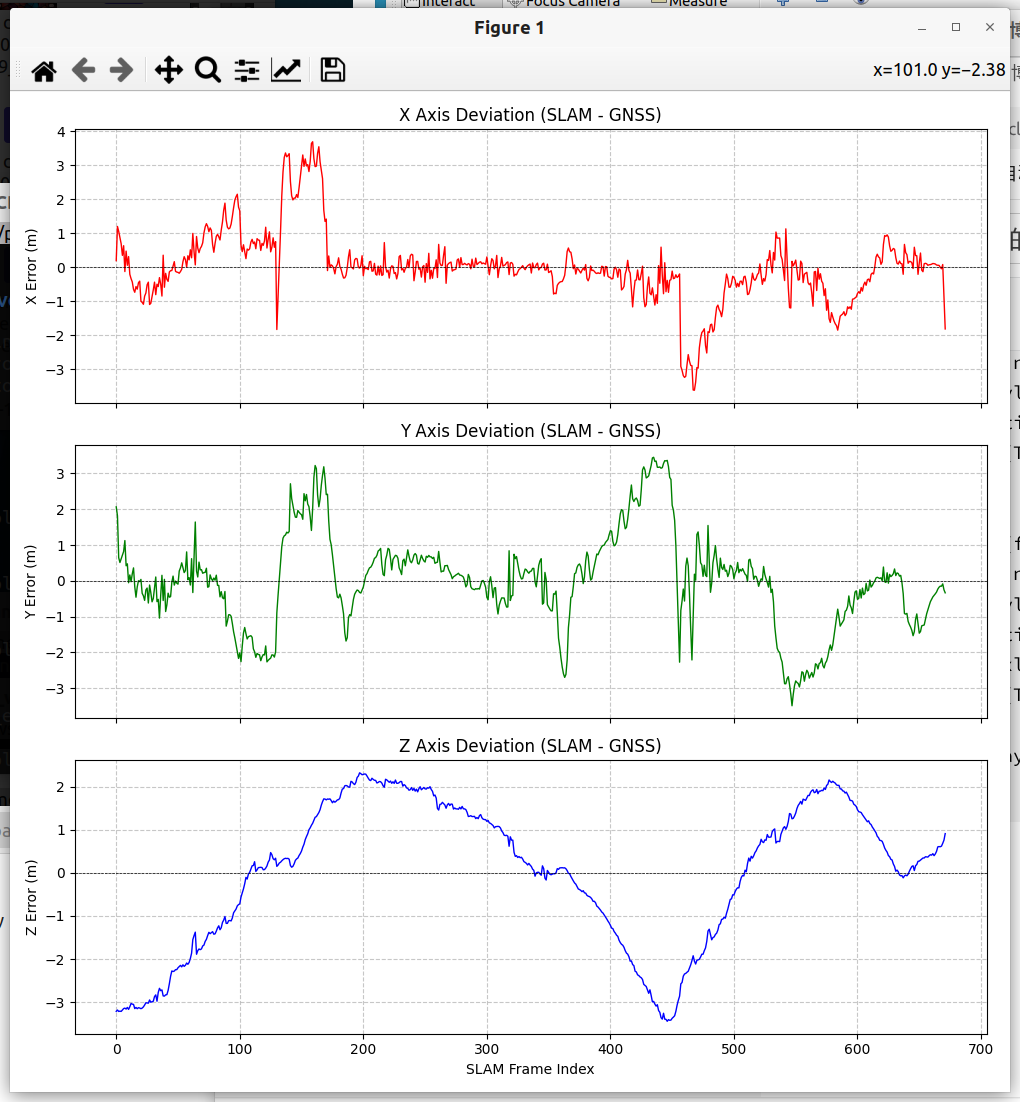
然后为了计算三个轴的相关的偏差,可以通过以下程序:
import numpy as np
import matplotlib.pyplot as plt
from scipy.spatial import KDTree

def read_kitti_pose(file_path):
    try:
        data = np.loadtxt(file_path)
        return data[:, [3, 7, 11]] # tx, ty, tz
    except Exception as e:
        print(f"读取失败: {e}")
        return None

def compute_transformation(src, dst):
    centroid_src = np.mean(src, axis=0)
    centroid_dst = np.mean(dst, axis=0)
    src_centered = src - centroid_src
    dst_centered = dst - centroid_dst
    H = np.dot(src_centered.T, dst_centered)
    U, S, Vt = np.linalg.svd(H)
    R = np.dot(Vt.T, U.T)
    if np.linalg.det(R) < 0:
        Vt[2, :] *= -1
        R = np.dot(Vt.T, U.T)
    t = centroid_dst - np.dot(R, centroid_src)
    return R, t

def icp(src, dst, max_iter=30):
    '''ICP 配准算法'''
    src_copy = np.copy(src)
    dst_tree = KDTree(dst)

    # 初始化
    prev_error = float('inf')
    final_R = np.eye(3)
    final_t = np.zeros(3)

    # 粗对齐:重心对齐
    centroid_src = np.mean(src_copy, axis=0)
    centroid_dst = np.mean(dst, axis=0)
    initial_t = centroid_dst - centroid_src
    src_copy += initial_t
    final_t += initial_t

    print("正在进行 ICP 对齐计算...")
    for i in range(max_iter):
        dists, indices = dst_tree.query(src_copy)
        mean_error = np.mean(dists)

        if abs(prev_error - mean_error) < 1e-6:
            break
        prev_error = mean_error

        # 计算变换
        R, t = compute_transformation(src_copy, dst[indices])

        # 更新
        src_copy = np.dot(src_copy, R.T) + t
        final_R = np.dot(R, final_R)
        final_t = np.dot(R, final_t) + t

    return final_R, final_t, src_copy

# --- 主程序 ---
file_slam = 'optimized_pose.txt'
file_gnss = 'gnss_pose.txt'

xyz_slam = read_kitti_pose(file_slam)
xyz_gnss = read_kitti_pose(file_gnss)

if xyz_slam is not None and xyz_gnss is not None:
    # 1. 执行 ICP 对齐
    _, _, xyz_slam_aligned = icp(xyz_slam, xyz_gnss)

    # 2. 寻找对应关系 (对于每个 SLAM 点,找最近的 GNSS 点)
    tree = KDTree(xyz_gnss)
    dists, indices = tree.query(xyz_slam_aligned)
    xyz_gnss_corresponding = xyz_gnss[indices]

    # 3. 计算各轴偏差 (Diff = SLAM - GNSS)
    diff = xyz_slam_aligned - xyz_gnss_corresponding
    diff_x = diff[:, 0]
    diff_y = diff[:, 1]
    diff_z = diff[:, 2]

    # 4. 打印统计数据
    print("\n" + "="*40)
    print(" >>> X, Y, Z 轴偏差统计 (单位: 米) <<<")
    print("="*40)
    print(f"{'Axis':<5} | {'Max':<10} | {'Min':<10} | {'Mean':<10} | {'Std Dev':<10}")
    print("-" * 55)
    print(f"{'X':<5} | {np.max(diff_x):<10.4f} | {np.min(diff_x):<10.4f} | {np.mean(diff_x):<10.4f} | {np.std(diff_x):<10.4f}")
    print(f"{'Y':<5} | {np.max(diff_y):<10.4f} | {np.min(diff_y):<10.4f} | {np.mean(diff_y):<10.4f} | {np.std(diff_y):<10.4f}")
    print(f"{'Z':<5} | {np.max(diff_z):<10.4f} | {np.min(diff_z):<10.4f} | {np.mean(diff_z):<10.4f} | {np.std(diff_z):<10.4f}")
    print("-" * 55)
    print("注意:正值表示 SLAM 坐标 > GNSS 坐标")

    # 5. 绘图
    fig, axs = plt.subplots(3, 1, figsize=(10, 10), sharex=True)

    # 生成 x 轴 (帧数索引)
    frames = np.arange(len(diff))

    # X 轴偏差
    axs[0].plot(frames, diff_x, 'r-', linewidth=1)
    axs[0].axhline(0, color='black', linestyle='--', linewidth=0.5)
    axs[0].set_ylabel('X Error (m)')
    axs[0].set_title('X Axis Deviation (SLAM - GNSS)')
    axs[0].grid(True, which='both', linestyle='--', alpha=0.7)

    # Y 轴偏差
    axs[1].plot(frames, diff_y, 'g-', linewidth=1)
    axs[1].axhline(0, color='black', linestyle='--', linewidth=0.5)
    axs[1].set_ylabel('Y Error (m)')
    axs[1].set_title('Y Axis Deviation (SLAM - GNSS)')
    axs[1].grid(True, which='both', linestyle='--', alpha=0.7)

    # Z 轴偏差
    axs[2].plot(frames, diff_z, 'b-', linewidth=1)
    axs[2].axhline(0, color='black', linestyle='--', linewidth=0.5)
    axs[2].set_ylabel('Z Error (m)')
    axs[2].set_title('Z Axis Deviation (SLAM - GNSS)')
    axs[2].set_xlabel('SLAM Frame Index')
    axs[2].grid(True, which='both', linestyle='--', alpha=0.7)

    plt.tight_layout()
    plt.show()
tum格式
要想要通过tum格式来进行evo,需要先记录相关的数据,这里提供两种方案,一种是订阅形式,订阅/odometry/navsat等所有需要的odometry话题数据
:
#!/usr/bin/env python3
# -*- coding: utf-8 -*-

import rospy
from nav_msgs.msg import Odometry
import os

class OdomRecorder:
    def __init__(self):
        rospy.init_node('odom_to_tum_recorder', anonymous=True)

        # ================= 配置区域 =================
        # 格式: 'ROS话题名': '保存的文件名'
        self.topic_mapping = {
            '/odometry/navsat':        'gps_raw.tum',      # 原始GPS
            '/odometry/gps':           'gps_flat.tum',     # 去除高度的GPS
            '/odometry/imu':           'imu_odom.tum',     # IMU里程计
            '/lio_sam/mapping/odometry': 'slam_pose.tum',   # LIO-SAM SLAM结果
            '/odometry/imu_incremental':           'imu_odom_incremental.tum',     # IMU里程计增量
            '/lio_sam/mapping/odometry_incremental':           'slam_pose_incremental.tum'     # LIO-SAM SLAM结果增量
        }
        # ===========================================

        self.file_handles = {}
        self.subscribers = []

        # 1. 打开文件并准备写入
        for topic, filename in self.topic_mapping.items():
            try:
                # 使用 'w' 模式覆盖旧文件,如果想追加请用 'a'
                f = open(filename, 'w')
                self.file_handles[topic] = f
                rospy.loginfo(f"正在录制话题: {topic} -> 保存为: {filename}")
            except IOError as e:
                rospy.logerr(f"无法打开文件 {filename}: {e}")

        # 2. 建立订阅者
        for topic in self.topic_mapping:
            # 使用 lambda 闭包来传递 topic 参数,确保回调函数知道数据来自哪个话题
            sub = rospy.Subscriber(topic, Odometry, self.callback, callback_args=topic)
            self.subscribers.append(sub)

        rospy.loginfo("开始录制... 按 Ctrl+C 停止并保存。")
        rospy.spin()

    def callback(self, msg, topic_name):
        """
        处理里程计回调,写入 TUM 格式
        TUM 格式: timestamp x y z qx qy qz qw
        """
        if topic_name in self.file_handles:
            file_handle = self.file_handles[topic_name]

            # 获取时间戳 (秒.纳秒)
            timestamp = msg.header.stamp.to_sec()

            # 获取位置
            p = msg.pose.pose.position
            # 获取四元数
            q = msg.pose.pose.orientation

            # 格式化字符串 (保留6位小数)
            line = f"{timestamp:.6f} {p.x:.6f} {p.y:.6f} {p.z:.6f} {q.x:.6f} {q.y:.6f} {q.z:.6f} {q.w:.6f}\n"

            # 写入文件
            file_handle.write(line)
            # 刷新缓冲区,防止程序崩溃导致数据丢失 (会轻微影响性能,但更安全)
            file_handle.flush()

    def cleanup(self):
        """关闭所有文件句柄"""
        rospy.loginfo("正在关闭文件...")
        for f in self.file_handles.values():
            f.close()
        rospy.loginfo("录制完成。")

if __name__ == '__main__':
    recorder = OdomRecorder()
    # 注册关闭时的清理函数
    rospy.on_shutdown(recorder.cleanup)
开始记录后,最后直接ctrl+c就可以保存对应的tum数据了.
第二种,我们直接读取bag中的话题数据来构建tum文件:
#!/usr/bin/env python3
# -*- coding: utf-8 -*-

"""
从 rosbag 中自动查找所有 nav_msgs/Odometry 话题,并导出为 TUM 文件。

TUM 格式: timestamp x y z qx qy qz qw

用法示例:
    python3 tum_record_by_bag.py odometry.bag -o tum_out
"""

import os
import argparse

import rosbag
# 这里只导入一下类型名字,后面不再用 isinstance 过滤
from nav_msgs.msg import Odometry


# 一些“特别命名”的映射优先规则
SPECIAL_NAME_MAPPING = {
    "/odometry/navsat": "gps_raw.tum",
    "/odometry/gps": "gps_flat.tum",
    "/odometry/imu": "imu_odom.tum",
    "/lio_sam/mapping/odometry": "slam_pose.tum",
    "/odometry/imu_incremental": "imu_odom_incremental.tum",
    "/lio_sam/mapping/odometry_incremental": "slam_pose_incremental.tum",
}


def sanitize_topic_to_filename(topic_name: str) -> str:
    """
    把 ROS 话题名转成一个安全的文件名,例如:
        "/lio_sam/mapping/odometry" -> "lio_sam_mapping_odometry.tum"
    """
    if topic_name in SPECIAL_NAME_MAPPING:
        return SPECIAL_NAME_MAPPING[topic_name]

    name = topic_name.strip("/")
    if not name:
        name = "root"
    name = name.replace("/", "_")
    return name + ".tum"


def export_bag_to_tum(bag_path: str, output_dir: str):
    """
    从单个 bag 中导出所有 nav_msgs/Odometry 话题到 TUM 文件
    """
    print(f"[bag_to_tum] 处理 bag: {bag_path}")
    if not os.path.isfile(bag_path):
        print(f"[bag_to_tum]  *** 找不到文件: {bag_path}")
        return

    if not os.path.exists(output_dir):
        os.makedirs(output_dir)

    bag = rosbag.Bag(bag_path, "r")

    # 1. 查看 bag 中所有话题和类型
    topics_info = bag.get_type_and_topic_info().topics  # dict: topic -> TopicInfo

    odom_topics = []
    print("[bag_to_tum] bag 中所有话题:")
    for topic, info in topics_info.items():
        print(f"  - {topic} ({info.msg_type}), msgs: {info.message_count}")
        # 只挑 nav_msgs/Odometry 类型
        if info.msg_type == "nav_msgs/Odometry":
            odom_topics.append(topic)

    if not odom_topics:
        print("[bag_to_tum]  *** 没有找到任何 nav_msgs/Odometry 话题,不能导出 TUM。")
        bag.close()
        return

    print("\n[bag_to_tum] 将导出以下 Odometry 话题:")
    file_handles = {}
    for topic in odom_topics:
        filename = sanitize_topic_to_filename(topic)
        filepath = os.path.join(output_dir, filename)
        try:
            fh = open(filepath, "w")
            file_handles[topic] = fh
            print(f"  - {topic} -> {filepath}")
        except IOError as e:
            print(f"  ! 无法打开文件 {filepath}: {e}")

    if not file_handles:
        print("[bag_to_tum]  *** 没有成功打开任何输出文件。")
        bag.close()
        return

    # 2. 遍历这些话题的消息并写入 TUM
    print("\n[bag_to_tum] 开始遍历 bag 消息并写入 TUM ...")
    msg_count = {topic: 0 for topic in file_handles.keys()}

    # 注意:不再使用 isinstance(msg, Odometry) 过滤,直接相信 get_type_and_topic_info 的结果
    for topic, msg, t in bag.read_messages(topics=list(file_handles.keys())):
        fh = file_handles.get(topic, None)
        if fh is None:
            continue

        # 时间戳: 优先用消息本身的 header.stamp
        stamp = msg.header.stamp.to_sec()
        if stamp <= 0:
            stamp = t.to_sec()

        # 位置
        p = msg.pose.pose.position
        x, y, z = p.x, p.y, p.z

        # 特殊处理: /odometry/gps -> z = 0.0 (去除高度)
        if topic == "/odometry/gps":
            z = 0.0

        # 四元数
        q = msg.pose.pose.orientation
        qx, qy, qz, qw = q.x, q.y, q.z, q.w

        line = f"{stamp:.6f} {x:.6f} {y:.6f} {z:.6f} {qx:.6f} {qy:.6f} {qz:.6f} {qw:.6f}\n"

        try:
            fh.write(line)
            msg_count[topic] += 1
        except Exception as e:
            print(f"  ! 写入 {topic} 时出错: {e}")

    bag.close()

    # 3. 关闭文件 & 打印统计
    print("\n[bag_to_tum] 写入完成,统计:")
    for topic, fh in file_handles.items():
        fh.close()
        print(f"  - {topic}: {msg_count[topic]} 条消息")

    print(f"[bag_to_tum] 输出目录: {output_dir}")
    print("[bag_to_tum] 完成。")


def main():
    parser = argparse.ArgumentParser(
        description="从 rosbag 自动提取所有 nav_msgs/Odometry 话题为 TUM 文件"
    )
    parser.add_argument("bag", help="输入的 .bag 文件路径")
    parser.add_argument(
        "-o",
        "--output_dir",
        type=str,
        default="tum_out",
        help="输出 TUM 文件目录(默认 tum_out)",
    )

    args = parser.parse_args()

    export_bag_to_tum(args.bag, args.output_dir)


if __name__ == "__main__":
    main()
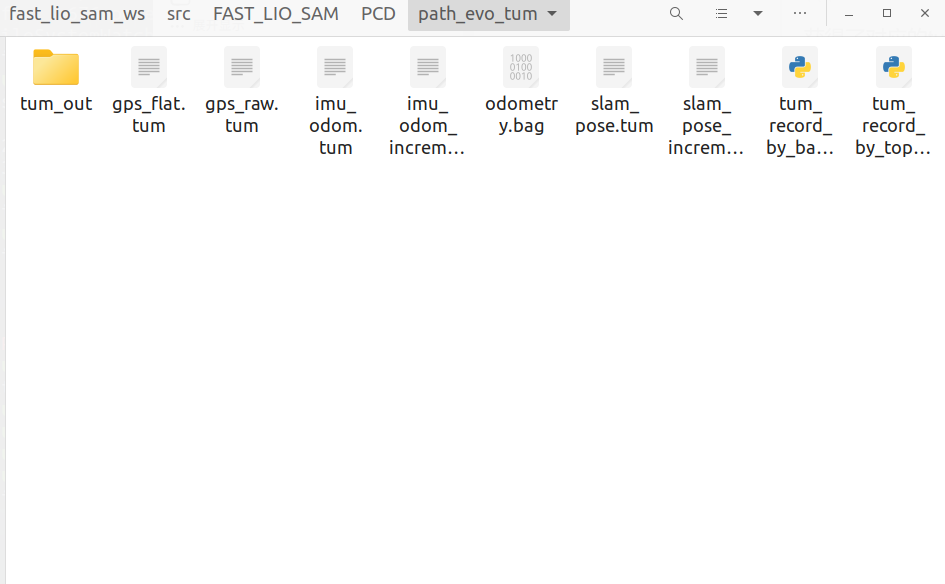
获得了对应的tum文件:
此时我们就可以来可视化轨迹了,注意,这里我们先验证一下这里的gps原始的odom和处理过后的odom的区别
evo_traj tum gps_flat.tum gps_raw.tum -p
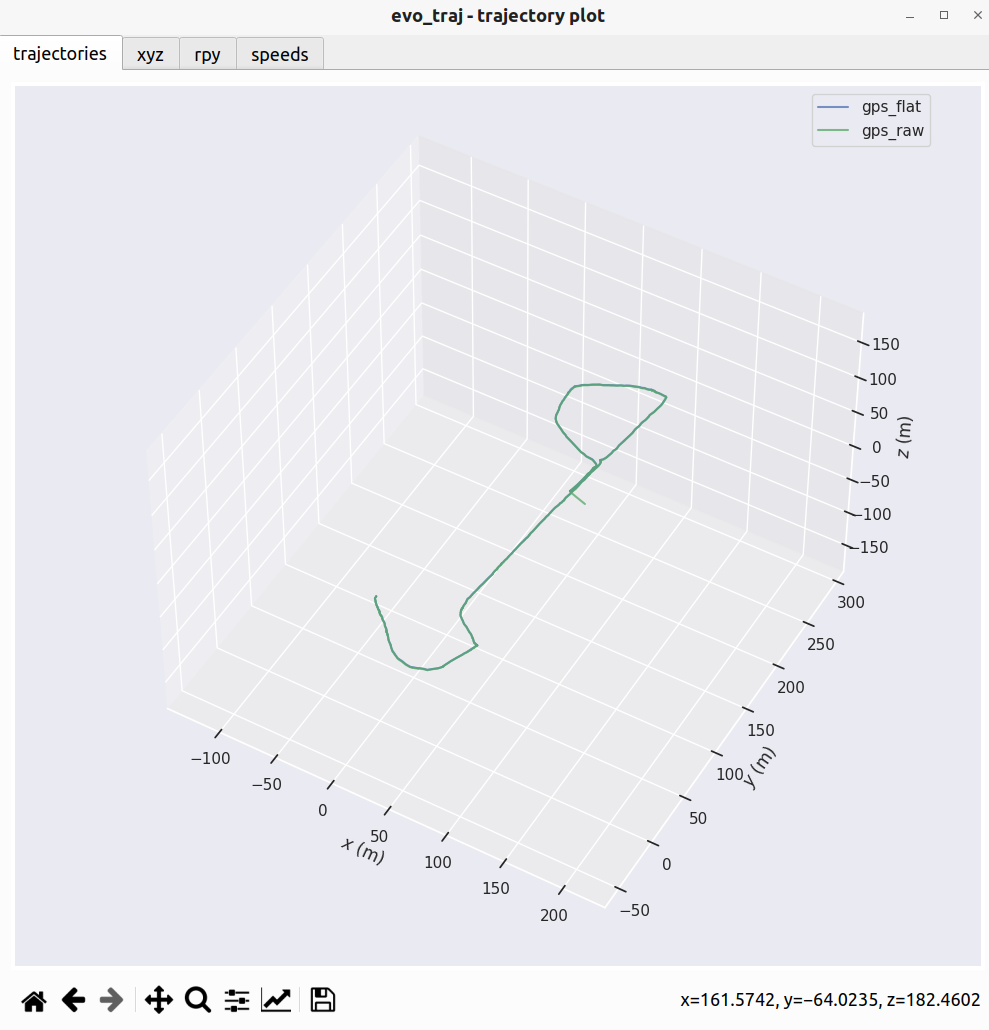
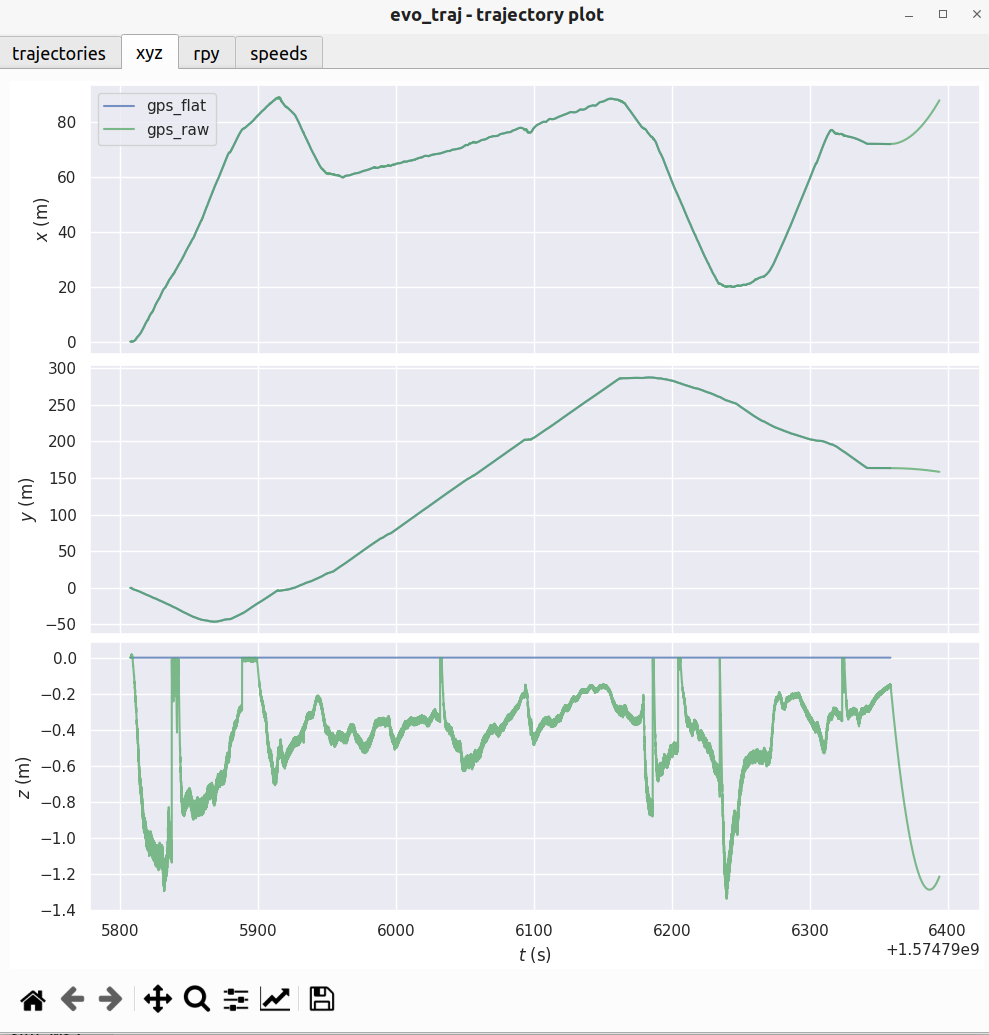
可以看到只有高度的区别!!!
有了tum文件之后就能够正常的对其slam轨迹和gps轨迹了,通过上面gps可以看出来,其实使用gps_flat或者gps_raw都是同样的效果.
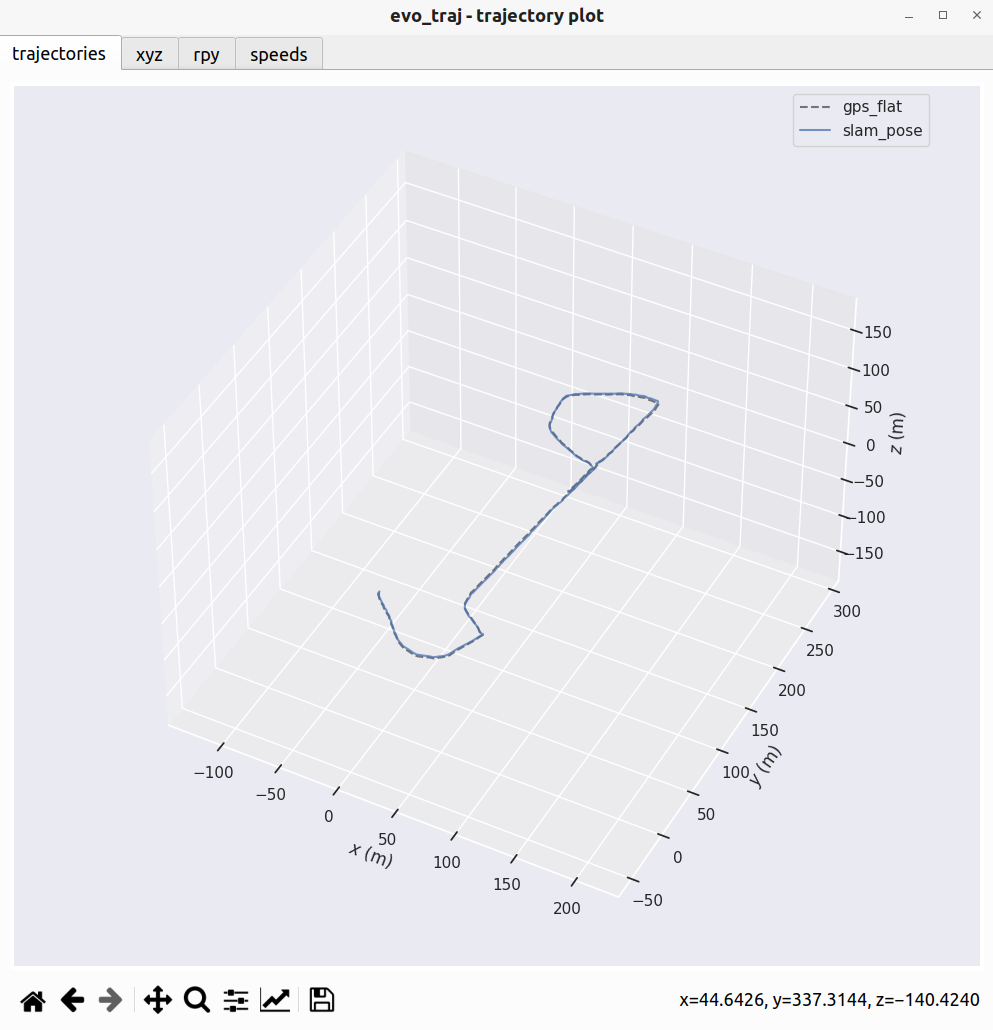
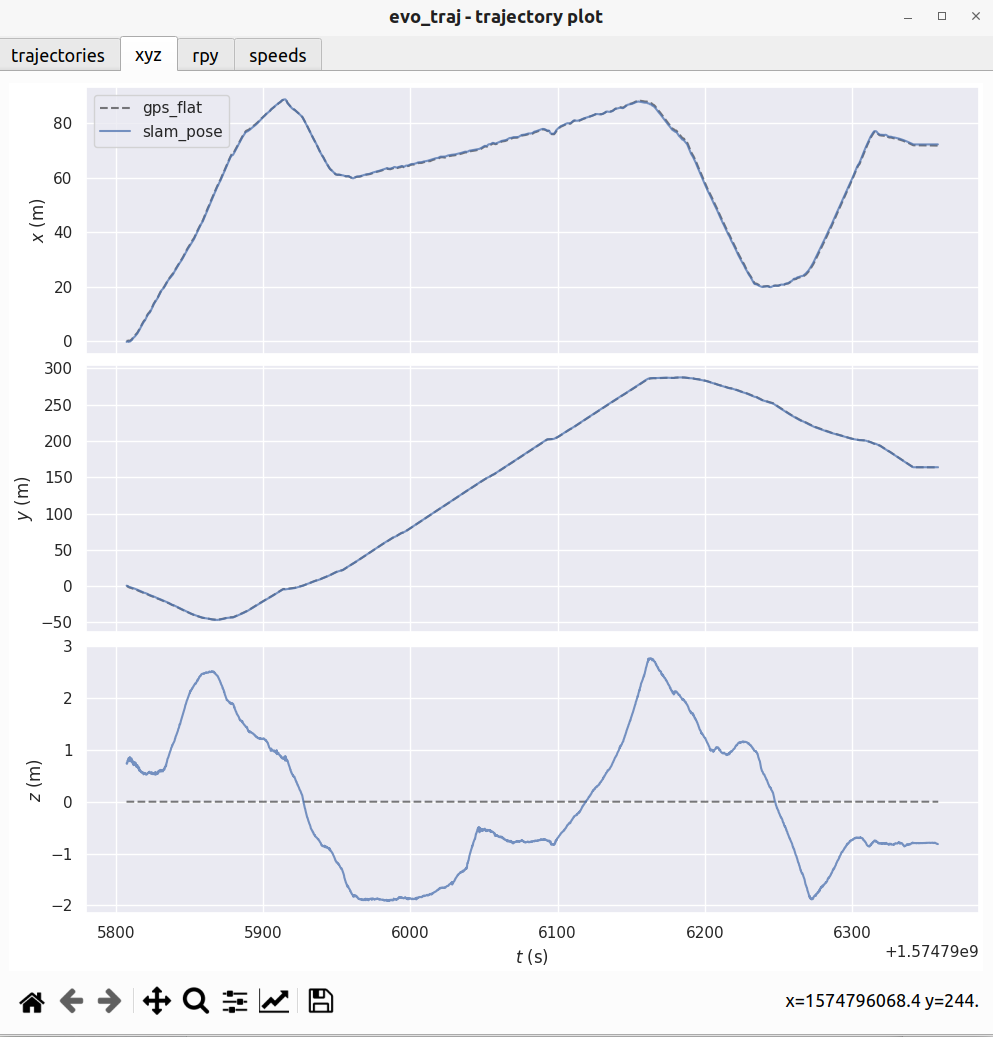
evo_traj tum slam_pose.tum --ref=gps_flat.tum --align --plot --t_max_diff 0.1
涉及到对其,我们把时间差阈值设置为0.1s
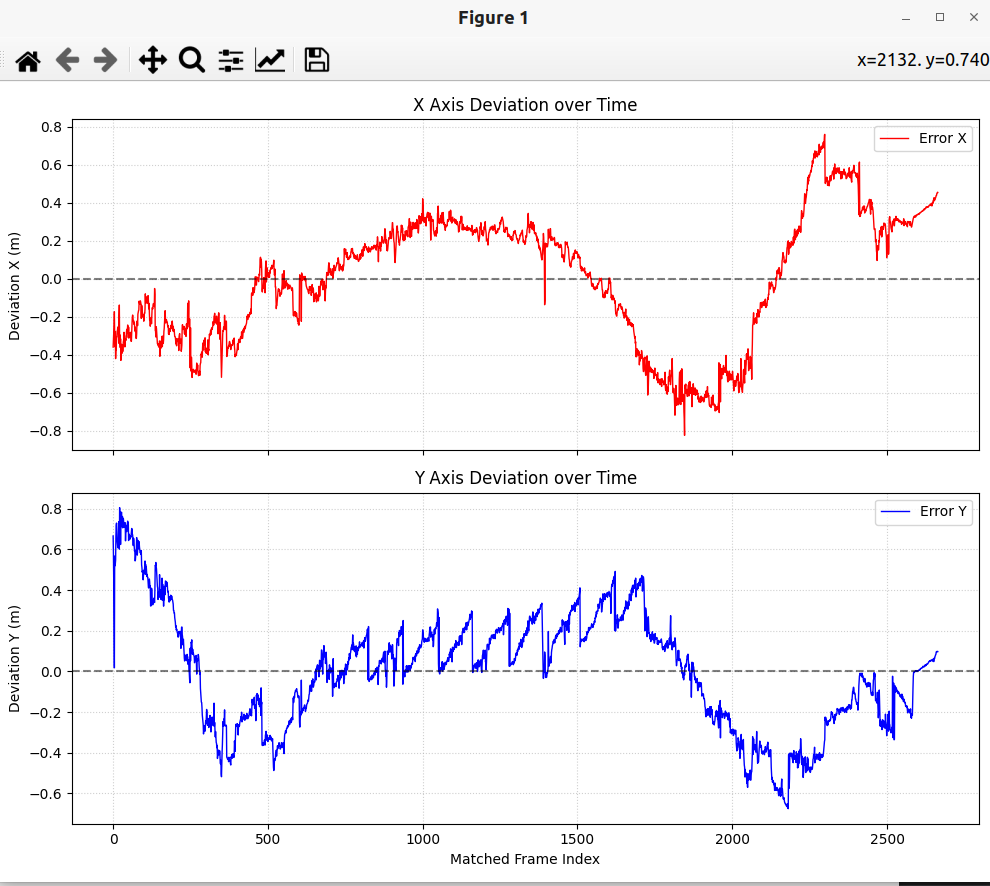
然后通过一下程序计算偏差:
import numpy as np
import matplotlib.pyplot as plt

def read_tum(file_path):
    """
    读取 TUM 格式文件
    格式: timestamp x y z qx qy qz qw
    返回: (N, 8) 的 numpy 数组
    """
    try:
        data = np.loadtxt(file_path)
        # 按时间戳排序,防止乱序
        data = data[data[:, 0].argsort()]
        return data
    except Exception as e:
        print(f"读取文件 {file_path} 失败: {e}")
        return None

def associate_trajectories(slam_data, ref_data, max_diff=0.1):
    """
    基于时间戳关联数据
    slam_data: (N, 8)
    ref_data:  (M, 8)
    max_diff:  最大允许的时间差 (秒)

    返回: 匹配后的 (K, 3) SLAM 位置 和 (K, 3) REF 位置
    """
    matches_slam = []
    matches_ref = []

    ref_times = ref_data[:, 0]

    print(f"正在进行时间戳同步... (阈值: {max_diff}s)")

    # 对于每一个 SLAM 点,寻找最近的 REF 点
    for i in range(len(slam_data)):
        t_slam = slam_data[i, 0]

        # 在 ref_times 中找到最接近 t_slam 的索引
        idx = np.searchsorted(ref_times, t_slam)

        # 检查 idx 和 idx-1 哪个更近
        candidates = []
        if idx < len(ref_times):
            candidates.append(idx)
        if idx > 0:
            candidates.append(idx - 1)

        if not candidates:
            continue

        best_idx = min(candidates, key=lambda k: abs(ref_times[k] - t_slam))
        time_diff = abs(ref_times[best_idx] - t_slam)

        if time_diff <= max_diff:
            matches_slam.append(slam_data[i, 1:4]) # x,y,z
            matches_ref.append(ref_data[best_idx, 1:4]) # x,y,z

    return np.array(matches_slam), np.array(matches_ref)

def align_umeyama(model, data):
    """
    计算从 model 到 data 的刚体变换 (R, t)
    model, data: (N, 3) 形状一致
    """
    # 计算质心
    mu_model = np.mean(model, axis=0)
    mu_data = np.mean(data, axis=0)

    # 去中心化
    model_zerocentered = model - mu_model
    data_zerocentered = data - mu_data

    # SVD
    W = np.dot(model_zerocentered.T, data_zerocentered)
    U, S, Vt = np.linalg.svd(W)

    R = np.dot(Vt.T, U.T)

    # 处理反射
    if np.linalg.det(R) < 0:
        Vt[2, :] *= -1
        R = np.dot(Vt.T, U.T)

    t = mu_data - np.dot(R, mu_model)

    return R, t

# --- 主程序 ---
file_slam = 'slam_pose.tum'       # 你的 SLAM 文件
file_ref = 'gps_flat.tum'         # 你的去高度 GPS 文件

# 1. 读取数据
slam_raw = read_tum(file_slam)
ref_raw = read_tum(file_ref)

if slam_raw is not None and ref_raw is not None:
    # 2. 数据关联 (核心步骤)
    # 只有找到对应时间戳的点,才有资格进行比较
    p_slam_matched, p_ref_matched = associate_trajectories(slam_raw, ref_raw, max_diff=0.1)

    print(f"原始点数 -> SLAM: {len(slam_raw)}, GPS: {len(ref_raw)}")
    print(f"时间同步后匹配点数: {len(p_slam_matched)}")

    if len(p_slam_matched) < 10:
        print("[错误] 匹配点数太少!请检查两个文件的时间戳是否在同一个时间段(例如是否都是 Unix 时间戳)。")
    else:
        # 3. 计算对齐矩阵 (Umeyama)
        # 这一步是为了消除 SLAM 和 GPS 坐标系之间的初始旋转和平移差异
        R, t = align_umeyama(p_slam_matched, p_ref_matched)

        # 4. 将变换应用到匹配后的 SLAM 数据上
        p_slam_aligned = np.dot(p_slam_matched, R.T) + t

        # 5. 计算偏差 (Error)
        # diff 每一行是 [dx, dy, dz]
        diff = p_slam_aligned - p_ref_matched

        error_x = diff[:, 0]
        error_y = diff[:, 1]
        error_z = diff[:, 2] # 即使是 gps_flat,也可以看看 z 的偏差情况

        # 统计指标
        rmse_x = np.sqrt(np.mean(error_x**2))
        rmse_y = np.sqrt(np.mean(error_y**2))
        rmse_total = np.sqrt(np.mean(np.sum(diff[:,:2]**2, axis=1))) # 只计算 XY 的 RMSE

        print("\n" + "="*40)
        print(" >>> 2D (XY) 偏差统计 <<<")
        print("="*40)
        print(f"RMSE (XY平面): {rmse_total:.4f} m")
        print(f"X轴 RMSE: {rmse_x:.4f} m | Max: {np.max(np.abs(error_x)):.4f} m")
        print(f"Y轴 RMSE: {rmse_y:.4f} m | Max: {np.max(np.abs(error_y)):.4f} m")

        # 6. 绘图
        fig, axs = plt.subplots(2, 1, figsize=(10, 8), sharex=True)

        # 生成 x 轴 (使用数据点的索引,也可以改为时间)
        steps = np.arange(len(error_x))

        # Plot X Error
        axs[0].plot(steps, error_x, 'r-', linewidth=1, label='Error X')
        axs[0].axhline(0, color='k', linestyle='--', alpha=0.5)
        axs[0].set_ylabel('Deviation X (m)')
        axs[0].set_title('X Axis Deviation over Time')
        axs[0].legend(loc='upper right')
        axs[0].grid(True, linestyle=':', alpha=0.6)

        # Plot Y Error
        axs[1].plot(steps, error_y, 'b-', linewidth=1, label='Error Y')
        axs[1].axhline(0, color='k', linestyle='--', alpha=0.5)
        axs[1].set_ylabel('Deviation Y (m)')
        axs[1].set_xlabel('Matched Frame Index')
        axs[1].set_title('Y Axis Deviation over Time')
        axs[1].legend(loc='upper right')
        axs[1].grid(True, linestyle=':', alpha=0.6)

        plt.tight_layout()
        plt.show()
然后我们需要获得这两条轨迹的tf关系,通过以下程序获得
import numpy as np
import matplotlib.pyplot as plt
from mpl_toolkits.mplot3d import Axes3D
def read_tum(file_path):
try:
data = np.loadtxt(file_path)
data = data[data[:, 0].argsort()]
return data
except Exception as e:
print(f"读取失败 {file_path}: {e}")
return None
def associate_and_align(slam, gps, max_diff=0.1):
"""计算从 GPS 到 SLAM 的变换 (目标是将 GPS 搬运到 SLAM 坐标系)"""
matches_slam = []
matches_gps = []
gps_times = gps[:, 0]
# 时间同步
for i in range(len(slam)):
t = slam[i, 0]
idx = np.searchsorted(gps_times, t)
if 0 < idx < len(gps_times):
candidates = [idx, idx - 1]
best = min(candidates, key=lambda k: abs(gps_times[k] - t))
if abs(gps_times[best] - t) <= max_diff:
matches_slam.append(slam[i, 1:4])
matches_gps.append(gps[best, 1:4])
p_slam = np.array(matches_slam)
p_gps = np.array(matches_gps)
if len(p_slam) < 5:
print("有效匹配点太少,无法估计变换。")
return None, None
# Umeyama / Kabsch:求 R, t 使得 p_gps @ R^T + t = p_slam
mu_s = np.mean(p_slam, axis=0)
mu_g = np.mean(p_gps, axis=0)
s_centered = p_slam - mu_s
g_centered = p_gps - mu_g
H = np.dot(g_centered.T, s_centered) # GPS → SLAM
U, S, Vt = np.linalg.svd(H)
R = np.dot(Vt.T, U.T)
# 处理反射
if np.linalg.det(R) < 0:
Vt[2, :] *= -1
R = np.dot(Vt.T, U.T)
# 行向量形式:p_s = p_g @ R^T + t ⇒ t = μ_s - μ_g @ R^T
t = mu_s - np.dot(mu_g, R.T)
return R, t
# --- 主程序 ---
file_slam = 'slam_pose.tum'
file_gps = 'gps_flat.tum'
slam_data = read_tum(file_slam)
gps_data = read_tum(file_gps)
if slam_data is not None and gps_data is not None:
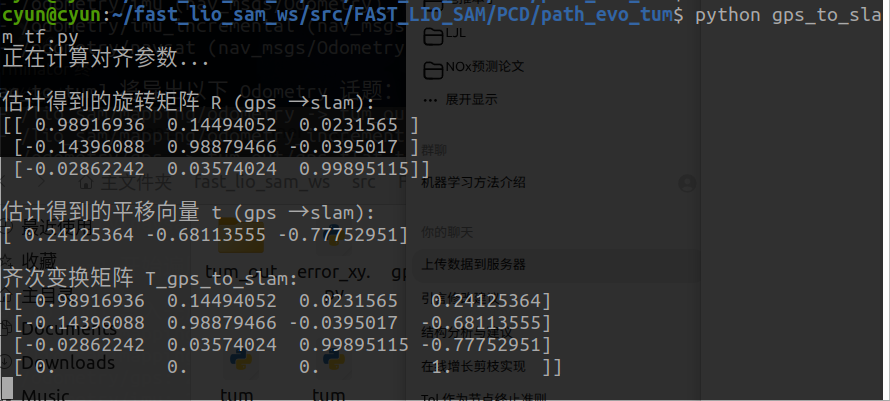
print("正在计算对齐参数...")
# 计算把 GPS 变换到 SLAM 的参数
R, t = associate_and_align(slam_data, gps_data)
if R is not None:
# ====== 在这里打印参数矩阵 ======
print("\n估计得到的旋转矩阵 R (gps → slam):")
print(R)
print("\n估计得到的平移向量 t (gps → slam):")
print(t)
T = np.eye(4)
T[:3, :3] = R
T[:3, 3] = t
print("\n齐次变换矩阵 T_gps_to_slam:")
print(T)
# ==============================
# 1. 准备数据
xyz_slam = slam_data[:, 1:4]
xyz_gps_raw = gps_data[:, 1:4]
# 2. "GPS Aligned":应用 TF → p_s = p_g @ R^T + t
xyz_gps_aligned = np.dot(xyz_gps_raw, R.T) + t
# 3. "GPS Raw (Shifted)":仅平移到 SLAM 起点,保留原形状
start_offset = xyz_slam[0] - xyz_gps_raw[0]
xyz_gps_shifted = xyz_gps_raw + start_offset
# --- 绘图 ---
fig = plt.figure(figsize=(12, 10))
ax = fig.add_subplot(111, projection='3d')
# 轨迹 A: SLAM (Original) - 蓝色
ax.plot(xyz_slam[:, 0], xyz_slam[:, 1], xyz_slam[:, 2],
c='blue', linewidth=2, label='SLAM (Original)')
# 轨迹 B: GPS (Aligned) - 红色虚线
ax.plot(xyz_gps_aligned[:, 0], xyz_gps_aligned[:, 1], xyz_gps_aligned[:, 2],
c='red', linestyle='--', linewidth=2, label='GPS (Transformed via TF)')
# 轨迹 C: GPS (Raw, Shifted) - 绿色点划线
ax.plot(xyz_gps_shifted[:, 0], xyz_gps_shifted[:, 1], xyz_gps_shifted[:, 2],
c='green', linestyle=':', linewidth=1, alpha=1.0, label='GPS (Raw Shape, Shifted)')
# 标记起点
ax.scatter(xyz_slam[0, 0], xyz_slam[0, 1], xyz_slam[0, 2],
c='k', marker='o', s=50, label='Start Point')
ax.set_title('Trajectory: SLAM vs GPS (Aligned) vs GPS (Raw)')
ax.set_xlabel('X (m)')
ax.set_ylabel('Y (m)')
ax.set_zlabel('Z (m)')
ax.legend()
# 坐标轴等比例
all_pts = np.vstack([xyz_slam, xyz_gps_aligned, xyz_gps_shifted])
max_range = np.array([
all_pts[:, 0].max() - all_pts[:, 0].min(),
all_pts[:, 1].max() - all_pts[:, 1].min(),
all_pts[:, 2].max() - all_pts[:, 2].min()
]).max() / 2.0
mid = np.mean(all_pts, axis=0)
ax.set_xlim(mid[0] - max_range, mid[0] + max_range)
ax.set_ylim(mid[1] - max_range, mid[1] + max_range)
ax.set_zlim(mid[2] - max_range, mid[2] + max_range)
plt.show()
else:
print("匹配点太少,无法估计变换。")
else:
print("TUM 文件读取失败,无法对齐。")
实现了把gps轨迹到slam的转换:
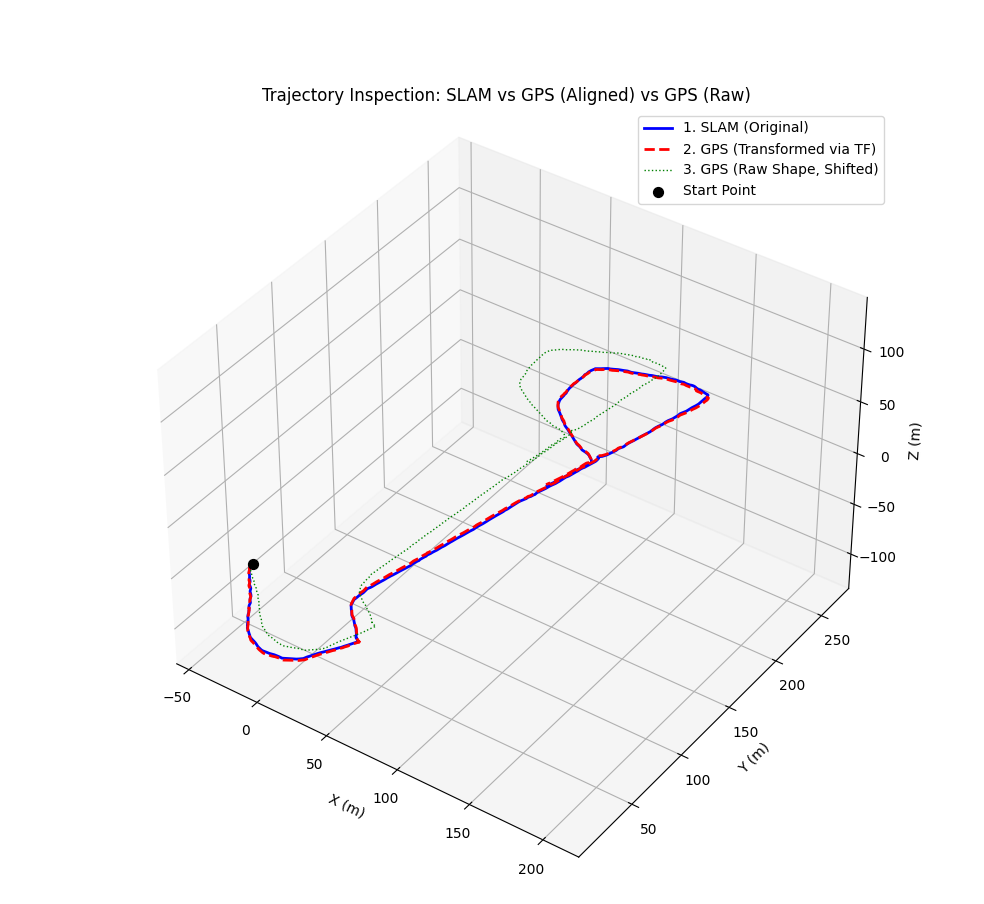
绿色是未转换的gps.得到对应的tf关系:
相关的程序放google云盘了:
https://drive.google.com/drive/folders/1e1oNJaBwd3fzmjeYzQr59pJLlEauasCc?usp=sharing
后续内容
到此为止,回放bag包的liosam算是全部使用完了,接下来是要看如何用自己的数据来建立完美的点云地图,让几个odom的定位能够很好的对齐.
这个工作包括:
- gps数据准备(主要是rtk)
- imu数据与lidar数据以及lidar与imu的标定.
- 算法的参数配置
- 适配rslidar的点云格式.


 1万+
1万+

 被折叠的 条评论
为什么被折叠?
被折叠的 条评论
为什么被折叠?
 到【灌水乐园】发言


