


 本文详细介绍了ABAP调试器的使用方法,包括如何在新旧调试器之间切换,设置外部(用户)断点,利用watchpoints进行高效调试,保存和加载调试配置,以及调试模态窗口的技巧。同时,文章还提供了跳过特定代码行的快捷键组合,并解释了在屏幕对话程序中设置断点的限制和解决方法。
The ABAP Debugger is used tool to execute and analyze programs line by line. Using it we can check the flow logic of a program and display runtime values of the variables. Currently, SAP offers two types of Debuggers:
- The Classic ABAP Debugger
- The New ABAP Debugger
The Classic ABAP Debugger, with its old user interface and its limitations to debug certain types of ABAP program is now not in use by many new and old ABAP developers.
The New ABAP Debugger, with its state of the art and flexible user interface, can be used to debug all types of ABAP programs. It provides many new features which improve our efficiency of debugging, both in ABAP support and development.
In this article, we will learn how to use these new features and discover some tips and tricks to efficiently use ABAP debugger.
Switching between the ‘Classic Debugger’ and ‘New Debugger’
You can switch between both the debugger and make any one your default debugger. To do this, go to ABAP Editor (SE38)→ Utilities → Settings.

Now in the user-specific settings pop up box click on ABAP Editor tab and then click on Debugging.
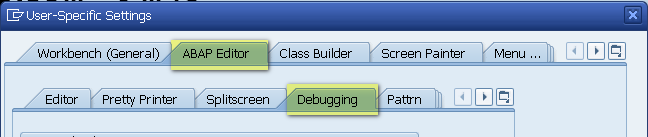
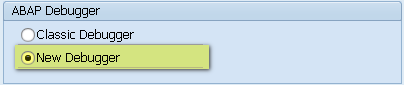
Here you can select the New Debugger radio button to make it your default debugger.
External (User) Debugging
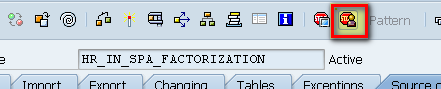
External debugging is used when we want to analyze our program which is called by an external user through HTTP such as Web Dynpro ABAP, Web Dynpro JAVA, and BSP etc. To activate external debugging we have to set external breakpoints, which can be set just like the session breakpoints by keeping the cursor on the desired code line and clicking on the ‘External Breakpoint’ icon.
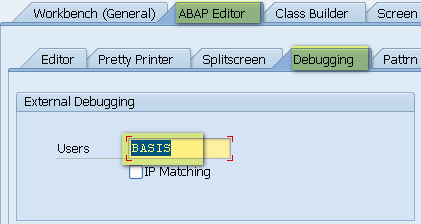
We can also set the external user for whom the breakpoint is to be activated by going to ABAP Editor (SE38)→ Utilities → Settings, and in the ‘user-specific settings’ pop up box click on ABAP Editor Tab and then click on Debugging.
Here you can specify the username.
![]()
Watchpoints
Watchpoints can be used to break the execution of a program when the values in a variable changes.
This help us to go to the exact position where the variable changes. You can also specify conditions in Watchpoint and the execution of the program will break as soon as the condition is fulfilled.
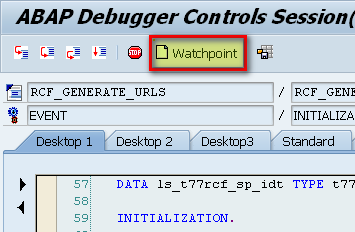
To create a Watchpoint, click to the Watchpoint button in the New ABAP Debugger.
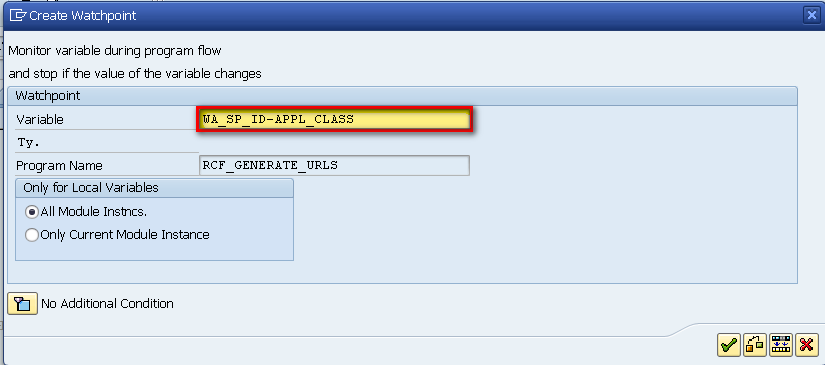
Now, in the Create Watchpoint pop up enter the variable name for which you want to create the Watchpoint.
Debugger Variants
With the help of Debugger Variant you can save the current debugger settings into the database or to a local file. These settings include breakpoints, UI customizations and other special options for debugging tools.
Next time, when you will be debugging the same application you will not have to set breakpoints again or to do all the settings again. Also, when you are working in a large team then you can also pass the debugging variants to other users.
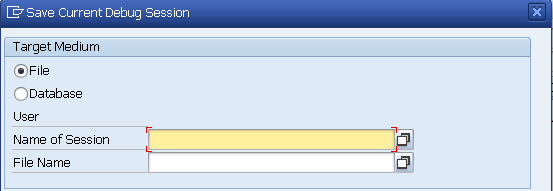
To save the ‘Debugging Variant’ go to Debugger→ Debugger Session→ Save

You can save the current debugger session either to a file or in the database.
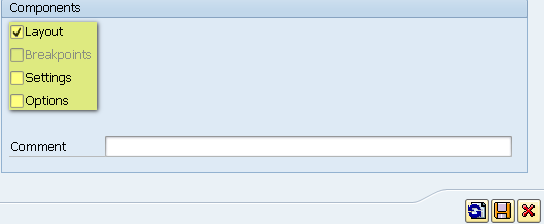
In the Debugger Variant you can save the following components :
- Layout
- Breakpoints
- Settings
- Options
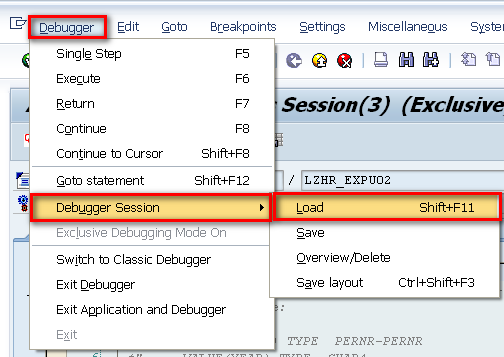
To load the saved Debugger variants go to Debugger → Debugger Session → Load
Debugging a modal window
Generally, we can activate debugging by typing /h in the command line, but what if the command line is not there?
Often you will come across modal windows and other pop-up windows command line is not present and we cannot activate debugging directly. In such cases, you can either create a SAPGUI shortcut of type ‘System Command’ and command ’/h’ or create a text file with below texts.
[FUNCTION]
Command=/H
Title=Debugger
Type=SystemCommand
To debug a modal window drag and drop the above created file over it.
Debugging Tricks
Many a times, due to an incorrect entry in a database table or a table without maintenance view we are not able to create, edit or delete a database record. In these cases we can use this debugging trick.
To do this, go to transaction code SE16.
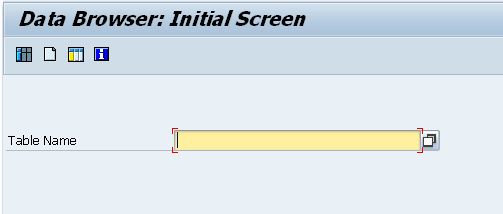
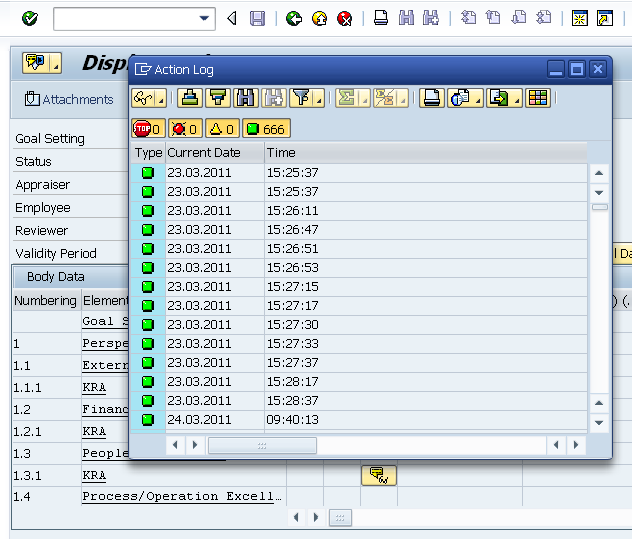
Enter the name of your database table. Select the line which you want to process, and press the display button. Enter /h in the command line and hit enter button two times.
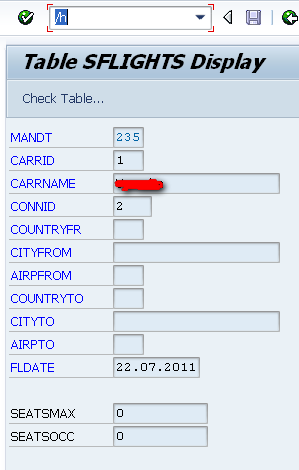
Now, the debugger window will open and you can see the source code. Click on the variable CODE, it will have ‘SHOW’ as its value.
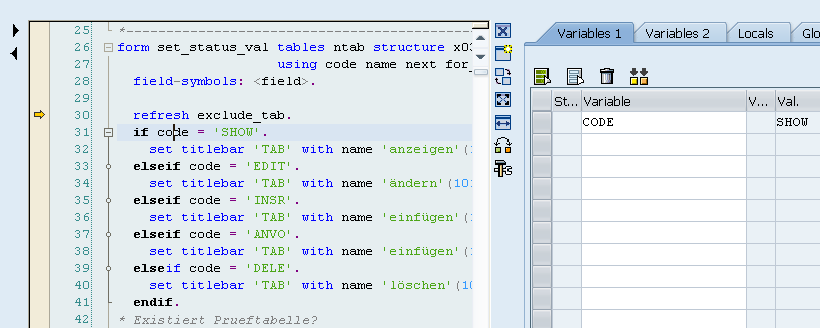
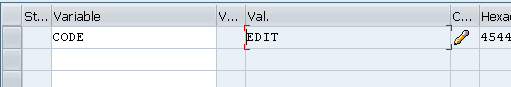
Here you can edit this variable and set the new value based on the operation you want to perform.
By setting the variable ‘CODE’ with value as ‘EDIT’ you can edit records,
‘INSR’, Insert new records
‘DELE’, Delete records
And, ‘ANVO’ is for editing the record with primary keys.
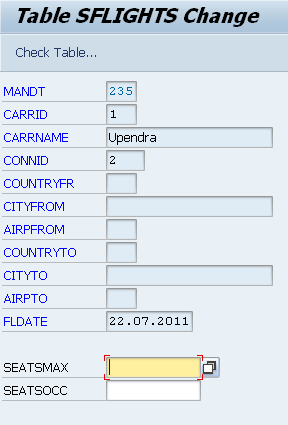
After setting the variable with the required operation, hit F8. Now, you are in EDIT mode. Press save button to save the record.
The Magic of SHIFT + F12
You can use this key combination to bypass a specific line of code such as a normal sy-subrc check or an authorization check. To jump or bypass any line/lines of code all you have to fo is just put your cursor on the desired line and then press the SHIFT + F12 key.
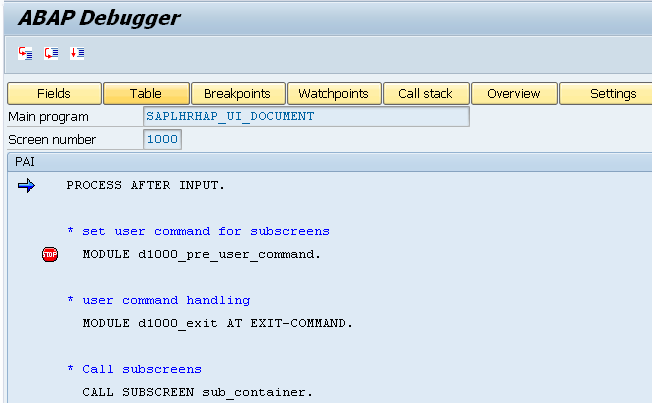
Some limitations of New ABAP debugger Screen Debugging
When you try to set breakpoints in screen/dialog programs, you get the message stating that debugging is not yet supported.
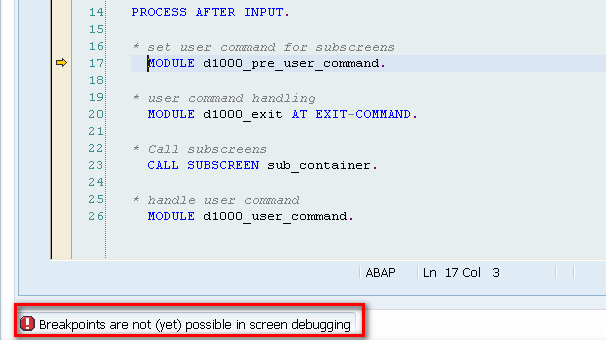
To get by this and debug your screen/dialog programs just switch back to the classical debugger.
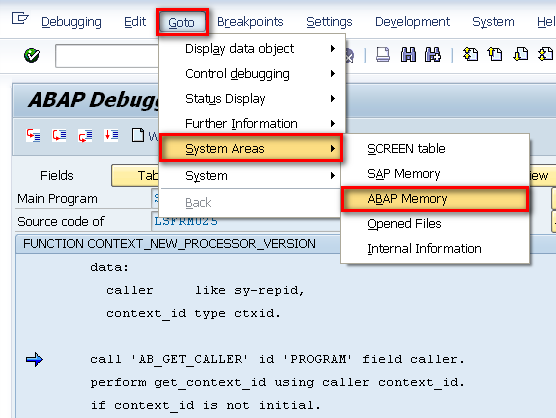
ABAP Memory ID
In the new debugger it is not possible to view the used ABAP memory ID’s and their content. But, in the classical debugger you can view the ABAP memory IDs by going to Go to → System Areas → ABAP Memory


 2101
2101

 被折叠的 条评论
为什么被折叠?
被折叠的 条评论
为什么被折叠?
 到【灌水乐园】发言


