


 本文介绍了如何使用Echarts的series.itemStyle.color属性来为柱状图的每个柱体设置不同的颜色,通过示例代码展示了从原始默认颜色到自定义颜色的效果变化。
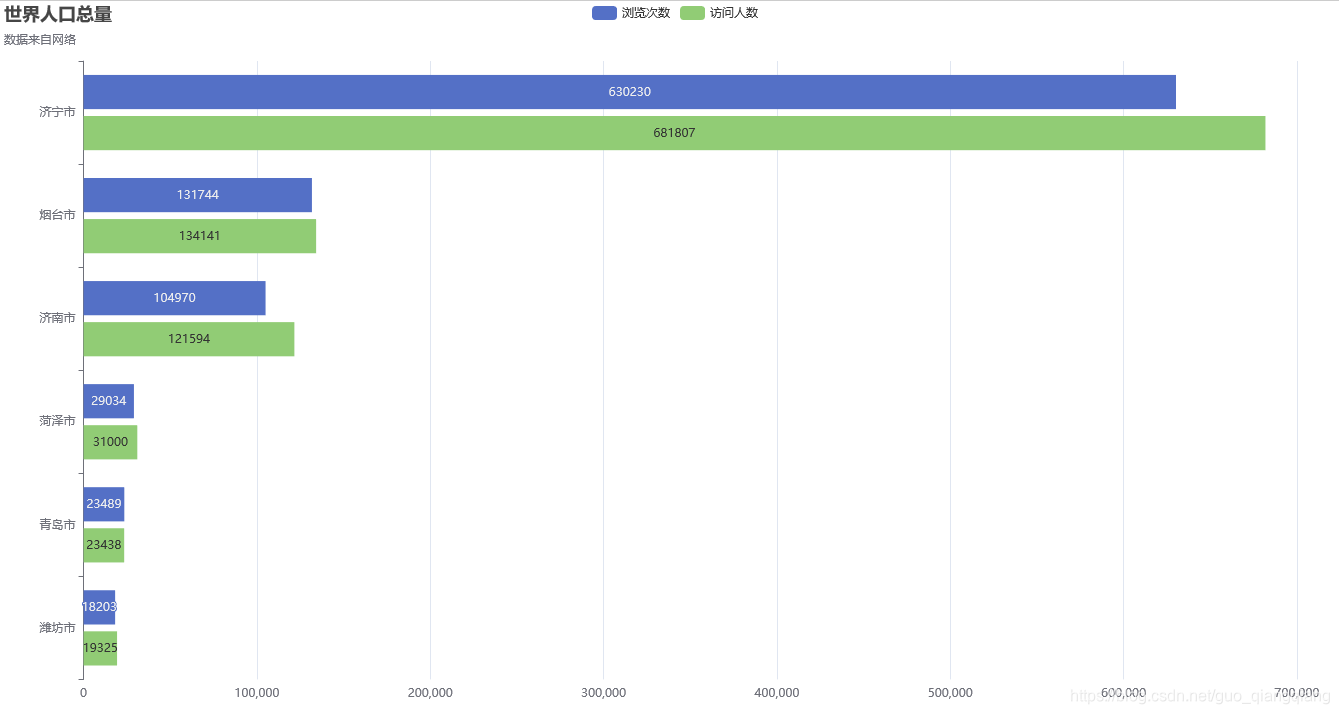
原始效果图
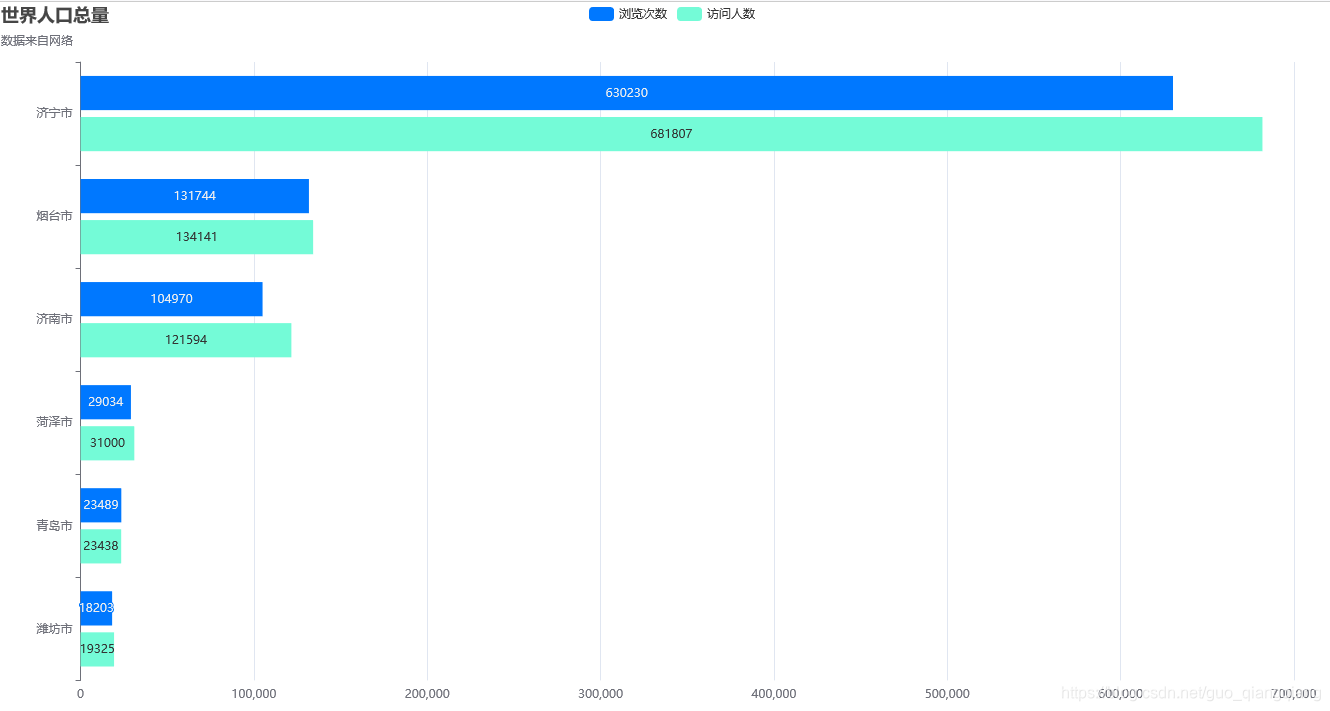
修改后效果图
关键代码
        series: [
            {
                name: '浏览次数',
                type: 'bar',
                data: [18203, 23489, 29034, 104970, 131744, 630230],
                itemStyle:{
                    color:'#0078FF',
                }
            },
            {
                name: '访问人数',
                type: 'bar',
                data: [19325, 23438, 31000, 121594, 134141, 681807],
                itemStyle:{
                    color:'#74FBD7',
                }
            }
        ]
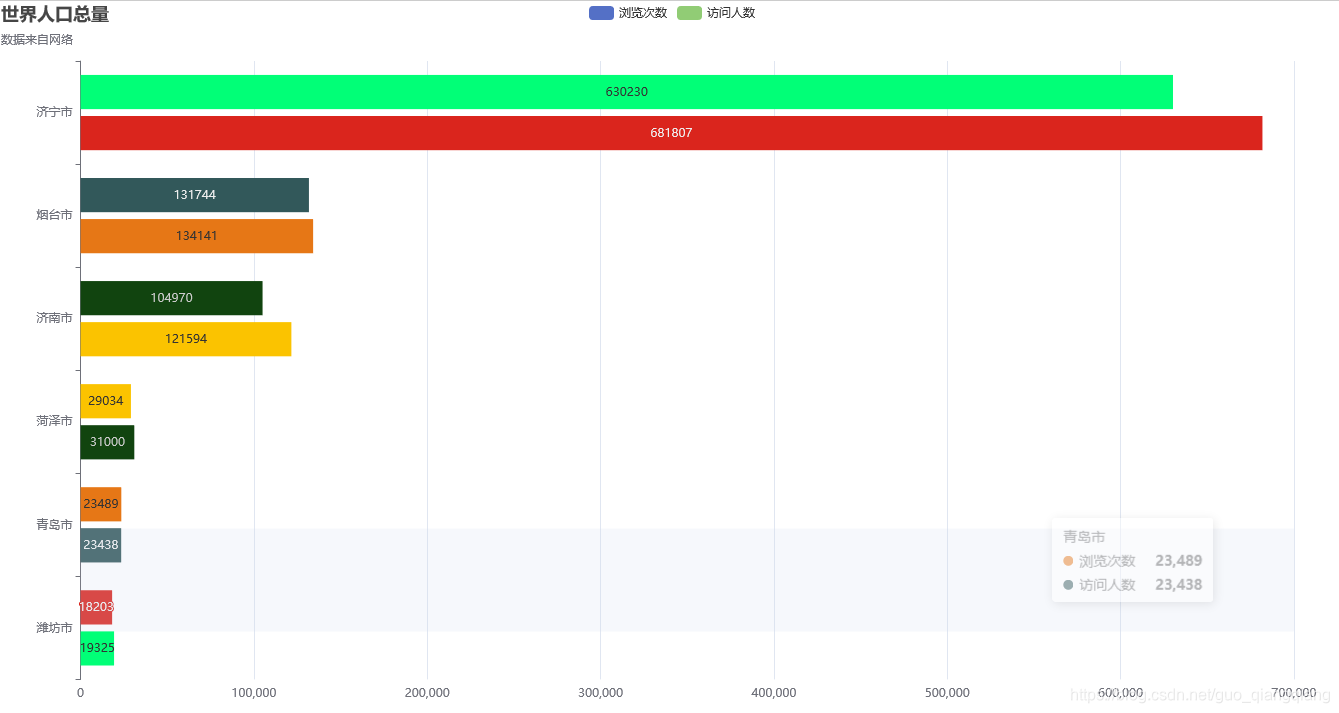
条形图设置不同颜色
series: [
            {
                name: '浏览次数',
                type: 'bar',
                data: [18203, 23489, 29034, 104970, 131744, 630230],
                itemStyle: {
                    color: function (params) {
                        var colorlist = ['#DA251D', '#E67716', '#FBC300', '#11440f', '#32585a', '#00ff77'];
                        return colorlist[params.dataIndex];
                    }
                }
            },
            {
                name: '访问人数',
                type: 'bar',
                data: [19325, 23438, 31000, 121594, 134141, 681807],
                itemStyle: {
                    color: function (params) {
                        var colorlist = ['#00ff77', '#32585a', '#11440f', '#FBC300', '#E67716', '#DA251D'];
                        return colorlist[params.dataIndex];
                    }
                }
            }
        ]


 1万+
1万+

 被折叠的 条评论
为什么被折叠?
被折叠的 条评论
为什么被折叠?
 到【灌水乐园】发言


