


 博客围绕柱状图相关设置展开,介绍了千分号与单位的添加方法,包括图标设置、数字每三位打千分号及加单位的操作。还给出全部代码、示例代码,展示了柱状图鼠标滑过显示单位的关键代码及效果图,提及拓展属性和打印 params 相关内容。
echarts 柱状图 鼠标悬浮显示 图标+数字每三位打千分号+单位
千分号+单位
1.图标:params[i].marker
2.数字每三位打千分号:params[i].value.toLocaleString()
3.加单位:如下
 formatter:function(params)
      {
          var relVal = params[0].name;
          for (var i = 0, l = params.length; i < l; i++) {
               relVal +='<br/>' + params[i].marker+params[i].seriesName + ' : ' + params[i].value.toLocaleString()+"K";
           }
          return relVal;
       }
   },
全部代码
barLine:function(){
        this.chartBars=this.$echarts.init(document.getElementById("bar"));
         this.chartBars.setOption({
             tooltip: {
                 trigger: 'axis',
                 axisPointer: {
                     type: 'cross',
                     crossStyle: {
                         color: '#999'
                     }
                 },
                 formatter:function(params)
                 {
                    var relVal = params[0].name;
                    for (var i = 0, l = params.length; i < l; i++) {
                         relVal +='<br/>' + params[i].marker+params[i].seriesName + ' : ' + params[i].value.toLocaleString()+"K";
                     }
                    return relVal;
                 }
             },
             grid: {
                 left: '3%',
                 right: '3%',
                 bottom: '0%',
                 top:'10%',
                 containLabel: true
             },
             xAxis: [
                 {
                     type: 'category',
                     data: this.dateTen,
                     axisPointer: {
                         type: 'shadow'
                     }
                 }
             ],
             yAxis:
             {
                 type: 'value',
                 splitLine: {show: false}

             },
             series: [
                 {
                     name:'账单金额',
                     type:'bar',
                     data:this.recentOctoberBill,
                     color: ['#87CEFA'],
                     barWidth: '65%',
                     label: {
                         normal: {
                             color:'#000',
                             show: true,
                             position: 'inside',
                             "formatter": function(a){return a.value.toLocaleString()+'k'}
                         }
                     }
                 },
                 {
                     name:'账单金额',
                     type:'line',
                     data:this.recentOctoberBill,
                     itemStyle:{
                         normal:{
                             lineStyle:{
                                 type:'dotted'  //'dotted'虚线 'solid'实线
                             }
                         }
                     },
                     label: {
                         normal: {
                             color:'#000',
                             show: true,
                             position: 'top',
                             "formatter": function(a){return a.value.toLocaleString()+'k'}
                         }
                     }
                 }
             ]
         })
     },
示例代码
 function top_chart() {

        var top_shop = echarts.init(document.getElementById('top_id'));
        var top_shop_option = {
            title: {
                text: '订单来源分析',
                x: 'center'
            },
            tooltip: {
                trigger: 'axis',
                axisPointer: {            // 坐标轴指示器,坐标轴触发有效
                    type: 'shadow'        // 默认为直线,可选为:'line' | 'shadow'
                }
            },
            toolbox: {
                show: true,
                feature: {
                    mark: {show: true},
                    saveAsImage: {show: true},
                }
            },
            calculable: true,
            grid: {
                y2: 90
            },
            xAxis: [
                {
                    type: 'category',
                    data: ['优酷','公共','小程序'],
                    axisLabel: {
                        interval: 0,
                        rotate: 28,//倾斜度
                    },
                    axisTick: {
                        alignWithLabel: true
                    },

                }
            ],
            yAxis: [
                {
                    //单位  name: '单',
                    type: 'value',
                    axisLabel: {formatter: '{value} 单'},
                }
            ],
            series: [
                {
                    name: flow_title,
                    barWidth: 20,//柱状图粗细 宽度 越小越细
                    type: 'bar',
                    data: [2,240,719],
                    label: {
                        normal: {
                            color: '#000',
                            show: true,
                            position: 'top',
                            "formatter": function (a) {
                                return a.value.toLocaleString() + '单'
                            }
                        }
                    }
                }
            ]
        };

        top_shop.setOption(top_shop_option, true);

        $(function () {
            window.onresize = function () {
                top_shop.resize();
            }
        })
        this.resize = function size() {
            var top_shop_div = document.getElementById('top_id');
            width = 1100;
            height = 400;
            top_shop_div.style.width = width + 'px';
            top_shop_div.style.height = height + 'px';
            top_shop.resize(width, height);
        }
    }
效果图

柱状图鼠标滑过显示单位
关键代码
  tooltip: {
                trigger: 'axis',
                axisPointer: {            // 坐标轴指示器,坐标轴触发有效
                    type: 'shadow'        // 默认为直线,可选为:'line' | 'shadow'
                },
                formatter: function (params) {
                    console.log('params', params);
                    return params[0].name + "<br>" + params[0].seriesName + ":" + params[0].value + '单';
                },
            },
鼠标滑过效果图如下:

拓展属性
tooltip : {
trigger: 'axis',
formatter:function(params){
return params[0].name+"<br>"+params[0].seriesName+":"+params[0].data+"<br>"+
params[1].seriesName+":"+params[1].data+"%";
},
textStyle:{
  align:'left'
   },
},
打印params
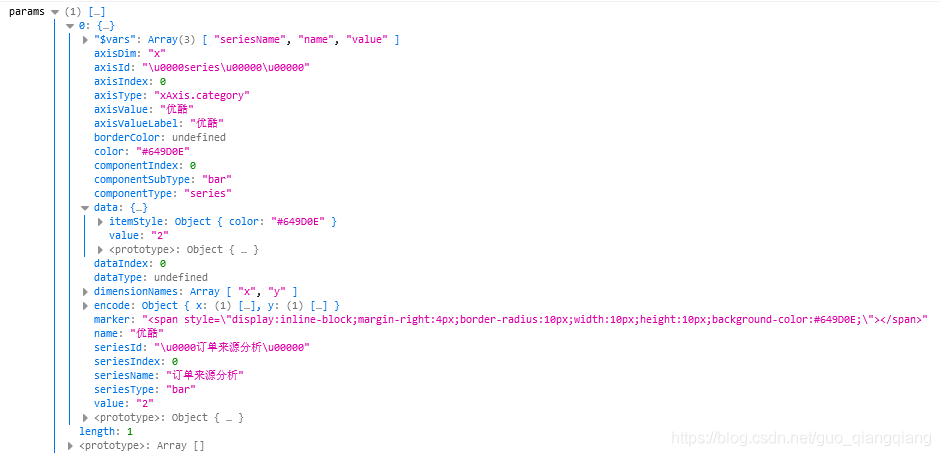
params 对应的变量和值
(1) […]
0: {…}
"$vars": Array(3) [ "seriesName", "name", "value" ]
axisDim: "x"
axisId: "\u0000series\u00000\u00000"
axisIndex: 0
axisType: "xAxis.category"
axisValue: "优酷"
axisValueLabel: "优酷"
borderColor: undefined
color: "#649D0E"
componentIndex: 0
componentSubType: "bar"
componentType: "series"
data: Object { value: "2", itemStyle: {…} }
dataIndex: 0
dataType: undefined
dimensionNames: Array [ "x", "y" ]
encode: Object { x: (1) […], y: (1) […] }
marker: "<span style=\"display:inline-block;margin-right:4px;border-radius:10px;width:10px;height:10px;background-color:#649D0E;\"></span>"
name: "优酷"
seriesId: "\u0000订单来源分析\u00000"
seriesIndex: 0
seriesName: "订单来源分析"
seriesType: "bar"
value: "2"
<prototype>: Object { … }
length: 1
<prototype>: Array []
flow:798:29


 696
696

 被折叠的 条评论
为什么被折叠?
被折叠的 条评论
为什么被折叠?
 到【灌水乐园】发言


