


点击上方“芋道源码”,选择“设为星标”
管她前浪,还是后浪?
能浪的浪,才是好浪!
每天 8:55 更新文章,每天掉亿点点头发...
源码精品专栏
Spring Boot 2..X 版本,可阅读如下文章:
芋道 Spring Boot 监控工具 Admin 入门:http://www.iocoder.cn/Spring-Boot/Admin/
芋道 Spring Boot 监控平台 Prometheus + Grafana 入门:http://www.iocoder.cn/Spring-Boot/Prometheus-and-Grafana/
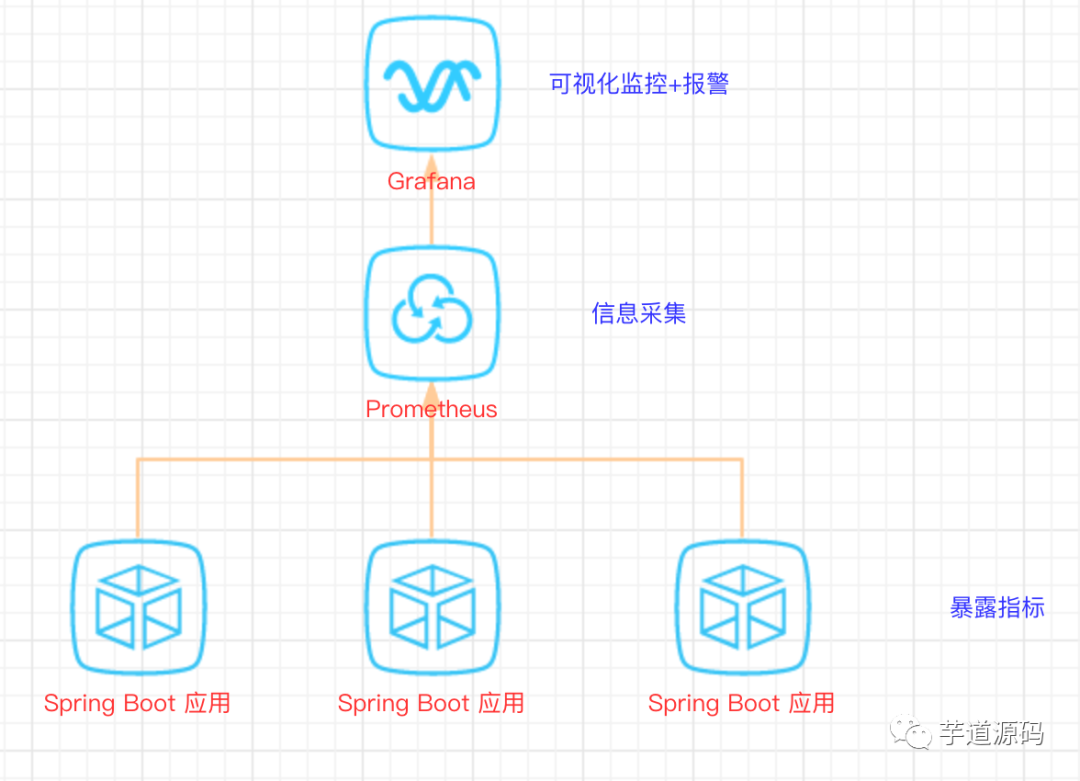
图文简介
快速开始
1、Spring Boot 应用暴露监控指标【版本 1.5.7.RELEASE】
首先,添加依赖如下依赖:
        <dependency>
            <groupId>org.springframework.boot</groupId>
            <artifactId>spring-boot-starter-actuator</artifactId>
        </dependency>

        <dependency>
            <groupId>io.prometheus</groupId>
            <artifactId>simpleclient_spring_boot</artifactId>
            <version>0.0.26</version>
        </dependency>
然后,在启动类 Application.java 添加如下注解:
@SpringBootApplication
@EnablePrometheusEndpoint
@EnableSpringBootMetricsCollector
public class Application {

    public static void main(String[] args) {
        SpringApplication.run(Application.class, args);
    }

}
最后,配置默认的登录账号和密码,在 application.yml 中:
security:
  user:
    name: user
    password: pwd
提示:不建议配置
management.security.enabled: false
启动应用程序后,会看到如下一系列的 Mappings
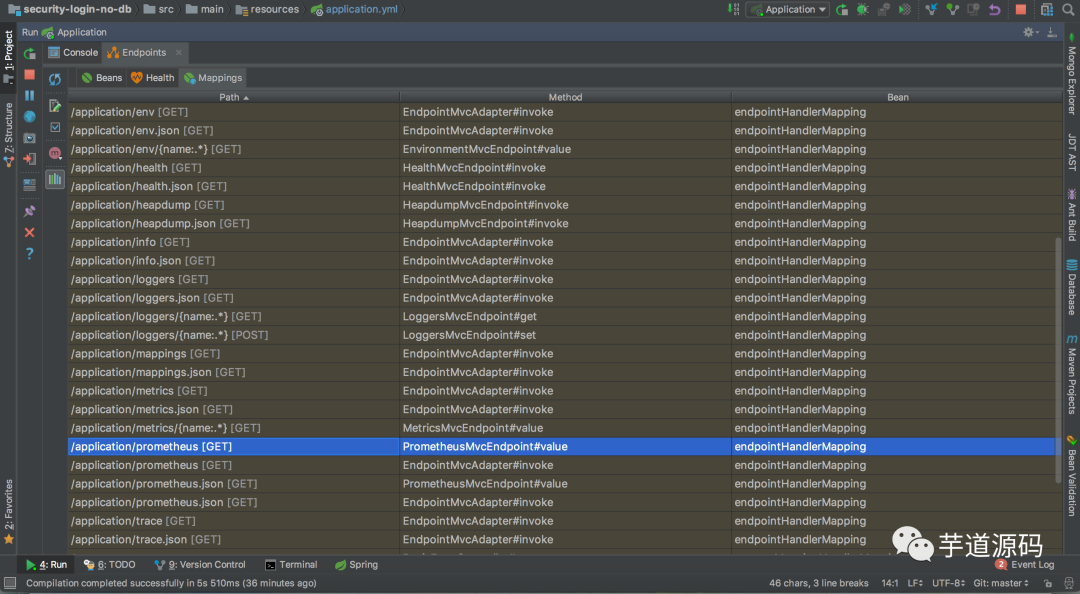
利用账号密码访问 http://localhost:8080/application/prometheus ,可以看到 Prometheus 格式的指标数据
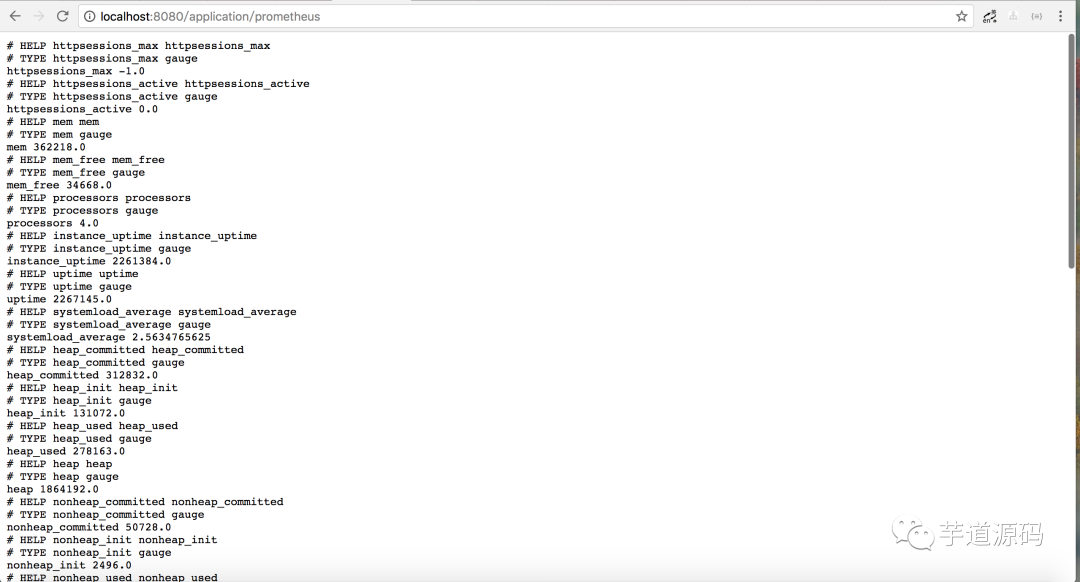
2、Prometheus 采集 Spring Boot 指标数据
首先,获取 Prometheus 的 Docker 镜像:
$ docker pull prom/prometheus
然后,编写配置文件 prometheus.yml :
global:
  scrape_interval: 10s
  scrape_timeout: 10s
  evaluation_interval: 10m
scrape_configs:
  - job_name: spring-boot
    scrape_interval: 5s
    scrape_timeout: 5s
    metrics_path: /application/prometheus
    scheme: http
    basic_auth:
      username: user
      password: pwd
    static_configs:
      - targets:
        - 127.0.0.1:8080  #此处填写 Spring Boot 应用的 IP + 端口号
接着,启动 Prometheus :
$ docker run -d \
--name prometheus \
-p 9090:9090 \
-m 500M \
-v "$(pwd)/prometheus.yml":/prometheus.yml \
-v "$(pwd)/data":/data \
prom/prometheus \
-config.file=/prometheus.yml \
-log.level=info
最后,访问 http://localhost:9090/targets , 检查 Spring Boot 采集状态是否正常。
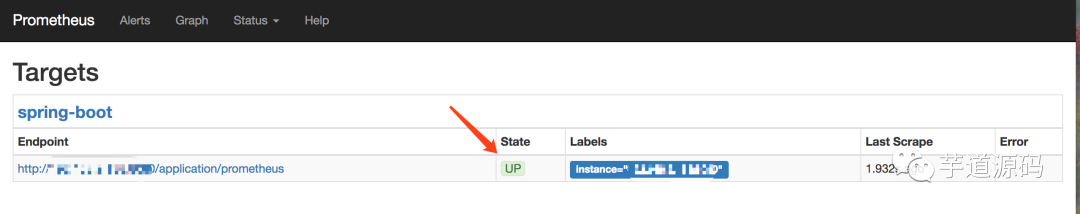
采集状态
3、Grafana 可视化监控数据
首先,获取 Grafana 的 Docker 镜像:
$ docker pull grafana/grafana
然后,启动 Grafana:
$ docker run --name grafana -d -p 3000:3000 grafana/grafana
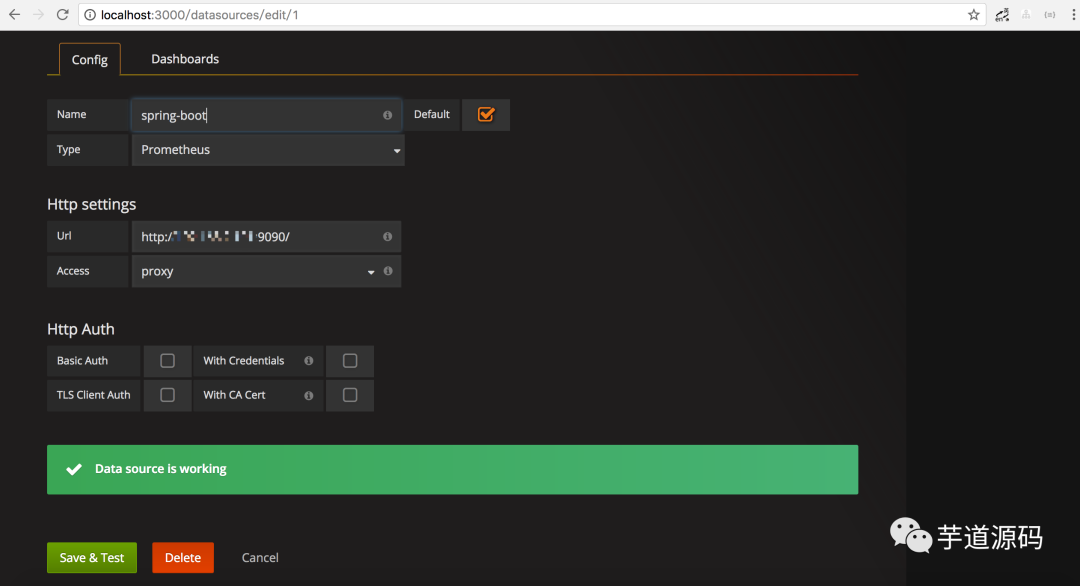
接着,访问 http://localhost:3000/ 配置 Prometheus 数据源:
Grafana 登录账号 admin 密码 admin
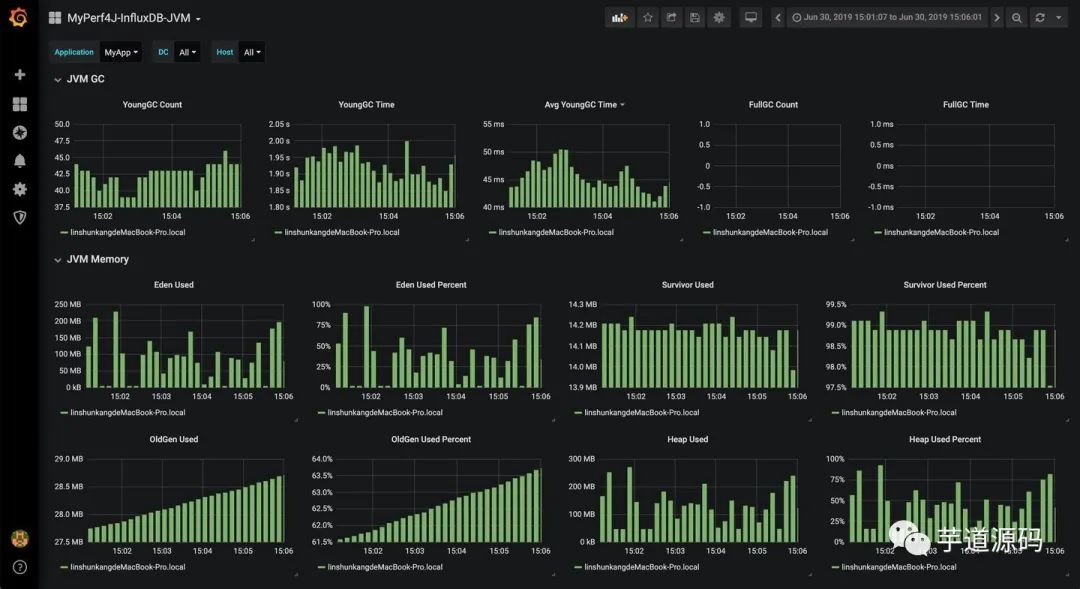
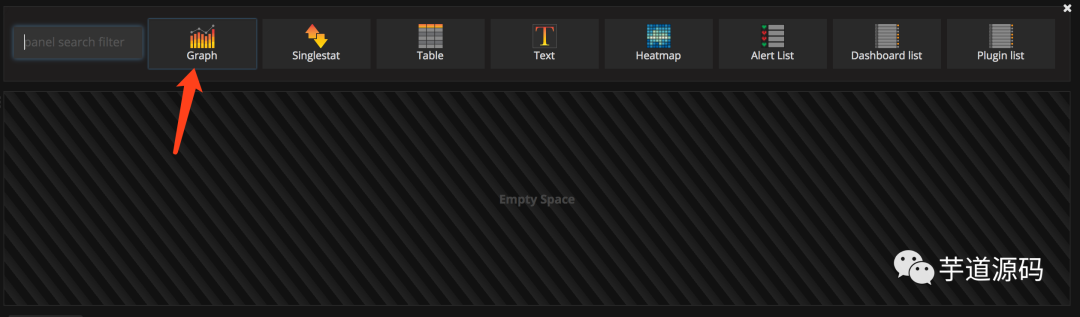
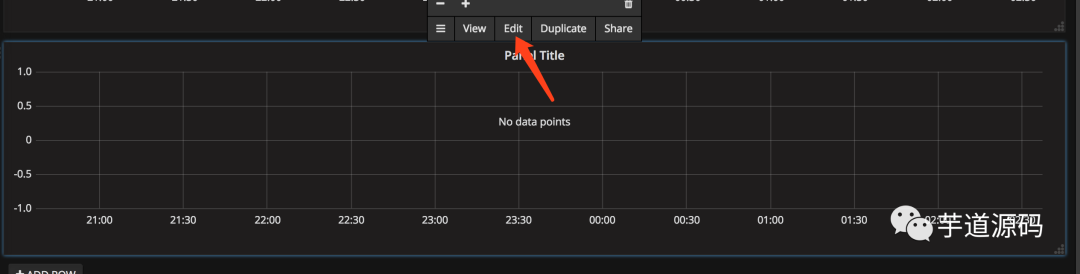
最后,配置单个指标的可视化监控面板:
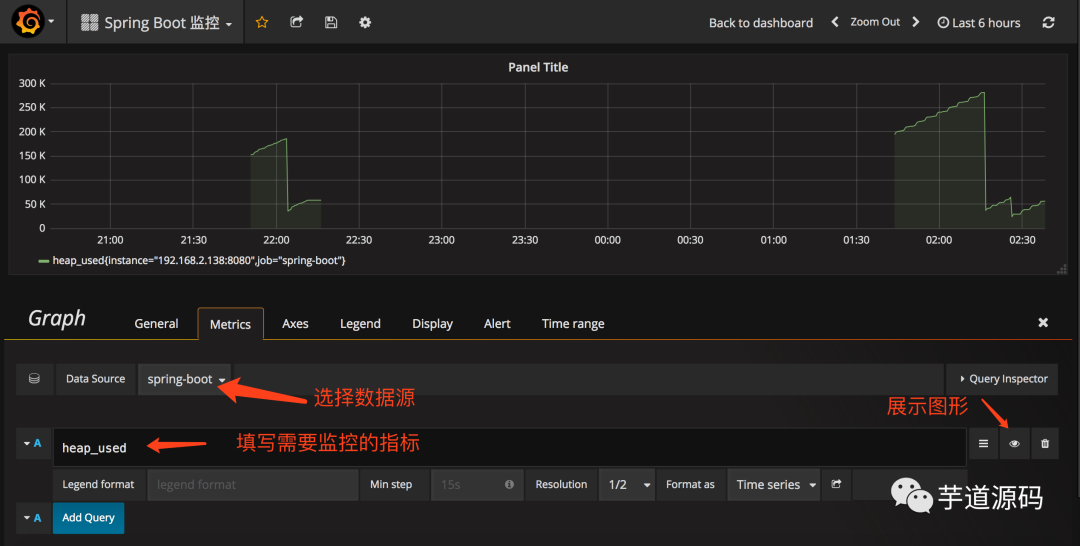
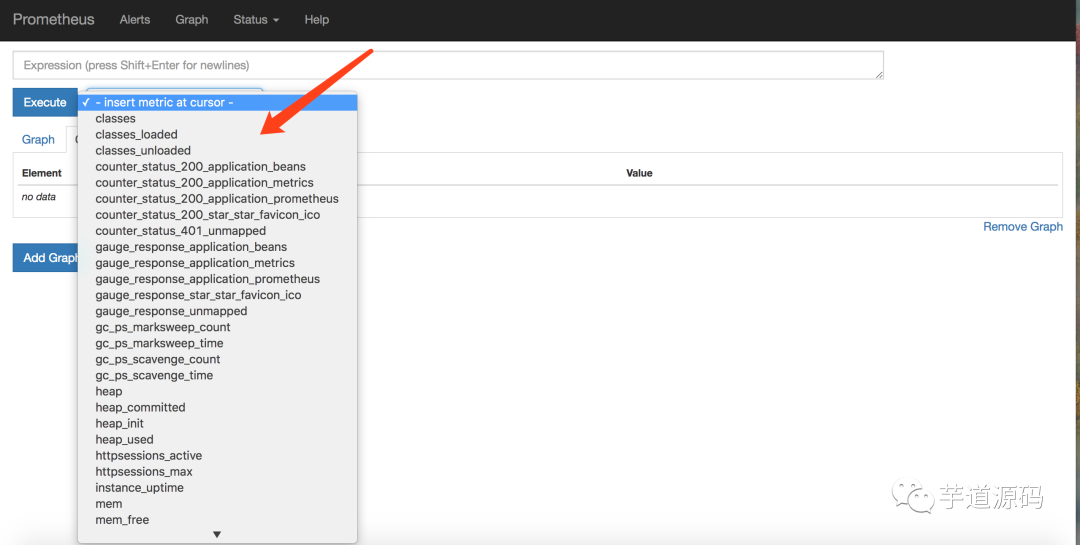
提示,此处不能任意填写,只能填已有的指标点,具体的可以在 Prometheus 的首页看到,即 http://localhost:9090/graph
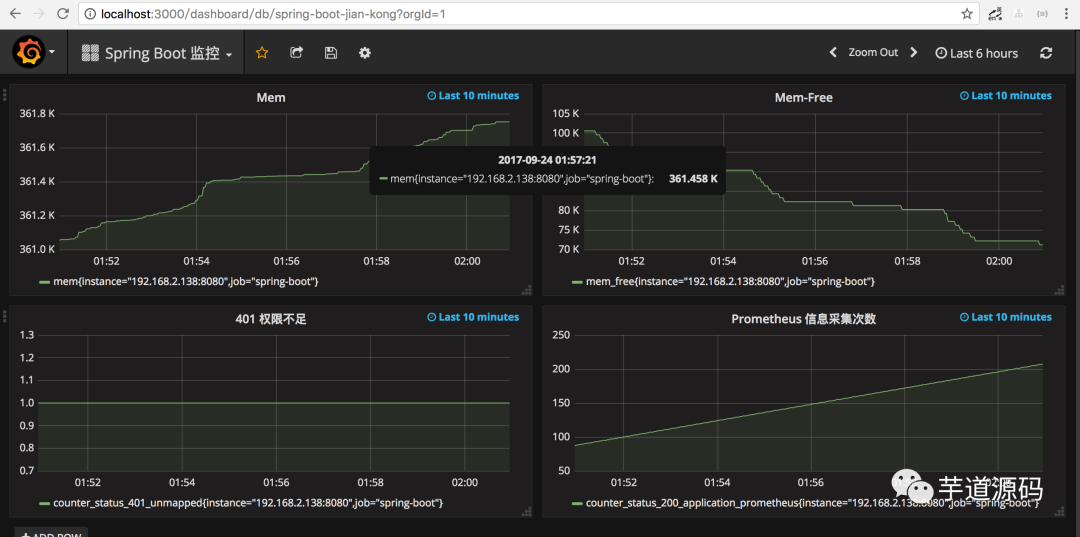
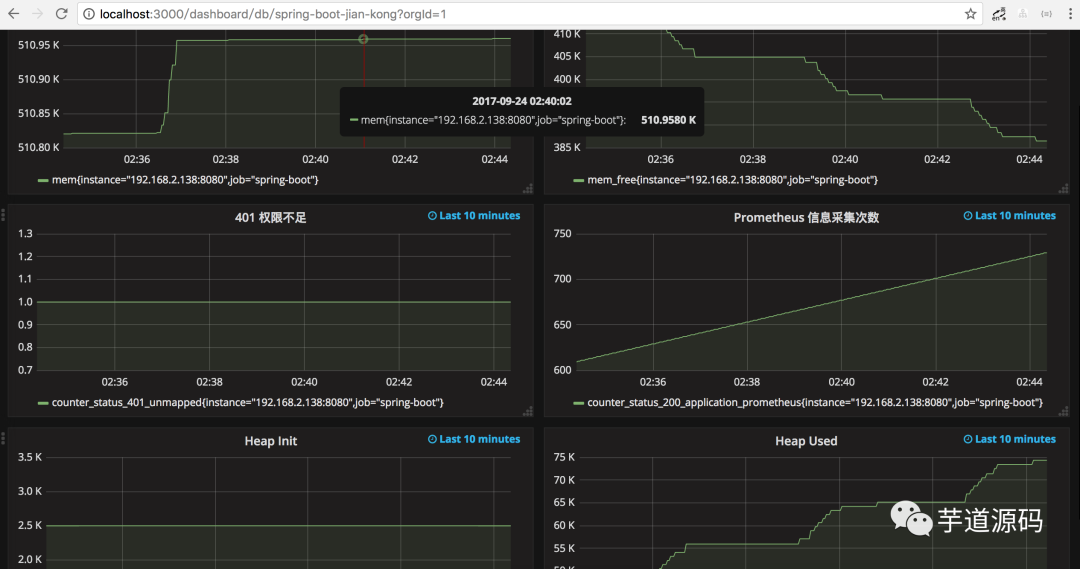
多配置几个指标之后,即可有如下效果:
欢迎加入我的知识星球,一起探讨架构,交流源码。加入方式,长按下方二维码噢:

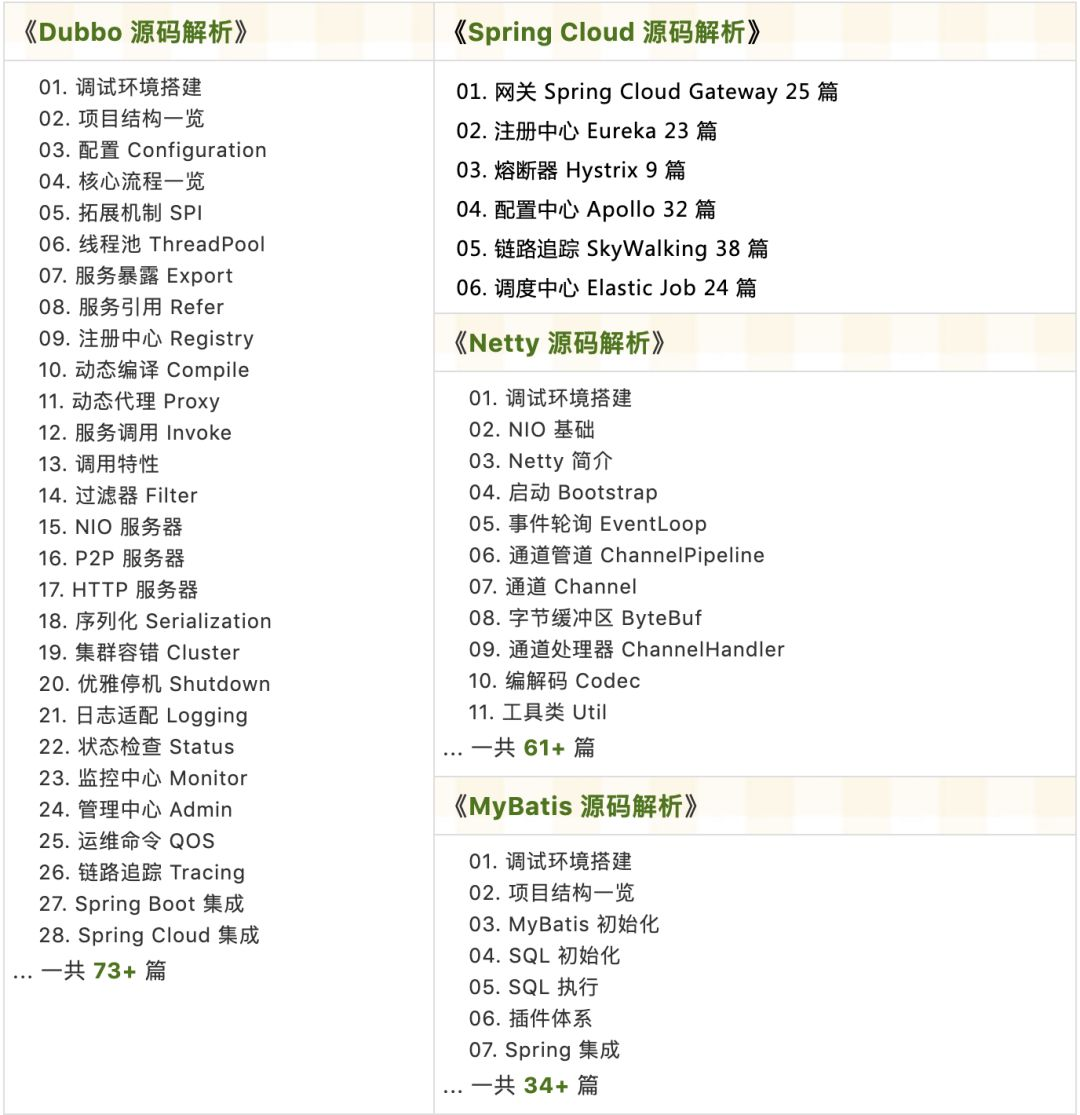
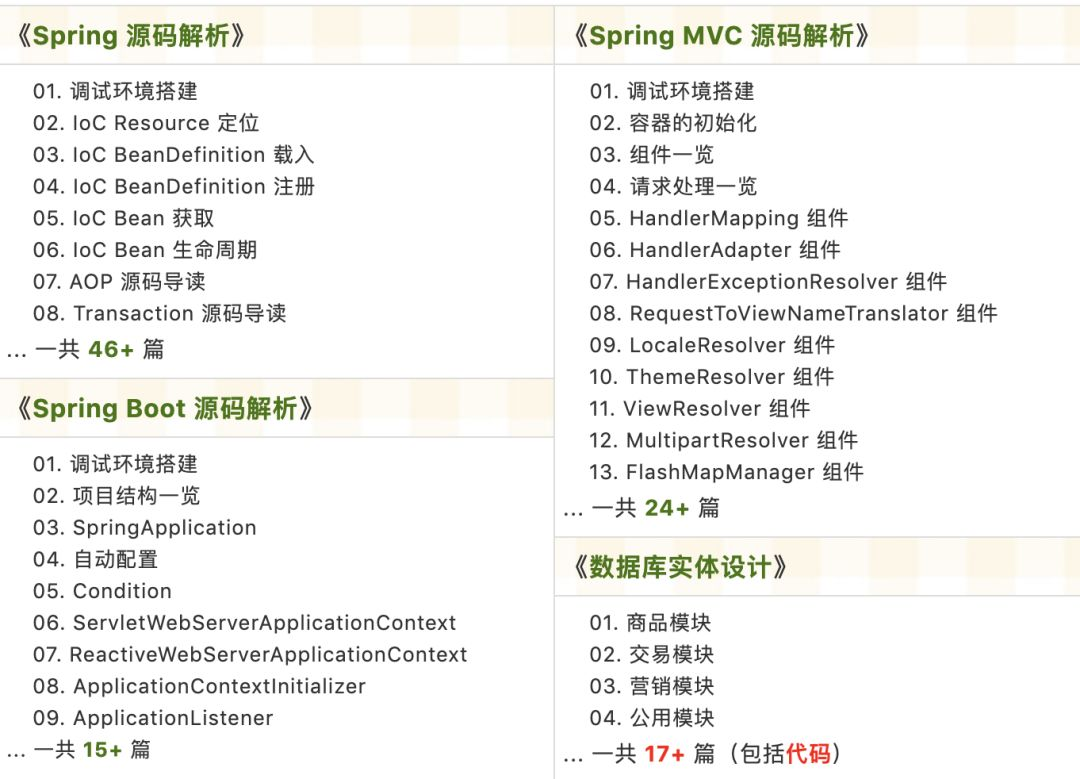
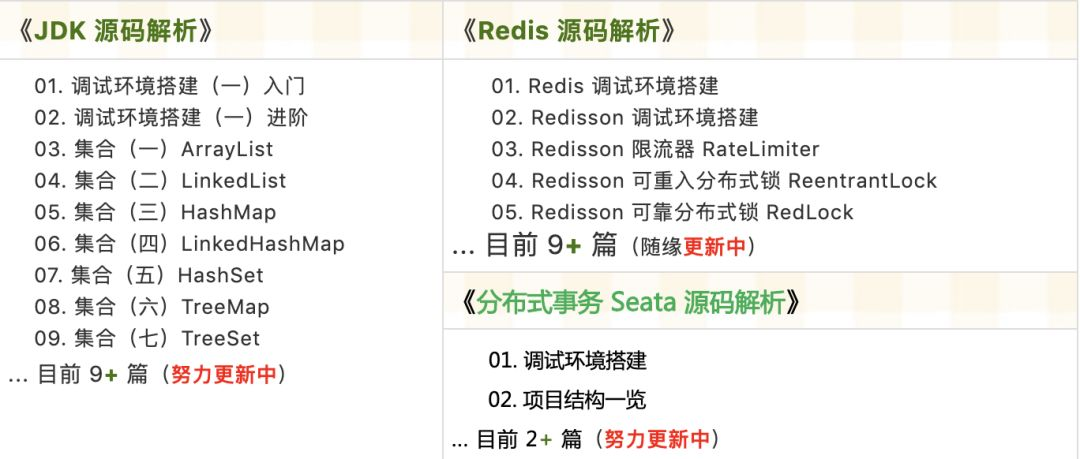
已在知识星球更新源码解析如下:
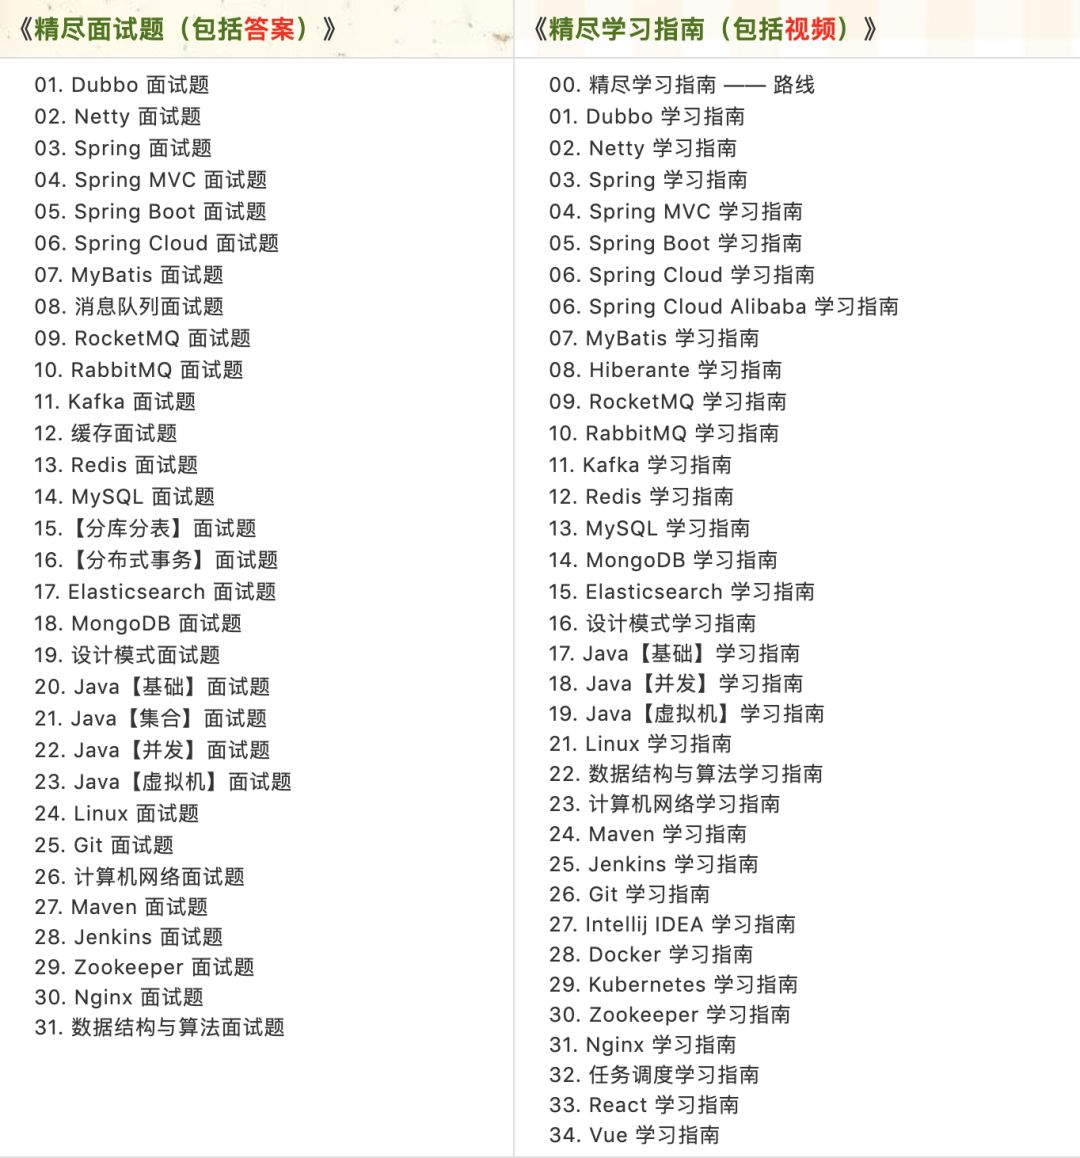
最近更新《芋道 SpringBoot 2.X 入门》系列,已经 20 余篇,覆盖了 MyBatis、Redis、MongoDB、ES、分库分表、读写分离、SpringMVC、Webflux、权限、WebSocket、Dubbo、RabbitMQ、RocketMQ、Kafka、性能测试等等内容。
提供近 3W 行代码的 SpringBoot 示例,以及超 4W 行代码的电商微服务项目。
获取方式:点“在看”,关注公众号并回复 666 领取,更多内容陆续奉上。
文章有帮助的话,在看,转发吧。
谢谢支持哟 (*^__^*)


 339
339

 被折叠的 条评论
为什么被折叠?
被折叠的 条评论
为什么被折叠?
 到【灌水乐园】发言


