


 本文介绍使用Elasticsearch、Logstash、Kibana和Filebeat进行日志收集、处理和可视化的步骤。涵盖各组件的功能,如Elasticsearch的搜索和数据分析,Logstash的数据采集与转换,Kibana的可视化展示,以及Filebeat的日志轻量级采集。
一、简介
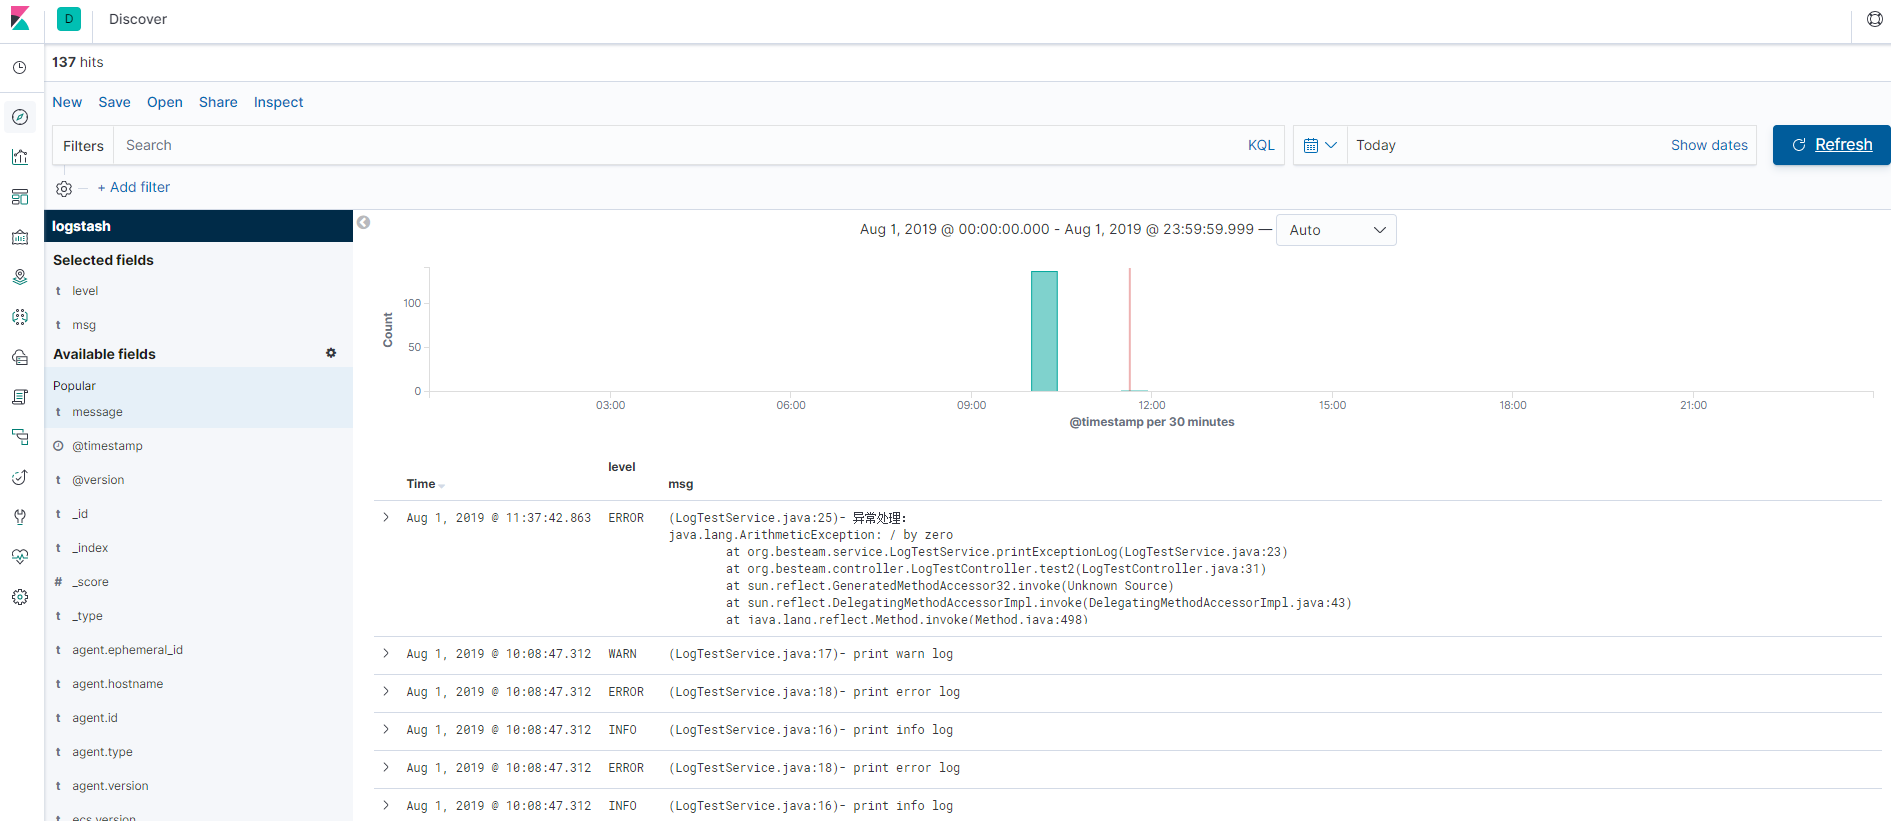
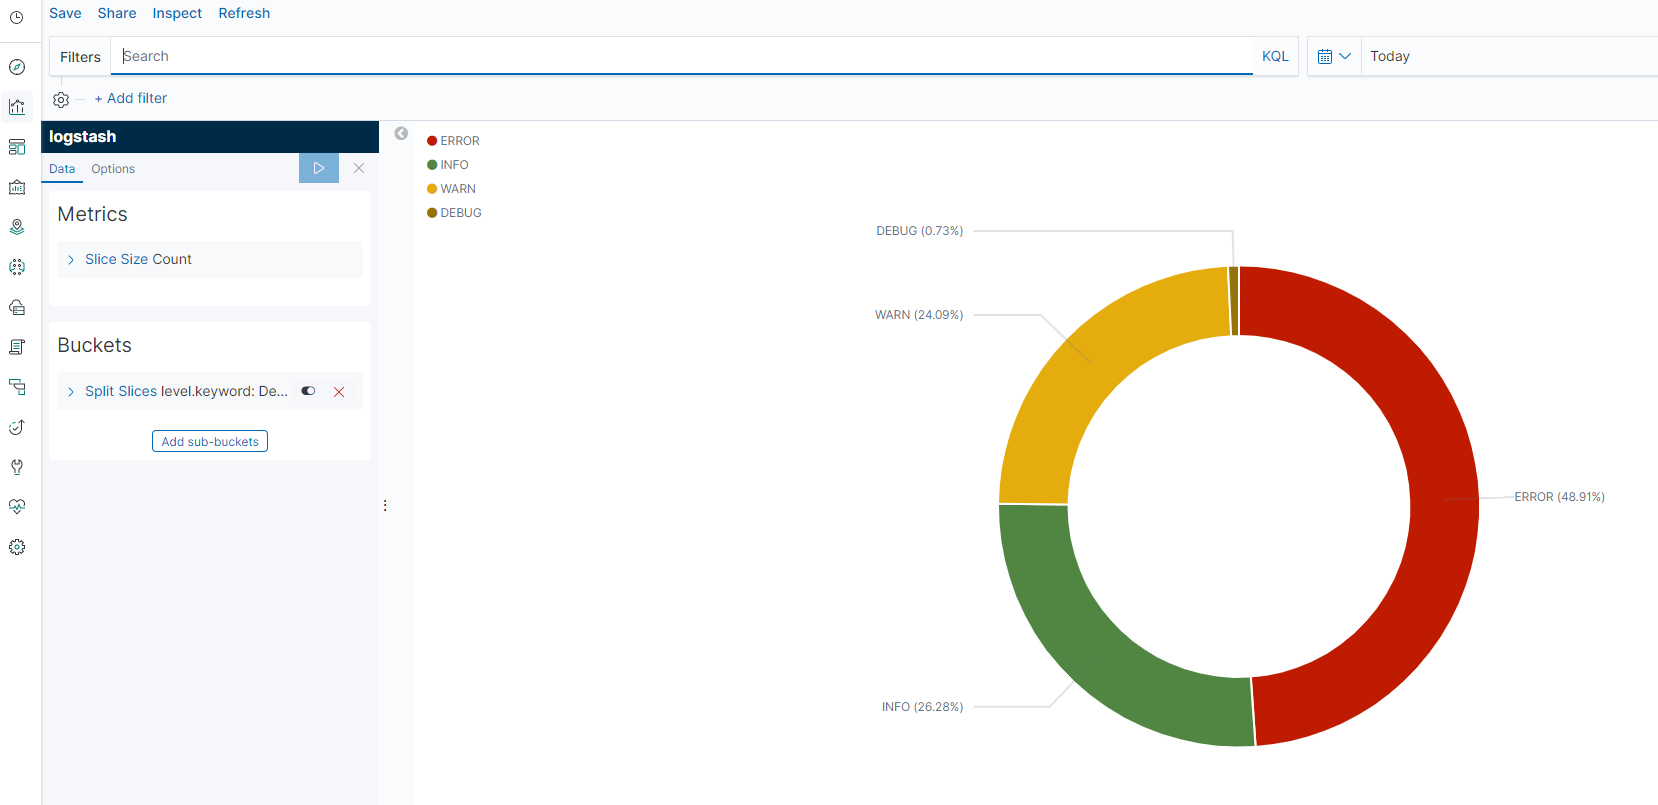
项目使用了Elastic Stack中的Elasticsearch、Logstash、Kibana、Filebeat来完成项目日志分析。效果图如下:
1.Elasticsearch
Elasticsearch 是一个分布式、RESTful 风格的搜索和数据分析引擎。它可以对数据进行存储,并且快速的搜索到结果
2.Logstash
Logstash 是开源的服务器端数据处理管道,它能够同时从多个来源采集数据,转换数据,然后将数据发送到Elasticsearch上
3.Kibana
对Elasticsearch中的数据进行可视化,并且可以生成各种canvas图
4.Filebeat
属于Beat家族中的一员,它是一款轻量级的日志采集器,用于将采集到的数据过滤处理并发送给logstash.
二、安装及配置
2.1 安装
windows、linux都是开箱即用放到一个目录即可
2.2配置
基本配置如下:
Filebeat,在filebeat.yml中配置输入源和目标源
参考文档:
https://www.elastic.co/guide/en/beats/filebeat/7.0/configuration-filebeat-options.html
https://www.elastic.co/guide/en/beats/filebeat/7.0/multiline-examples.html
filebeat.inputs:
- type: log
  enabled: true
  paths:
    #- /var/log/*.log
    - D:\file\mylog\*.log
  multiline: # 多行处理,正则匹配
    pattern: '^\d{4}' # 开头为4个数字
    negate: true # true开启正则。默认false
    match: after # 不匹配放在上一行后面
# 目标源logstash
output.logstash:
  # logstash主机,可配置多个
  hosts: ["localhost:5043"]
Logstash,在bin目录中创建logstash.conf文件,配置输入输出
参考文档:
https://www.elastic.co/guide/en/logstash/7.0/advanced-pipeline.html
https://blog.51cto.com/liqingbiao/1928653
input {
  beats {
    host => "localhost"
    port => "5043" # filebeat输出端口
  }
}
#filter过滤
filter {
    grok {
			match => { "message" => "%{TIMESTAMP_ISO8601:timestamp} %{LOGLEVEL:level} %{JAVALOGMESSAGE:msg}" }
		}
}
output {
  elasticsearch {
        hosts => [ "localhost:9200" ]
    }
}
2.3启动
windows启动
Elasticsearch、Kibana直接bat启动

logstash(bin目录中启动)
logstash -f logstash.conf

filebeat
filebeat -e -c filebeat.yml
linux启动
Elasticsearch
./bin/elasticsearch

Kibana
./bin/kibana

logstash
# 检测配置文件是否报错
bin/logstash -f first-pipeline.conf --config.test_and_exit
# 没有报错后启动logstash --config.reload.automat修改配置是不需重启自动加载
bin/logstash -f first-pipeline.conf --config.reload.automatic

filebeat
./filebeat -e -c filebeat.yml -d "publish"
打开kibana创建index patterns就可以看到日志了


 2195
2195

 被折叠的 条评论
为什么被折叠?
被折叠的 条评论
为什么被折叠?
 到【灌水乐园】发言


