


Prometheus
什么是Prometheus?
prometheus是一款时序(time series)数据库;但它的功能不仅仅只有TSDB,而是一款设计用于进行目标监控的关键组件。
prometheus结合其他组件,如Pushgateway、Altermanager和Grafana可构成一个完整的IT监控系统
时序数据:像服务器指标数据、应用程序性能监控数据,网络数据等这些能够随着时间不断有数据出现的都叫做时序数据。
Prometheus的工作过程
prometheus通过HTTP的pull方式,从配置文件中指定组件(网络端点,有ip有端口)上周期性采集指标数据并存储到本地的TSDB中。
TSDB有自带的查询语言promql,可以查询监控数据
报警方式是通过promql写规则,与你设置的阈值进行匹配,超过阈值报警,这个组件也是独立的叫做
alertmanager
pushgateway组件 用来采取一些很难采集短周期等任务,然后再被prometheus采取数据。
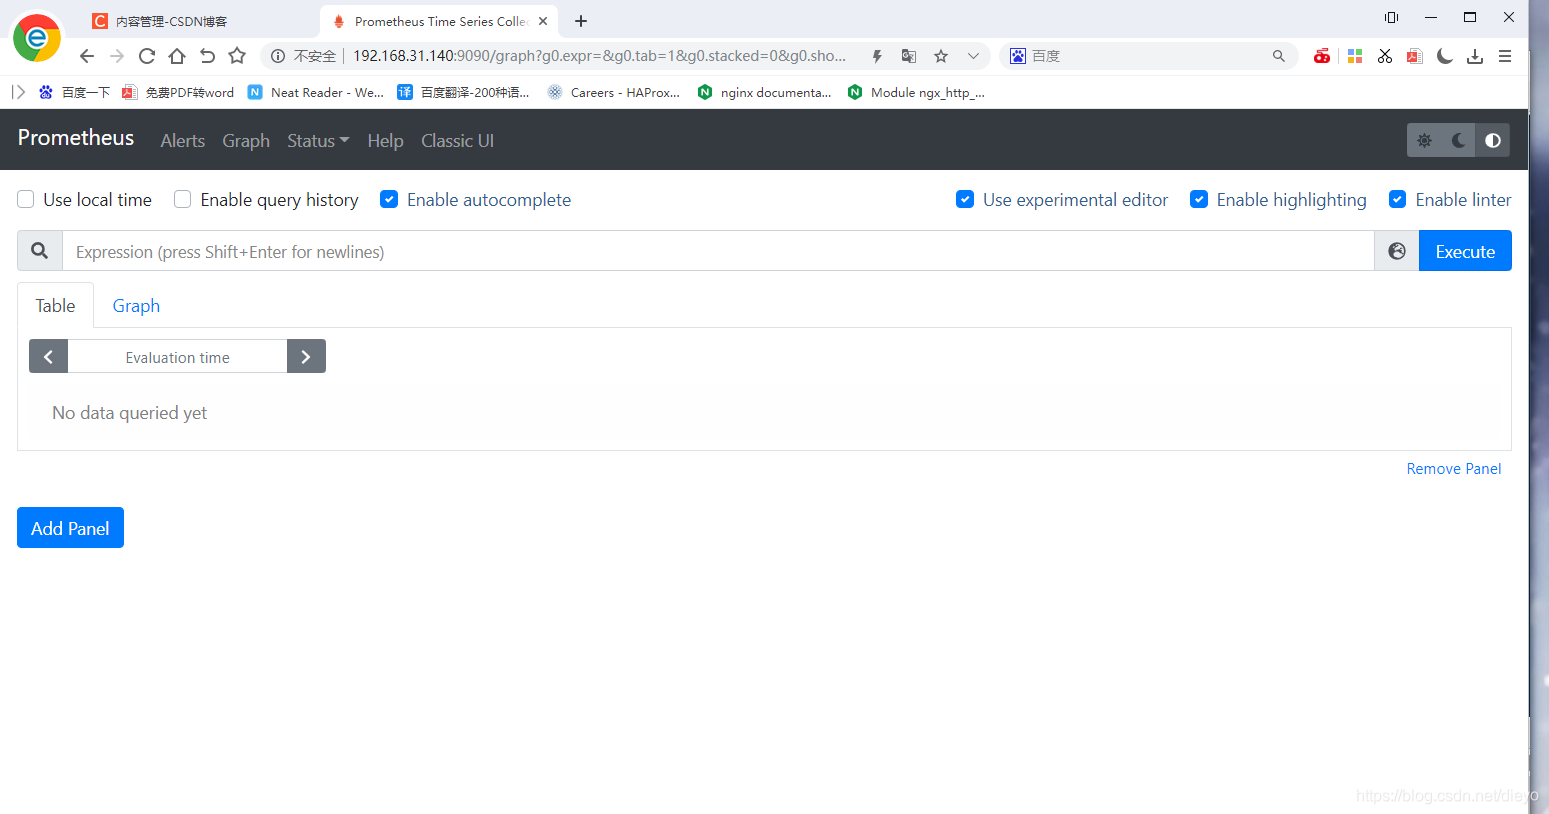
Server同时提供了简单的ui也就是表达式浏览器,可以查看配置查询数据,界面很丑,而且本身没有保存数据便我们查询的功能,所以通常使用grafana来展示界面。
pull和push的工作模型:pull就是挨个去目标上抓取数据,push就是目标自己来把数据交给我。
总结:
prometheus通过httpd的pull方式采集监控数据,一些很难采取的短时间存活的数据就通过pushgateway来采集然后再被prometheus拉取,并且存储到本地的TSDB中,接着在用alertmanager组件,用promql来写规则,与阈值进行匹配,超过了阈值就报警。
Prometheus特点
提供多维度数据模型,使用指标名称和键值对标识的时间序列数据
提供灵活的PromQL查询方式,还提供了HTTP查询接口,可以很方便地结合Grafana等组件展示数据。
不依赖外部存储,支持单节点的本地存储。通过Prometheus自带的时序数据库,可以完成每秒百万及的数据存储,如果需要存储大量历史数据,还可以对接第三方的时序数据库。
时间序列收集通过HTTP的拉取方式进行,并提供了开放的指标数据标准。
支持向中间网关推送时序数据,可以更加灵活地适用于多种监控场景。
支持通过动态服务发现和静态文件配置获取监控对象,目前已支持Kubernetes、Etcd、Consul等多种服务发现机制。
支持多种模式的图形展示和仪表盘。
大多数Prometheus的组件都是使用Go语言编写的,这使得它们很容易以二进制文件的形式构建和部署。
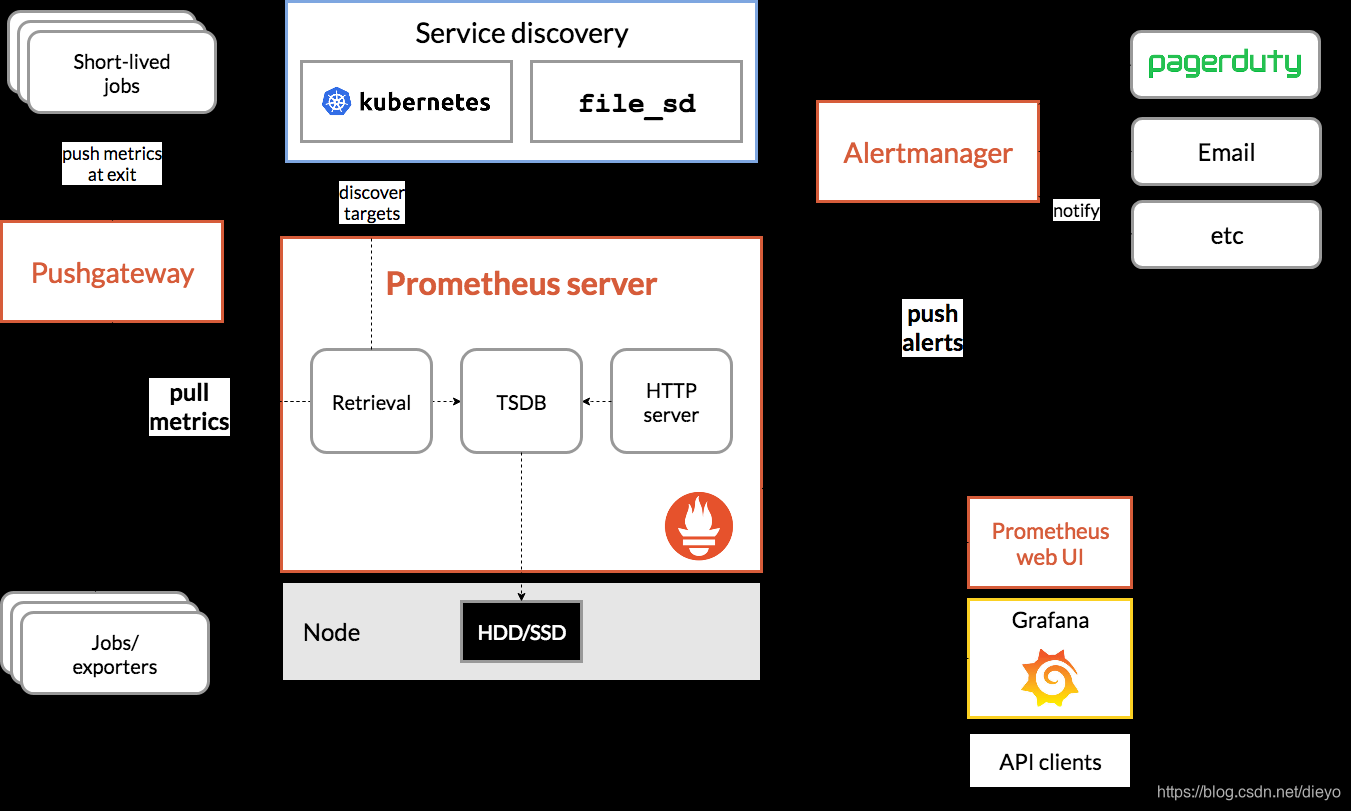
Prometheus架构
Prometheus生态圈由多个组件构成,其中许多组件是可选的:
Prometheus Server:用于收集、存储和查询时间序列数据。通过静态配置文件管理监控目标,也可以配合使用动态服务发现的方式动态管理监控目标,并从这些监控目标中获取数据。它将采集到的数据按照时间序列的方式存储在本地磁盘当中或者外部的时序数据库中,可通过PromQL语言对数据的查询以及分析。
Client Library:为被监控的应用生成相应的指标(Metric)数据并暴露给Prometheus Server。当Prometheus Server 来拉取时,直接返回实时状态的指标数据。
Push Gateway:主要用于短期存在的Jobs。由于这类Jobs存在时间较短,可能在Prometheus Server来拉取数据之前就消失了。所以,Jobs可以直接向Push Gateway推送它们的指标数据,然后Prometheus Server再从Push Gateway拉取。
Exporters:用于暴露已有的第三方服务的指标数据通过HTTP服务的形式暴露给Prometheus Server,比如HAProxy、StatsD、Graphite等等。Prometheus Server通过访问该Exporter提供的Endpoint,即可获取到需要采集的监控数据。
Alertmanager:从Prometheus Server接收到告警后,会进行去除重复数据,分组,并路由到对收的接受方式,发出报警。Alertmanager的告警方式非常灵活,支持通过邮件、slack或钉钉等多种途径发出告警。
一些其他的组件。
下面这张图展示了Prometheus的架构和各个组件是如何交互和协作的:
prometheus配置文件
prometheus的配置文件prometheus.yml,它主要分以下几个配置块:
| 配置块 | 作用 |
|---|---|
| global | 此片段指定的是prometheus的全局配置, 比如采集间隔,抓取超时时间等。 |
| rule_files | 此片段指定报警规则文件, prometheus根据这些规则信息,会推送报警信息到alertmanager中。 |
| scrape_configs | 此片段指定抓取配置,prometheus的数据采集通过此片段配置。 |
| alerting | 此片段指定报警配置, 这里主要是指定prometheus将报警规则推送到指定的alertmanager实例地址。 |
| remote_write | 指定后端的存储的写入api地址。(远程写) |
| remote_read | 指定后端的存储的读取api地址。(远程读) |
Prometheus部署+监控nginx
关闭防火墙
[root@czh ~]# systemctl stop firewalld
[root@czh ~]# setenforce 0
下载并且安装prometheus
[root@czh ~]# ls
anaconda-ks.cfg  prometheus-2.28.0.linux-amd64.tar.gz
[root@czh ~]# tar xf prometheus-2.28.0.linux-amd64.tar.gz
[root@czh ~]# mv prometheus-2.28.0.linux-amd64 /usr/local/prometheus
[root@czh ~]# useradd -r -M -s /sbin/nologin prometheus
[root@czh ~]# mkdir -p /opt/data/prometheus
[root@czh ~]# chown -R prometheus.prometheus /usr/local/prometheus /opt/data/prometheus
[root@czh ~]# ll /usr/local/
总用量 0
drwxr-xr-x. 2 root       root         6 5月  18 2020 bin
drwxr-xr-x. 2 root       root         6 5月  18 2020 etc
drwxr-xr-x. 2 root       root         6 5月  18 2020 games
drwxr-xr-x. 2 root       root         6 5月  18 2020 include
drwxr-xr-x. 2 root       root         6 5月  18 2020 lib
drwxr-xr-x. 3 root       root        17 5月  20 03:15 lib64
drwxr-xr-x. 2 root       root         6 5月  18 2020 libexec
drwxr-xr-x. 4 prometheus prometheus 132 6月  21 12:01 prometheus
drwxr-xr-x. 2 root       root         6 5月  18 2020 sbin
drwxr-xr-x. 5 root       root        49 5月  20 03:15 share
drwxr-xr-x. 2 root       root         6 5月  18 2020 src
[root@czh ~]# ll /opt/data
总用量 0
drwxr-xr-x. 2 prometheus prometheus 6 6月  30 22:17 prometheus
配置service的文件
[root@czh ~]# vim /usr/lib/systemd/system/prometheus.service
[root@czh ~]# cat /usr/lib/systemd/system/prometheus.service
[Unit]
Description=Prometheus
After=network.target

[Service]
Type=simple
Environment="GOMAXPROCS=4"
User=prometheus
Group=prometheus
ExecReload=/bin/kill -HUP $MAINPID
ExecStart=/usr/local/prometheus/prometheus \
  --config.file=/usr/local/prometheus/prometheus.yml \
  --storage.tsdb.path=/opt/data/prometheus \
  --storage.tsdb.retention=30d \
  --web.console.libraries=/usr/local/prometheus/console_libraries \
  --web.console.templates=/usr/local/prometheus/consoles \
  --web.listen-address=0.0.0.0:9090 \
  --web.read-timeout=5m \
  --web.max-connections=10 \
  --query.max-concurrency=20 \
  --query.timeout=2m \
  --web.enable-lifecycle
PrivateTmp=true
PrivateDevices=true
ProtectHome=true
NoNewPrivileges=true
LimitNOFILE=infinity
ReadWriteDirectories=/opt/data/prometheus
ProtectSystem=full

SyslogIdentifier=prometheus
Restart=always

[Install]
WantedBy=multi-user.target
启动prometheus
[root@czh ~]# systemctl daemon-reload
[root@czh ~]# systemctl enable prometheus && systemctl start prometheus
Created symlink /etc/systemd/system/multi-user.target.wants/prometheus.service → /usr/lib/systemd/system/prometheus.service.
[root@czh ~]# ss -antl
State   Recv-Q  Send-Q   Local Address:Port   Peer Address:Port Process
LISTEN  0       128            0.0.0.0:22          0.0.0.0:*
LISTEN  0       128               [::]:22             [::]:*
LISTEN  0       128                  *:9090              *:*
AlertManager部署
下载AlertManager
[root@czh ~]#wget https:https://github.com/prometheus/alertmanager/releases/
download/v0.22.2/alertmanager-0.22.2.linux-64.tar.gz
安装AlertManager
[root@czh ~]# mv alertmanager-0.22.2.linux-amd64.tar.gz /usr/local/alertmanager
[root@czh ~]# chown -R prometheus.prometheus /usr/local/alertmanager
编写service文件
[root@czh ~]# vim /usr/lib/systemd/system/alertmanager.service
[root@czh ~]# cat /usr/lib/systemd/system/alertmanager.service
[Unit]
Description=Alertmanager
After=network.target

[Service]
Type=simple
User=prometheus
Group=prometheus
ExecStart=/usr/local/alertmanager/alertmanager \
  --config.file=/usr/local/alertmanager/alertmanager.yml \
  --storage.path=/usr/local/alertmanager/data \
  --web.listen-address=0.0.0.0:9093 \
  --cluster.listen-address=0.0.0.0:9094 \
  --log.level=info \
  --log.format=logfmt
Restart=always

[Install]
WantedBy=multi-user.target
启动AlertManager
root@czh ~]# systemctl daemon-reload
[root@czh ~]# systemctl enable alertmanager && systemctl start alertmanager
[root@czh ~]# ss -antl
State   Recv-Q  Send-Q   Local Address:Port   Peer Address:Port Process
LISTEN  0       128            0.0.0.0:22          0.0.0.0:*
LISTEN  0       128               [::]:22             [::]:*
LISTEN  0       128                  *:9090              *:*
LISTEN  0       128                  *:9093              *:*
LISTEN  0       128                  *:9094              *:*
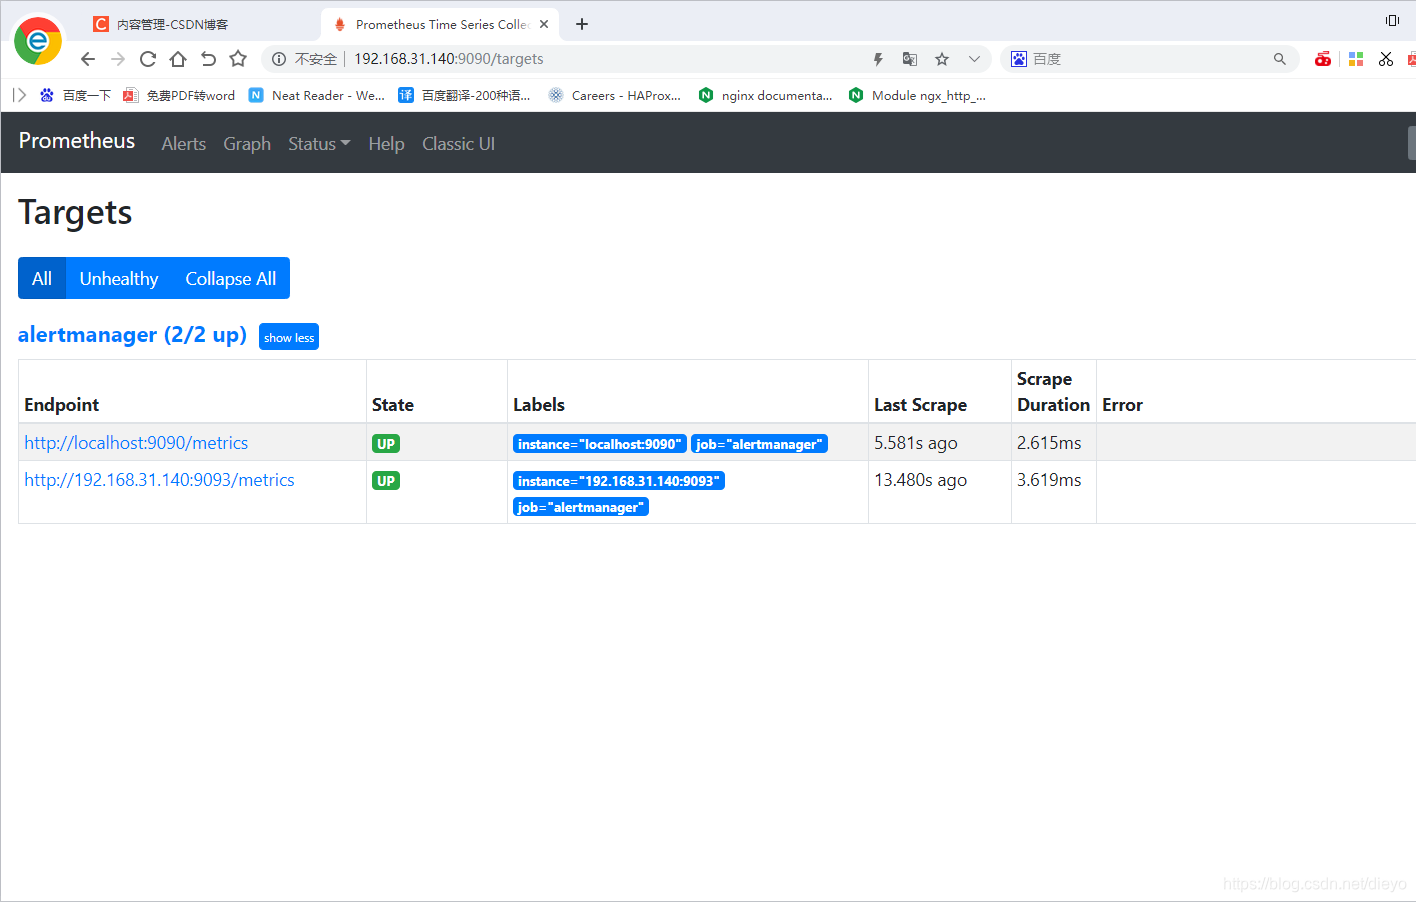
配置prometheus
    [root@prometheus ~]# vim /usr/local/prometheus/prometheus.yml
      - job_name: 'alertmanager'
        static_configs:
        - targets: ['192.168.31.140:9093']
    [root@prometheus ~]# systemctl restart prometheus
部署Node Exporter
node exporter 作用: 是收集操作系统的基本系统, 例如cpu, 内存, 硬盘空间等基本信息, 并对外提供api接口用于prometheus查询存储;
下载Node Exporter
[root@czh ~]# wget https://github.com/prometheus/node_exporter/releases/download/v1.1.2/node_exporter-1.1.2.linux-amd64.tar.gz
[root@czh ~]# tar xf node_exporter-1.1.2.linux-amd64.tar_2.gz
安装Node Exporter
[root@czh ~]# mv node_exporter-1.1.2.linux-amd64 /usr/local/node_exporter
[root@czh ~]# chown -R prometheus.prometheus /usr/local/node_exporter
编写service文件
[root@czh ~]# vim /usr/lib/systemd/system/node_exporter.service
[root@czh ~]# cat /usr/lib/systemd/system/node_exporter.service
[Unit]
Description=node_exporter
After=network.target

[Service]
Type=simple
User=prometheus
Group=prometheus
ExecStart=/usr/local/node_exporter/node_exporter \
  --web.listen-address=0.0.0.0:9100 \
  --web.telemetry-path=/metrics \
  --log.level=info \
  --log.format=logfmt
Restart=always

[Install]
WantedBy=multi-user.target
启动Node Exporter
[root@czh ~]# systemctl daemon-reload
[root@czh ~]# systemctl enable node_exporter && systemctl start node_exporter
Created symlink /etc/systemd/system/multi-user.target.wants/node_exporter.service → /usr/lib/systemd/system/node_exporter.service.
[root@czh ~]# ss -antl
State   Recv-Q  Send-Q   Local Address:Port   Peer Address:Port Process
LISTEN  0       128            0.0.0.0:22          0.0.0.0:*
LISTEN  0       128               [::]:22             [::]:*
LISTEN  0       128                  *:9090              *:*
LISTEN  0       128                  *:9093              *:*
LISTEN  0       128                  *:9094              *:*
LISTEN  0       128                  *:9100              *:*
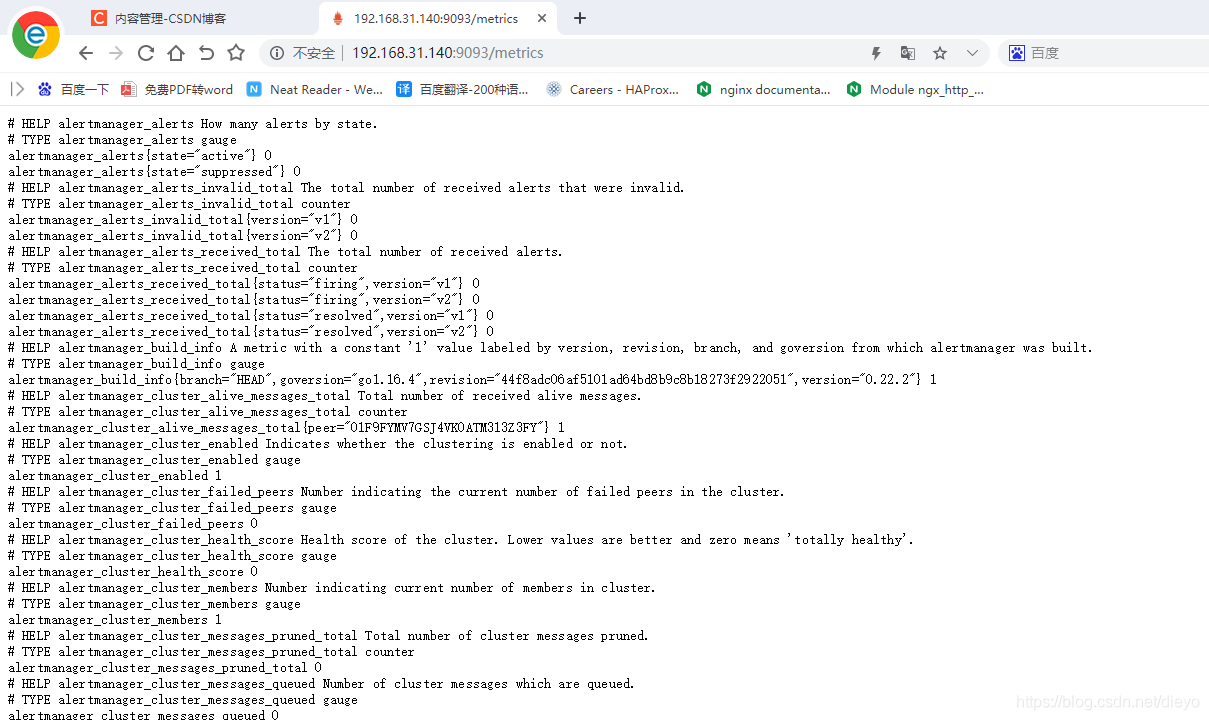
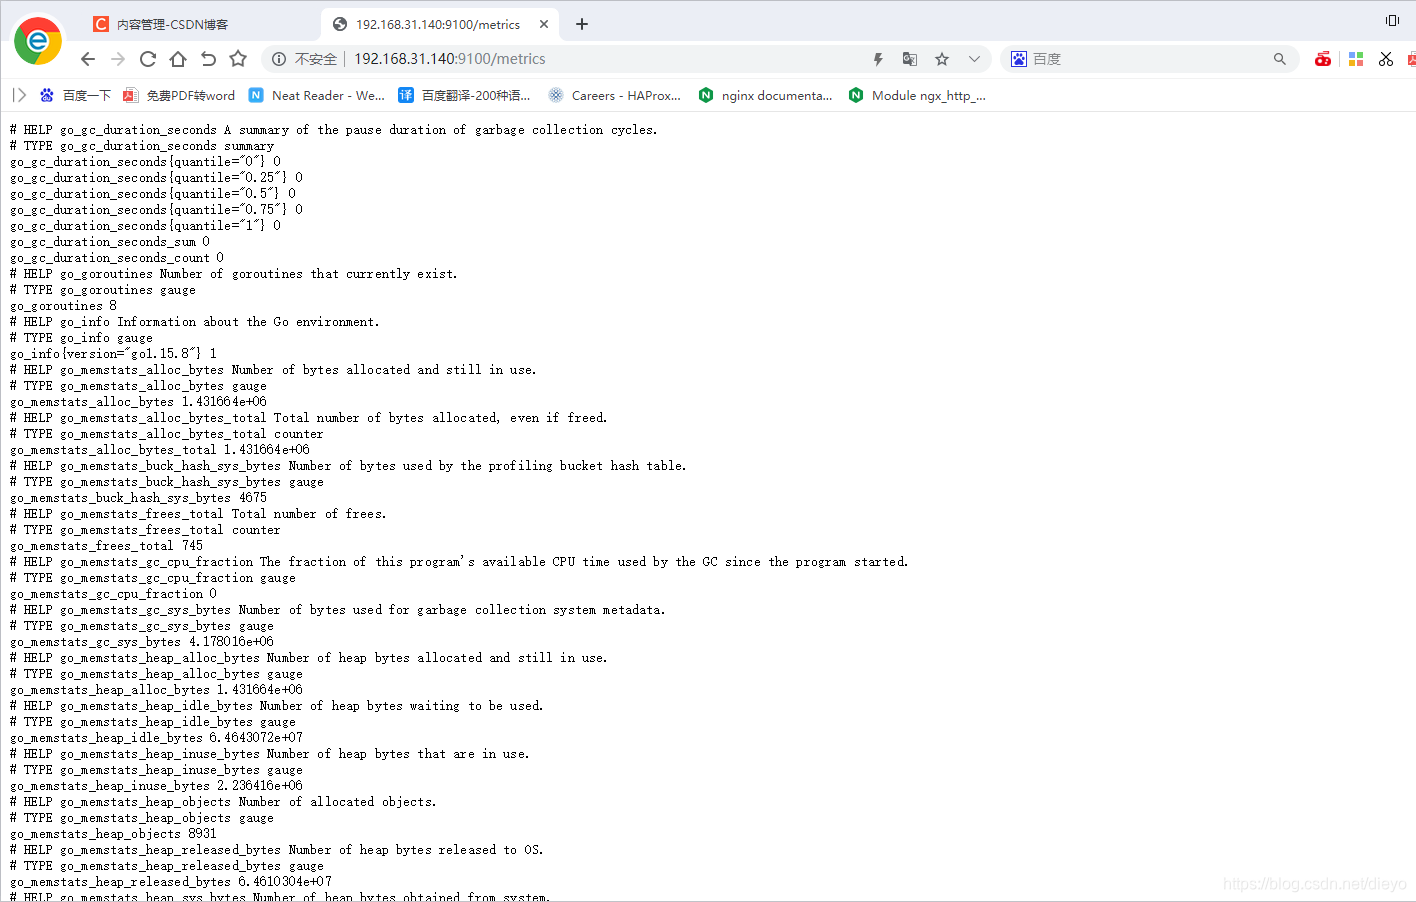
node exporter展示了prometheus可以拉取的指标,包括在输出中更下方的各种系统指标(带有前缀node_)。要查看这些指标(以及帮助和类型信息):
配置prometheus
[root@czh ~]# vim /usr/local/prometheus/prometheus.yml
- job_name: 'prometheus'

    # metrics_path defaults to '/metrics'
    # scheme defaults to 'http'.
    static_configs:
    - targets: ['localhost:9090']
  - job_name: 'alertmanager'
    static_configs:
    - targets: ['192.168.31.140:9093']
  - job_name: 'node'
    static_configs:
    - targets: ['192.168.31.140:9100']

[root@czh ~]# systemctl restart prometheus

grafana部署
[root@czh ~]# wget https://dl.grafana.com/oss/release/grafana-7.5.6-1.x86_64.rpm
[root@czh ~]# vim /usr/local/prometheus/prometheus.yml
[root@czh ~]# ls
alertmanager-0.22.2.linux-amd64.tar.gz
anaconda-ks.cfg
grafana-7.5.6-1.x86_64.rpm
node_exporter-1.1.2.linux-amd64.tar_2.gz
prometheus-2.28.0.linux-amd64.tar.gz
[root@czh ~]# dnf -y install grafana-7.5.6-1.x86_64.rpm
[root@czh ~]# service grafana-server restart
Reloading systemd:                                         [  OK  ]
Restarting grafana-server (via systemctl):                 [  OK  ]
[root@czh ~]# ss -antl
State   Recv-Q  Send-Q   Local Address:Port   Peer Address:Port Process
LISTEN  0       128            0.0.0.0:22          0.0.0.0:*
LISTEN  0       128               [::]:22             [::]:*
LISTEN  0       128                  *:3000              *:*
LISTEN  0       128                  *:9090              *:*
LISTEN  0       128                  *:9093              *:*
LISTEN  0       128                  *:9094              *:*
LISTEN  0       128                  *:9100              *:*
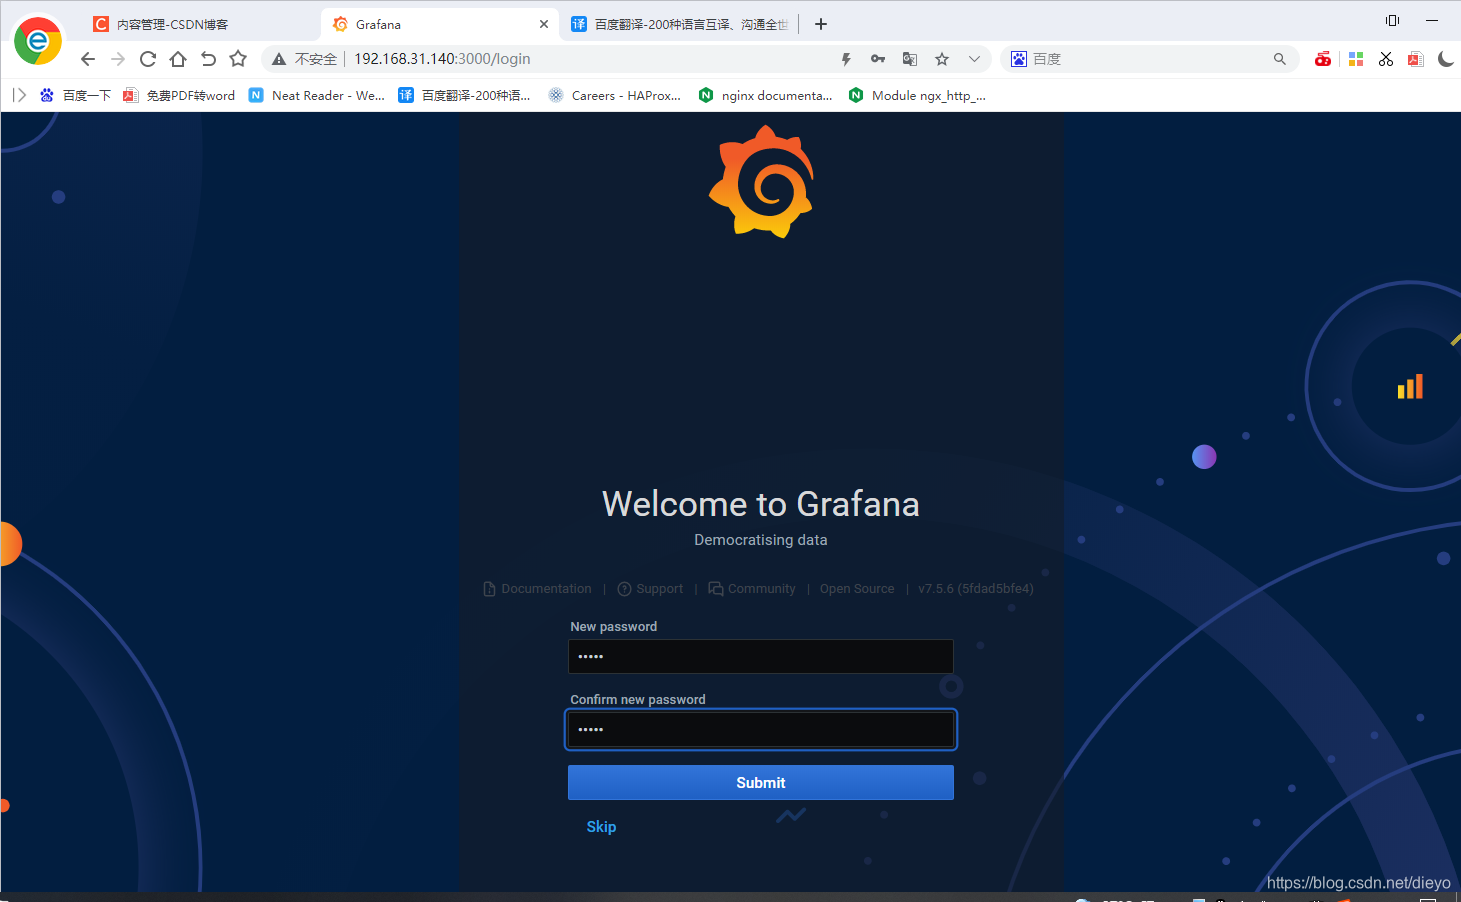
初始密码admin 账号也是admin

修改新的密码
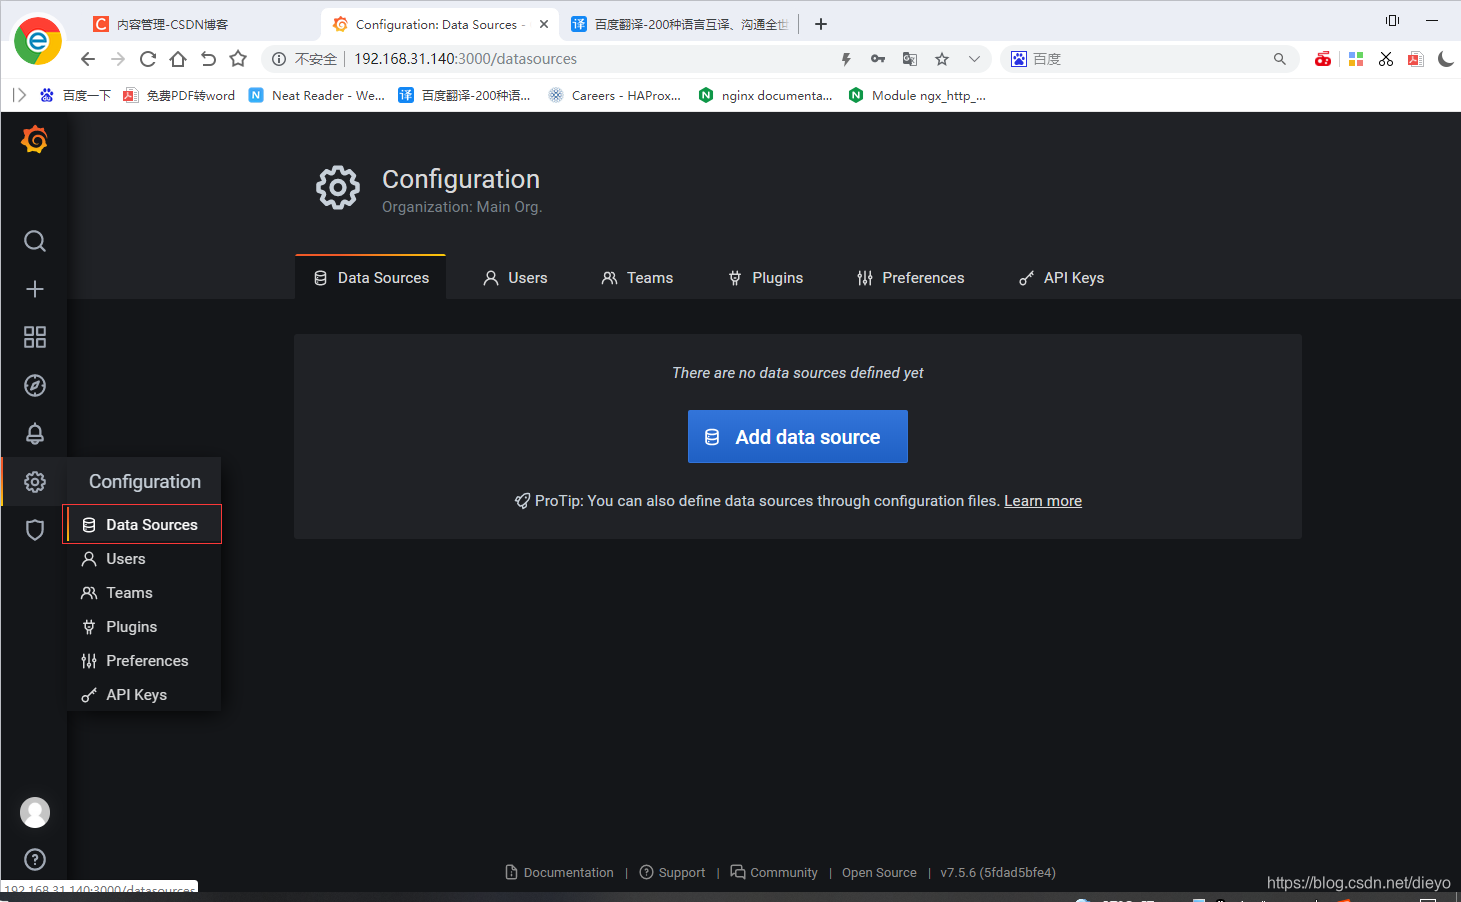
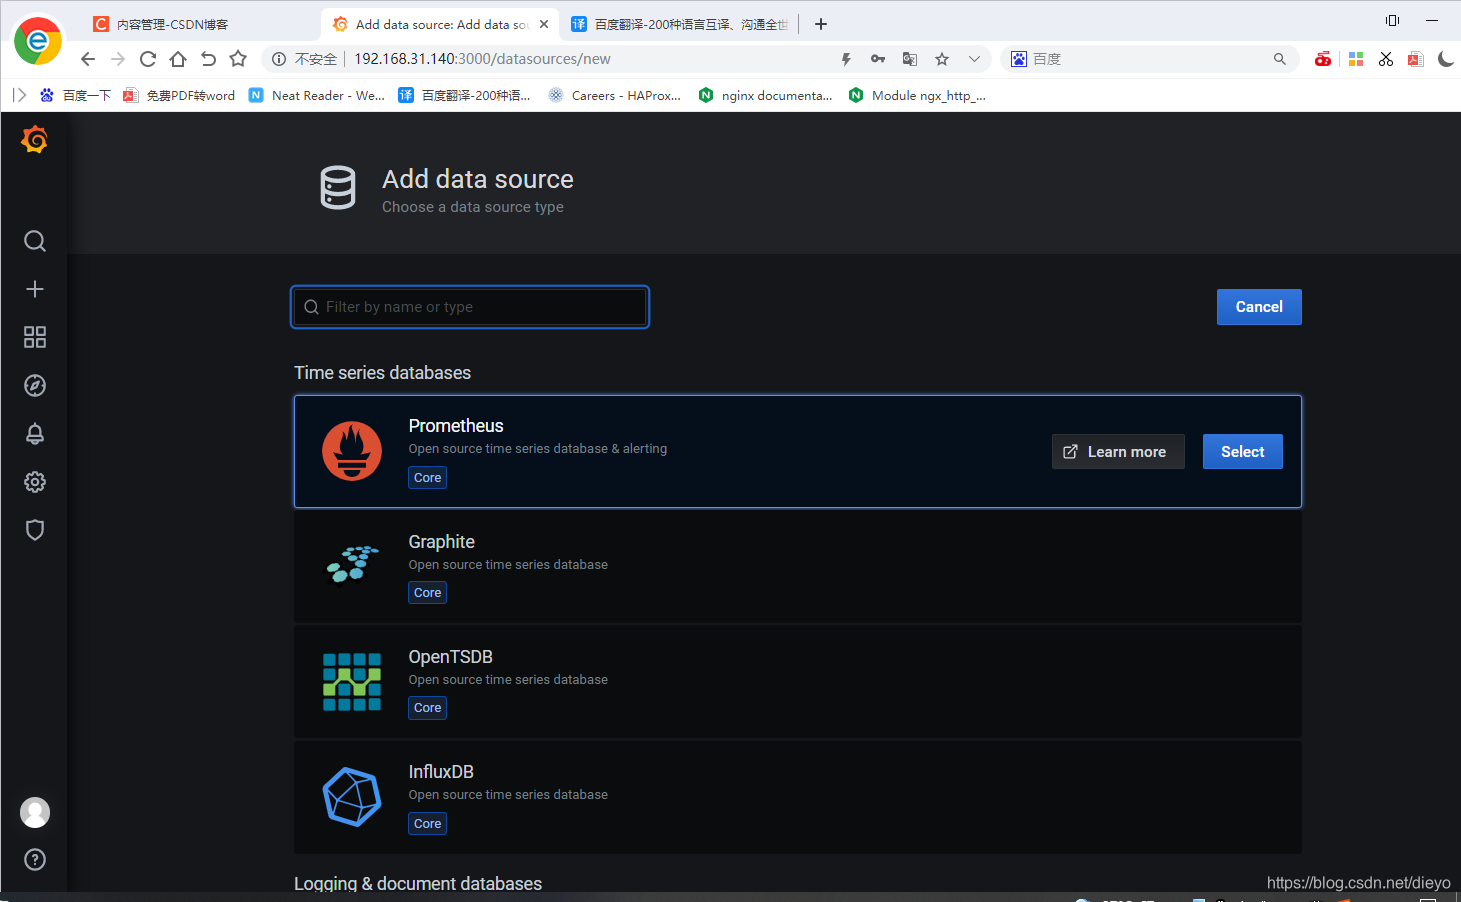
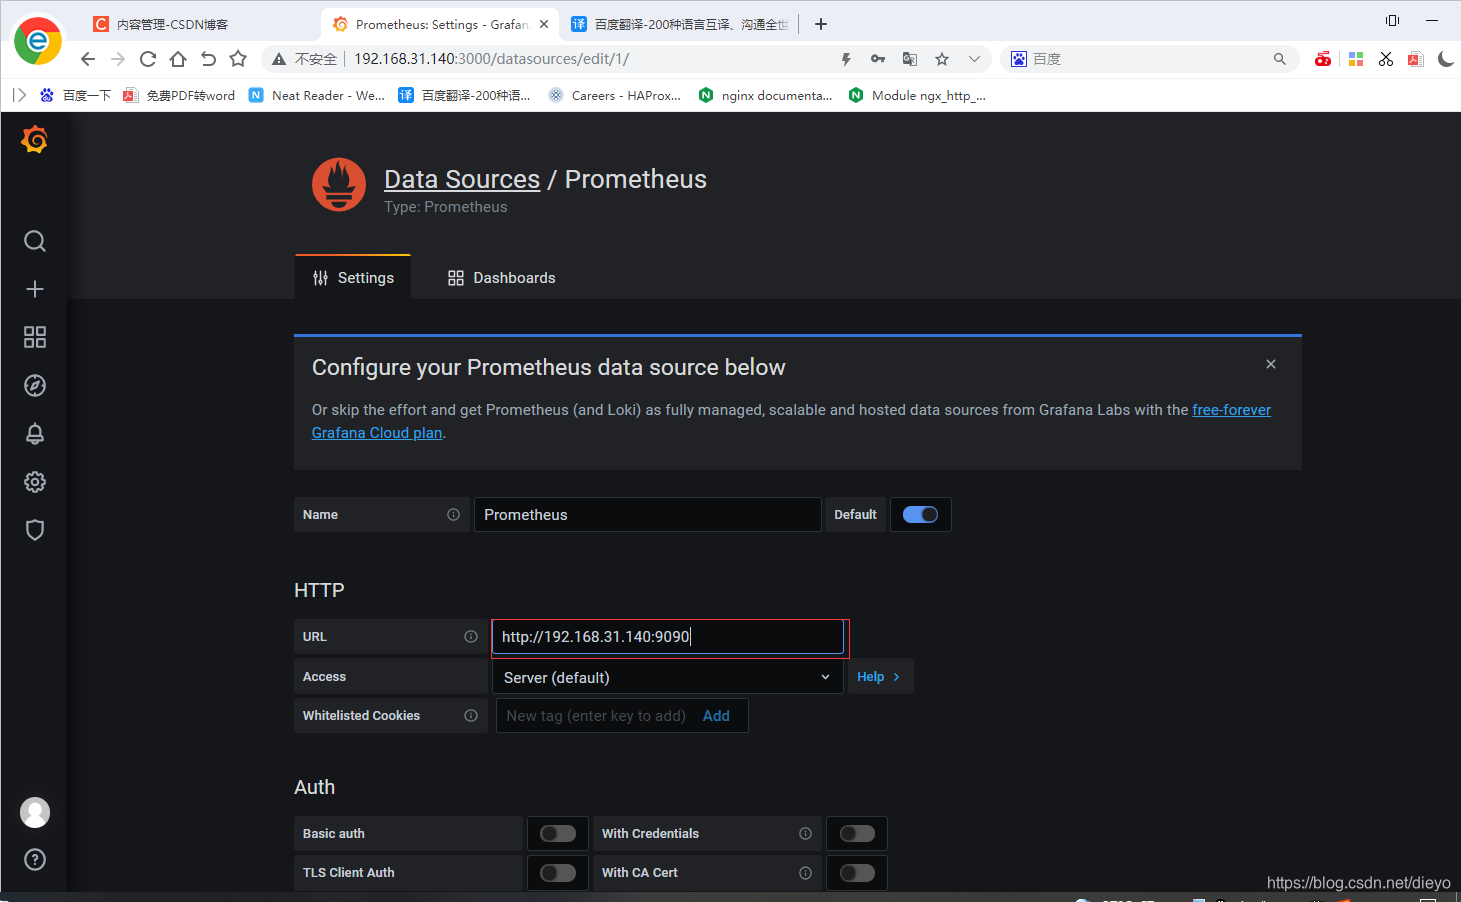
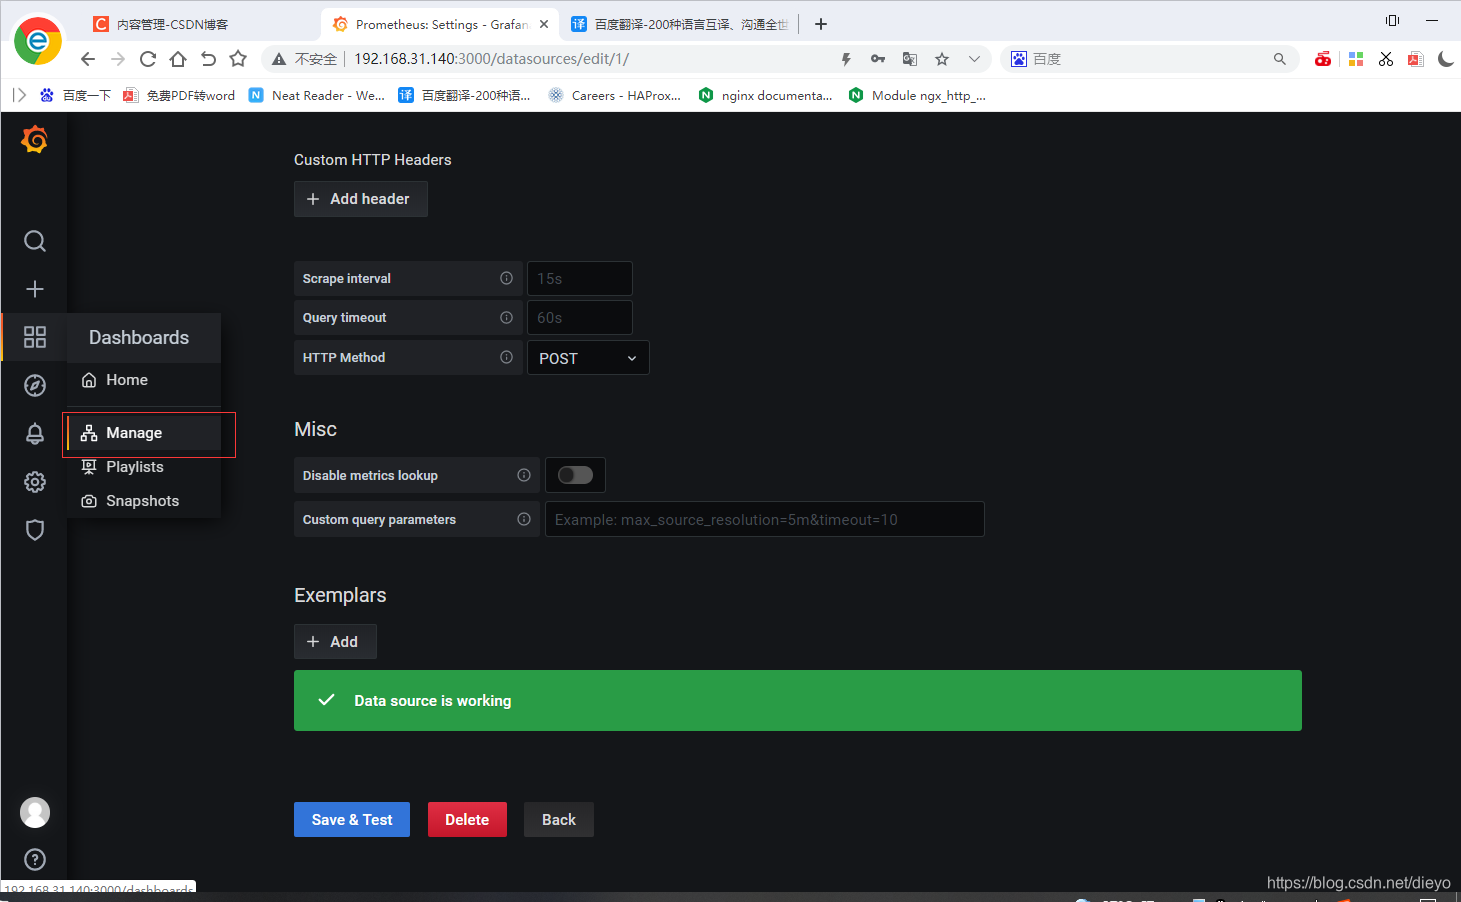
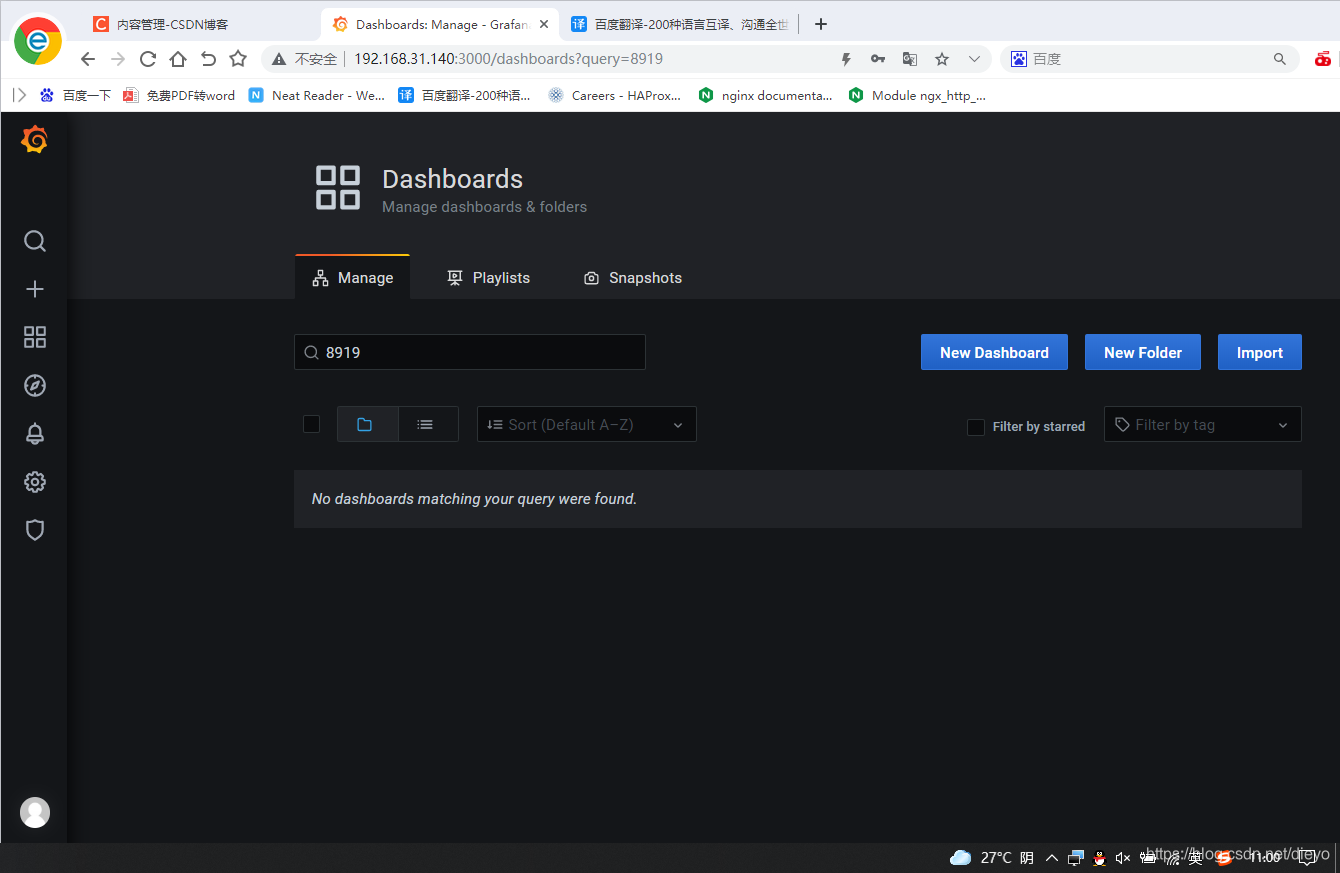
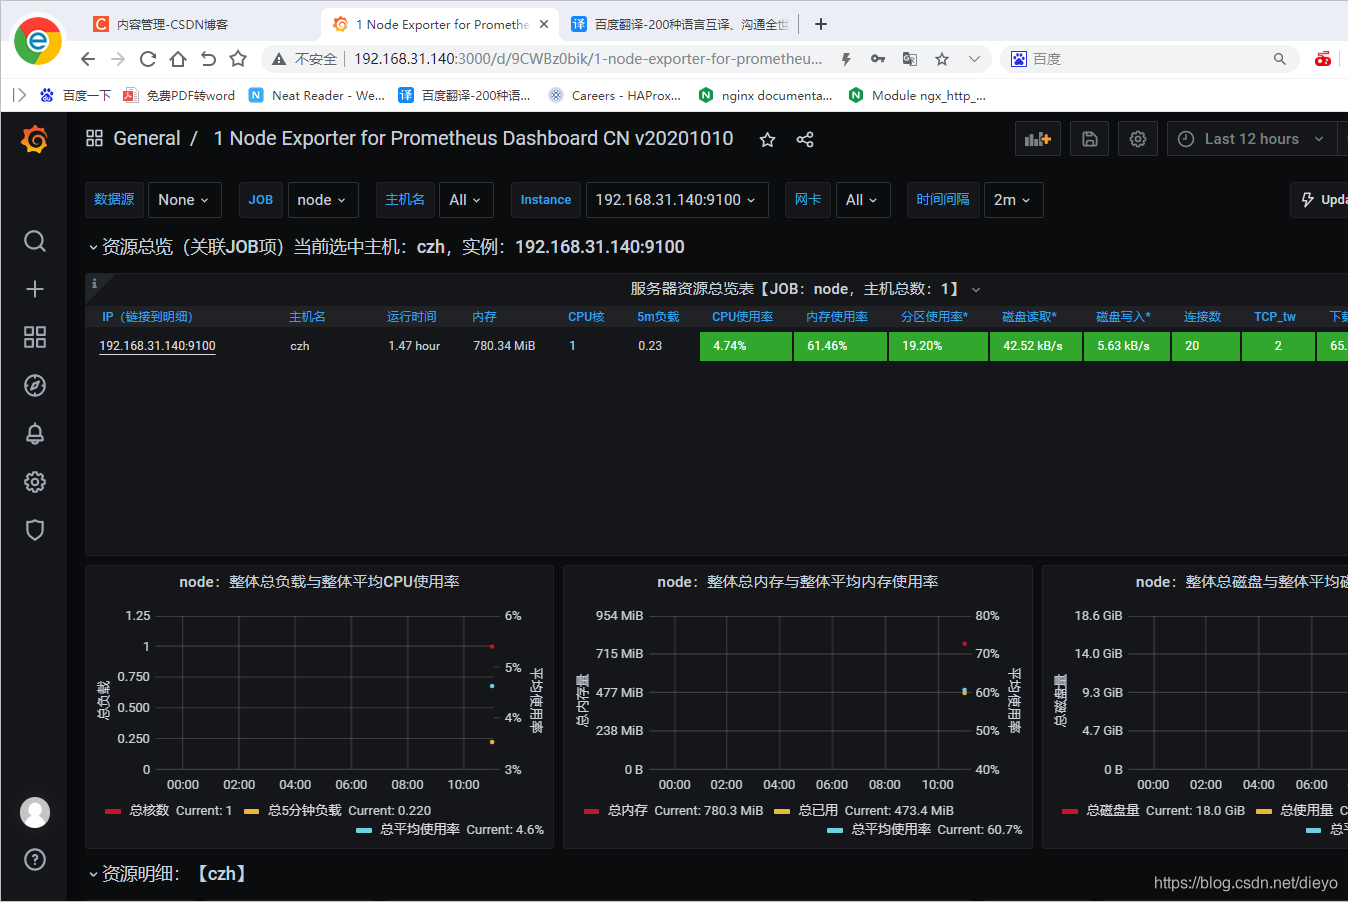
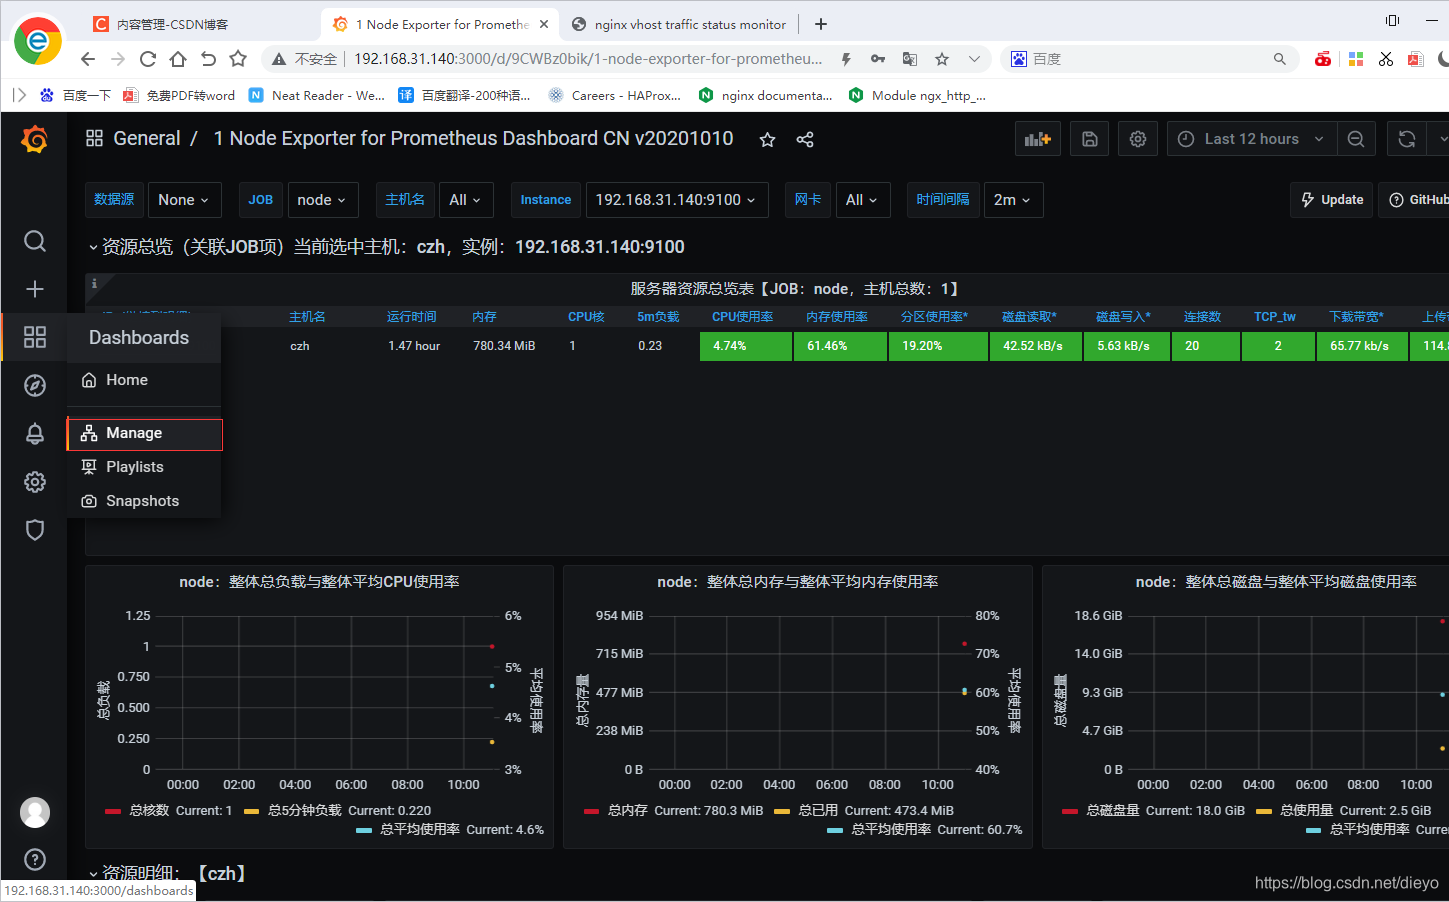
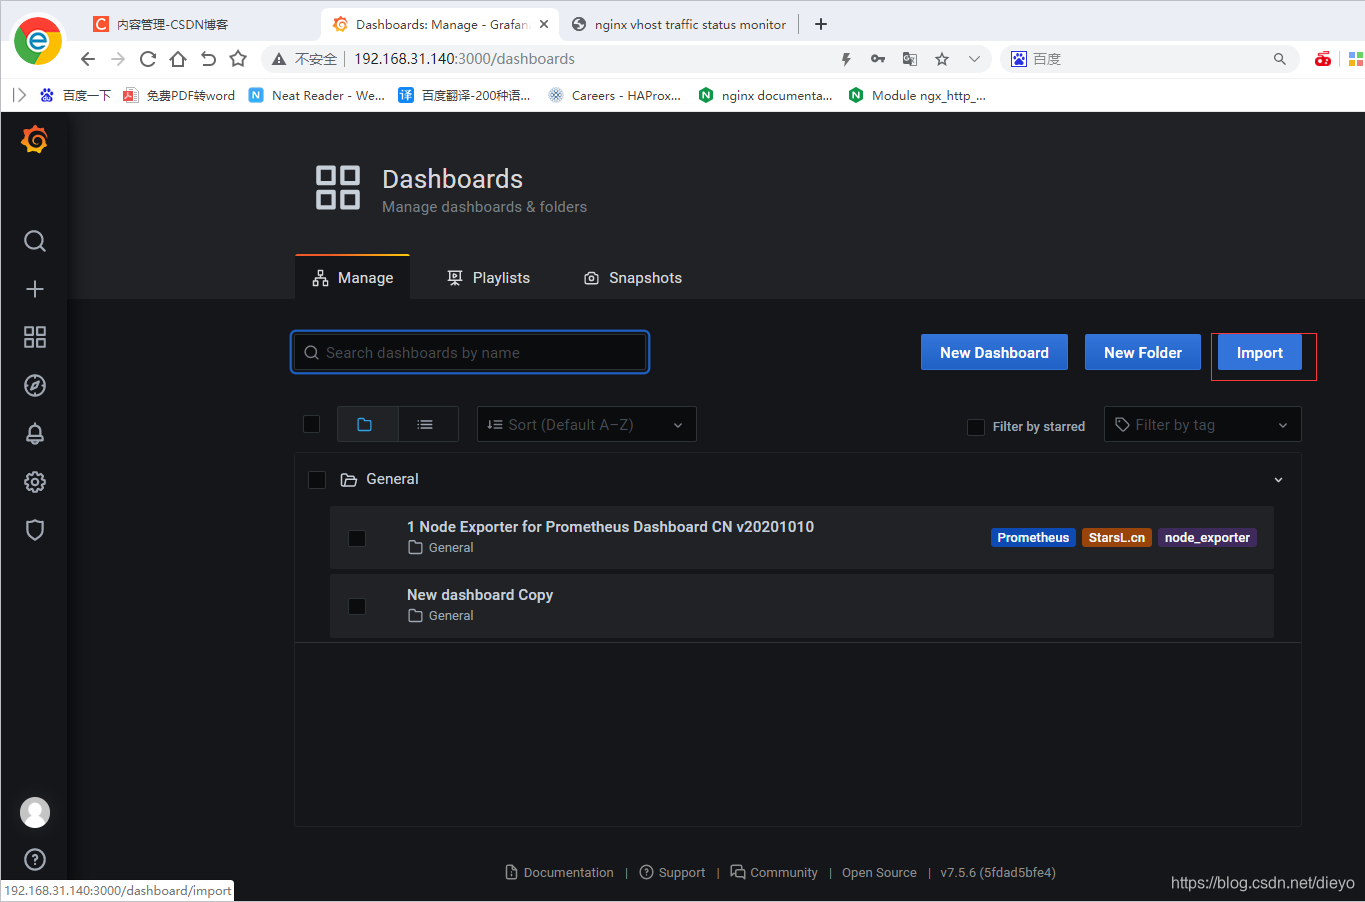
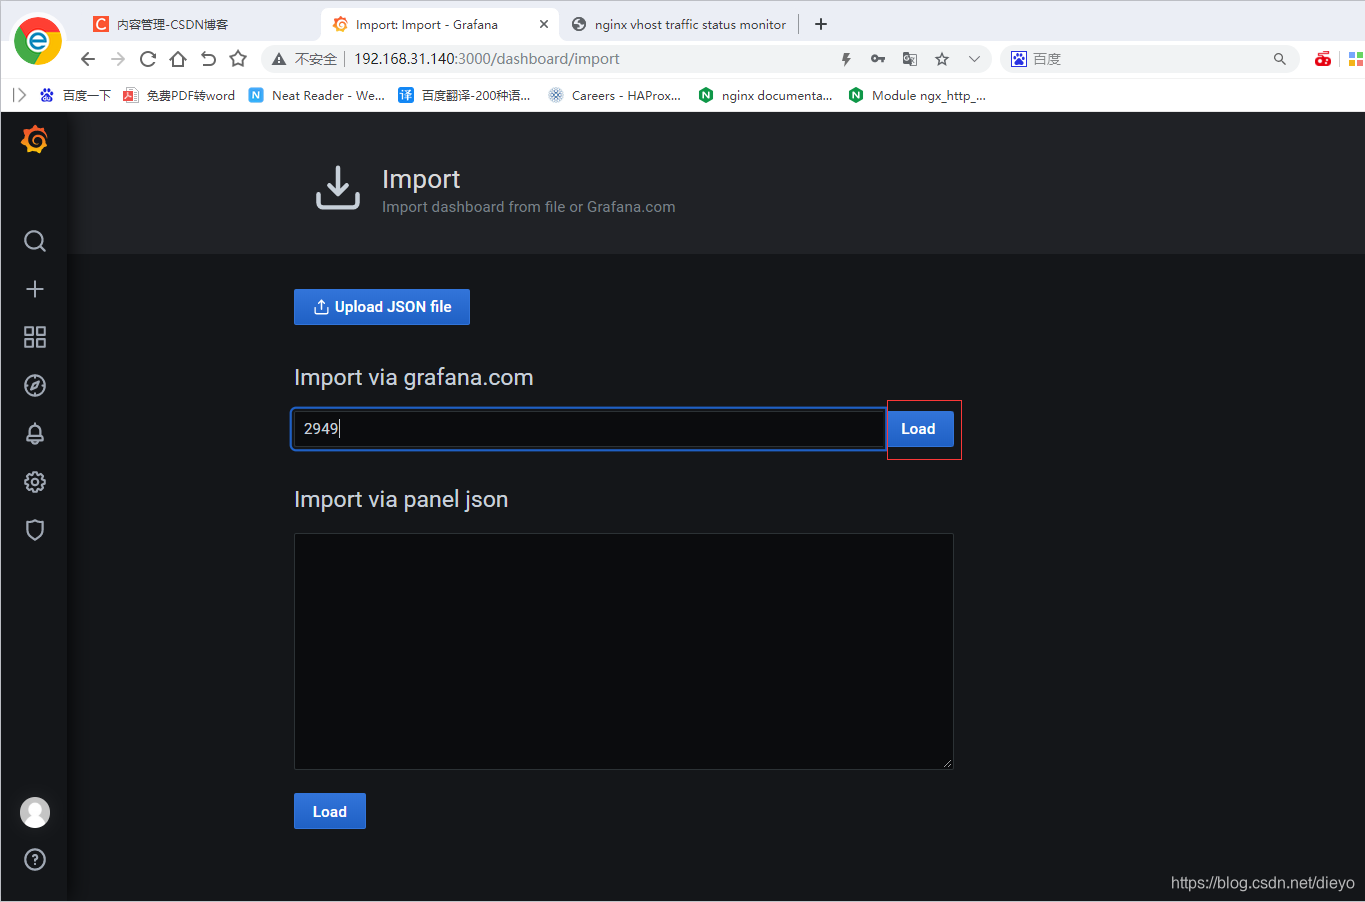
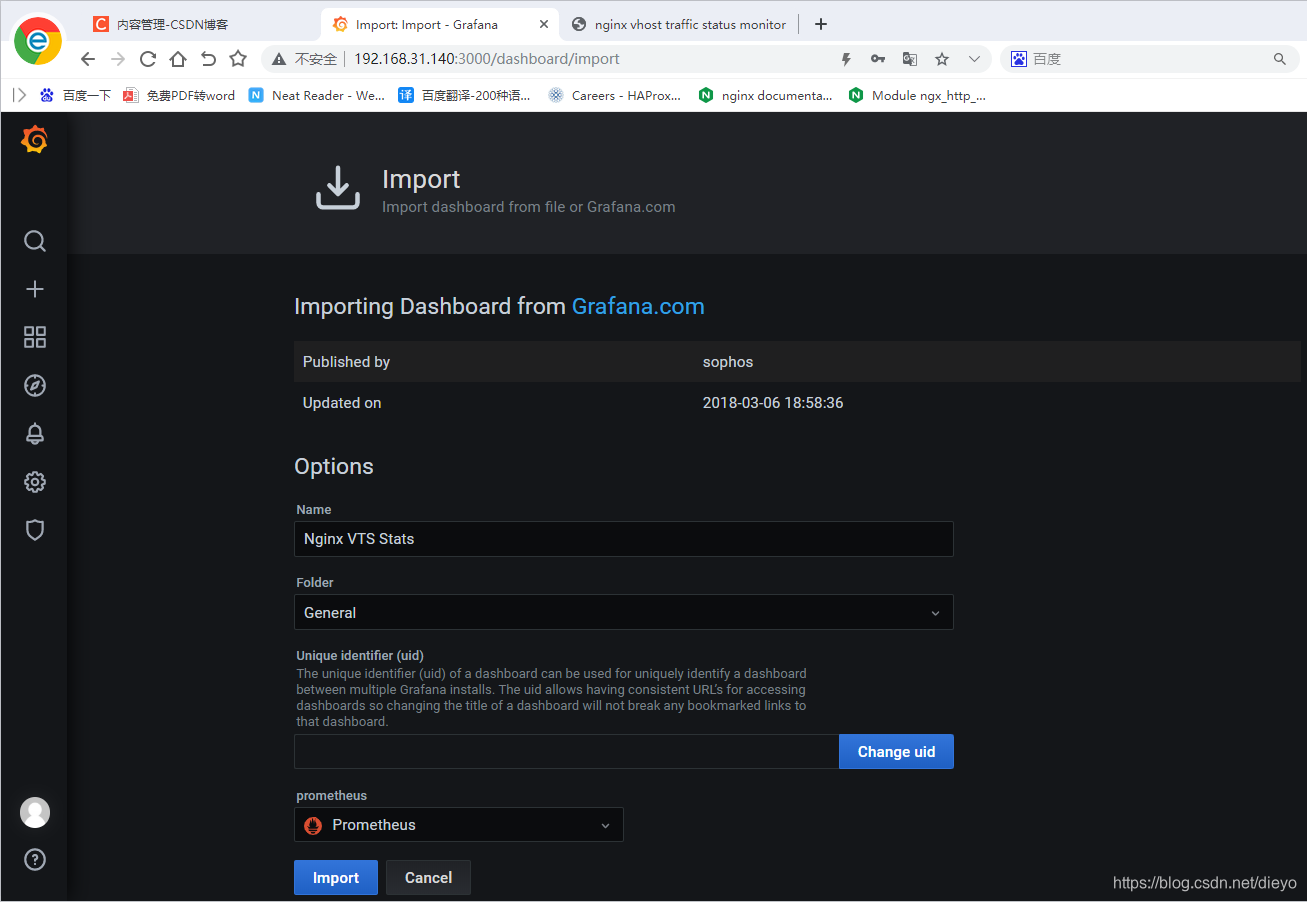
添加模板

监控nginx
安装nginx
下载nginx-module-vts模块
https://github.com/vozlt/nginx-module-vts.git
nginx的监控模块,能够提供json格式的数据产出
[root@prometheus ~]# git clone https://github.com/vozlt/nginx-module-vts.git
[root@czh ~]# unzip nginx-module-vts-master.zip
[root@czh nginx]# cd nginx-1.20.1
[root@czh nginx-1.20.1]# ./configure --prefix=/usr/local/nginx --user=nginx --group=nginx --with-debug --with-http_ssl_module --with-http_realip_module --with-http_image_filter_module --with-http_gunzip_module --with-http_gzip_static_module --with-http_stub_status_module --http-log-path=/var/log/nginx/access.log --error-log-path=/var/log/nginx/error.log --add-module=/root/nginx-module-vts-master/
[root@czh nginx-1.20.1]# make
[root@czh nginx-1.20.1]# cp /usr/local/nginx/sbin/nginx{,-bak}
[root@czh nginx-1.20.1]# pkill nginx;\cp objs/nginx /usr/local/nginx/sbin/;nginx
[root@czh nginx-1.20.1]# nginx -V
nginx version: nginx/1.20.1
built by gcc 8.5.0 20210514 (Red Hat 8.5.0-2) (GCC)
built with OpenSSL 1.1.1k  FIPS 25 Mar 2021
TLS SNI support enabled
configure arguments: --prefix=/usr/local/nginx --user=nginx --group=nginx --with-debug --with-http_ssl_module --with-http_realip_module --with-http_image_filter_module --with-http_gunzip_module --with-http_gzip_static_module --with-http_stub_status_module --http-log-path=/var/log/nginx/access.log --error-log-path=/var/log/nginx/error.log --add-module=/root/nginx-module-vts-master/
修改配置文件
[root@czh nginx-1.20.1]# vim /usr/local/nginx/conf/nginx.conf
#在server中添加
        location /status {
            vhost_traffic_status_display;
            vhost_traffic_status_display_format html;
        }
#在http中添加
vhost_traffic_status_zone;
[root@czh nginx-1.20.1]# nginx -s reload
安装nginx-vts-exporter
主要用于收集Nginx的监控数据,并且给prometheus提供监控接口,默认端口号是9913
[root@czh ~]# wget https://github.com/hnlq715/nginx-vts-exporter/releases/download/v0.9.1/nginx-vts-exporter-0.9.1.linux-amd64.tar.gz
[root@czh ~]# tar xf nginx-vts-exporter-0.9.1.linux-amd64.tar.gz
[root@czh ~]# mv nginx-vts-exporter-0.9.1.linux-amd64 /usr/local/nginx-vts-exporter
编写service文件
[root@czh ~]#  vim /usr/lib/systemd/system/nginx_vts_exporter.service
[root@czh ~]#  cat /usr/lib/systemd/system/nginx_vts_exporter.service
[Unit]
Description=prometheus_nginx_vts
After=network.target

[Service]
Type=simple
ExecStart=/usr/local/nginx-vts-exporter/nginx-vts-exporter  -nginx.scrape_uri http://192.168.31.140/status/format/json
Restart=on-failure

[Install]
WantedBy=multi-user.target
启动nginx-vts-exporter
[root@czh ~]# systemctl daemon-reload
[root@czh ~]# systemctl enable  nginx_vts_exporter
Created symlink /etc/systemd/system/multi-user.target.wants/nginx_vts_exporter.service → /usr/lib/systemd/system/nginx_vts_exporter.service.
[root@czh ~]# systemctl start  nginx_vts_exporter
[root@czh ~]# ss -antl
State   Recv-Q  Send-Q   Local Address:Port   Peer Address:Port Process
LISTEN  0       128            0.0.0.0:22          0.0.0.0:*
LISTEN  0       128            0.0.0.0:80          0.0.0.0:*
LISTEN  0       128               [::]:22             [::]:*
LISTEN  0       128                  *:3000              *:*
LISTEN  0       128                  *:9913              *:*
LISTEN  0       128                  *:9090              *:*
LISTEN  0       128                  *:9093              *:*
LISTEN  0       128                  *:9094              *:*
LISTEN  0       128                  *:9100              *:*
配置prometheus
[root@czh ~]# vim /usr/local/prometheus/prometheus.yml
  - job_name: 'nginx'
    static_configs:
    - targets: ['192.168.31.140:9913']
[root@czh ~]# systemctl restart prometheus
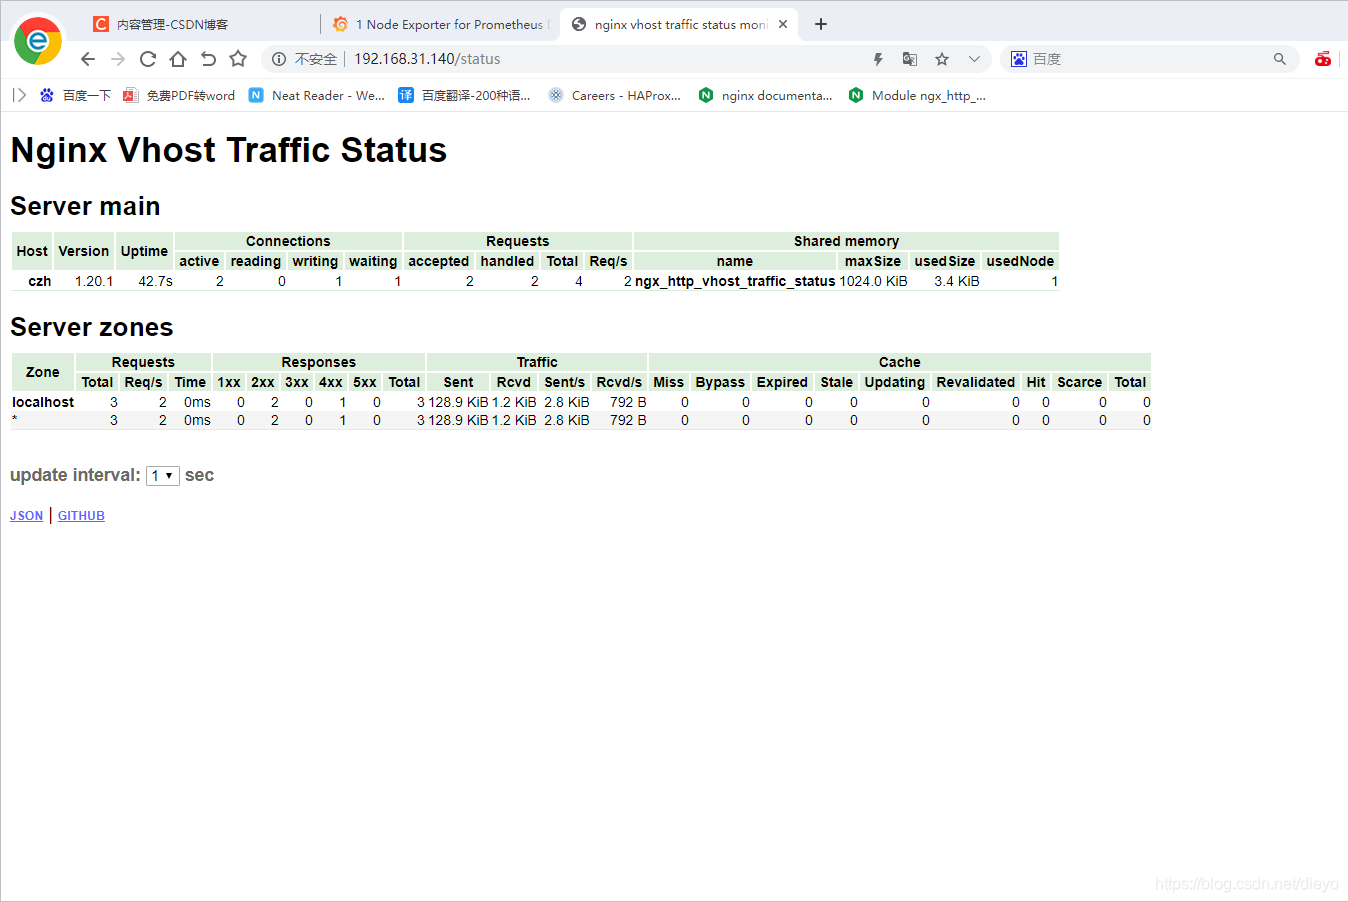
登录一下nginx网页查看
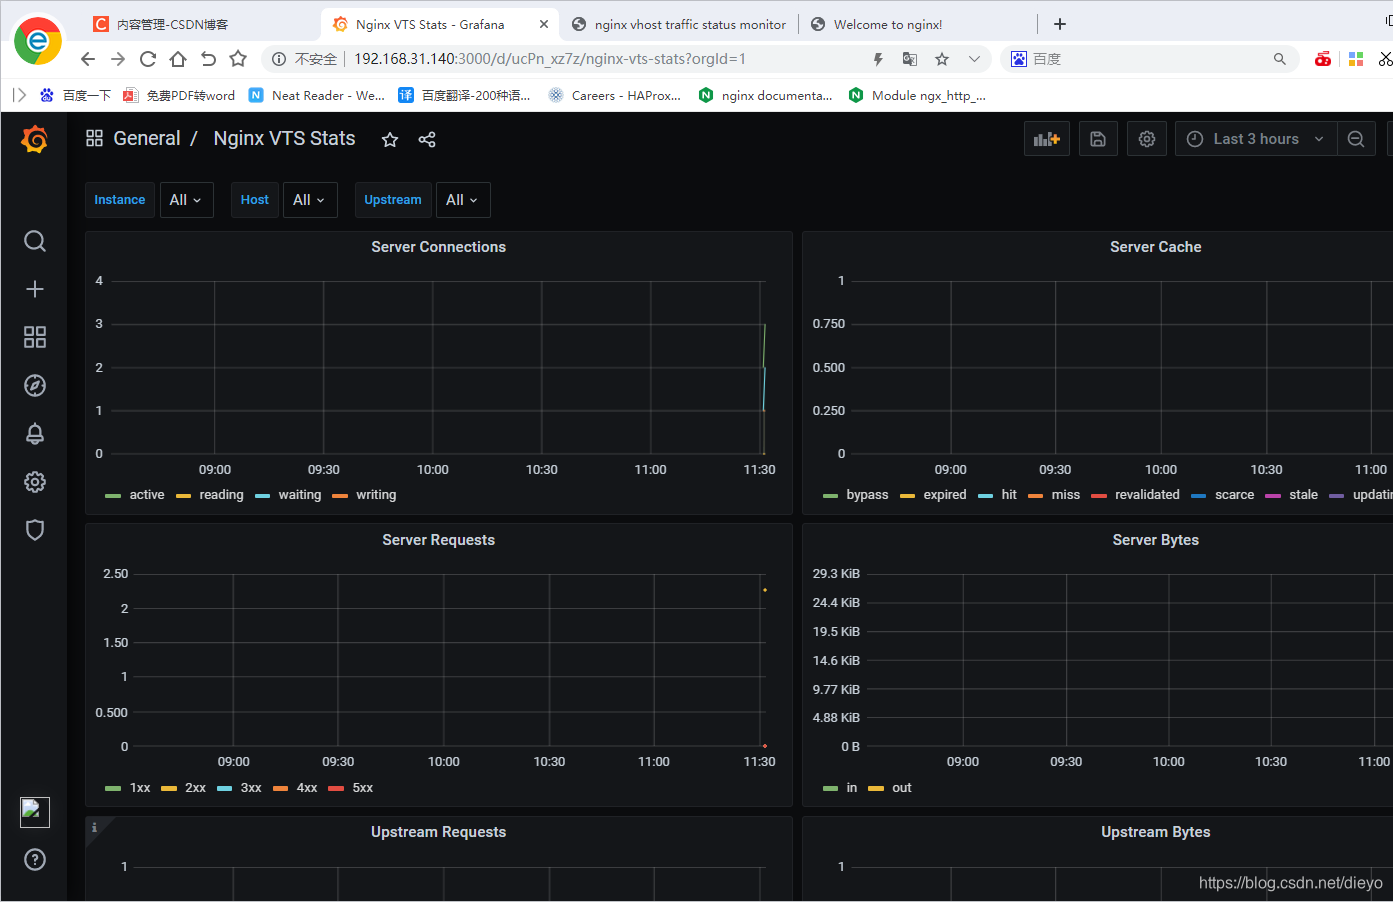
| 指标 | 说明 |
|---|---|
| nginx_server_requests | 统计nginx各个host 各个请求的总数,精确到状态码 |
| nginx_upstream_requests | 统计各个upstream 请求总数,精确到状态码 |
| nginx_server_connections | 统计nginx几种连接状态type的连接数 |
| nginx_server_cache | 统计nginx缓存计算器,精确到每一种状态和转发type |
| nginx_server_bytes | 统计nginx进出的字节计数可以精确到每个host,in进,out出 |
| nginx_upstream_bytes | 统计nginx各个 upstream 分组的字节总数,细分到进出 |
| nginx_upstream_responseMsec | 统计各个upstream 平均响应时长,精确到每个节点 |


 被折叠的 条评论
为什么被折叠?
被折叠的 条评论
为什么被折叠?
 到【灌水乐园】发言


