mapBox使用笔记

【Mapbox】介绍及基本使用 Mapbox 介绍及基本使用 阅读详情

项目需要,以mapBox为基础开发地图相关大屏展示,记录开发与学习。
基础的地图渲染熟悉一些以后还是比较容易的,就是刚开始不熟一脸懵,先附上文档地址
英文地址:https://www.mapbox.com/maps/
中文文档:http://www.mapbox.cn/ 中文文档里里还是会有很多英文 只是简单的介绍为中文了
简单样例:
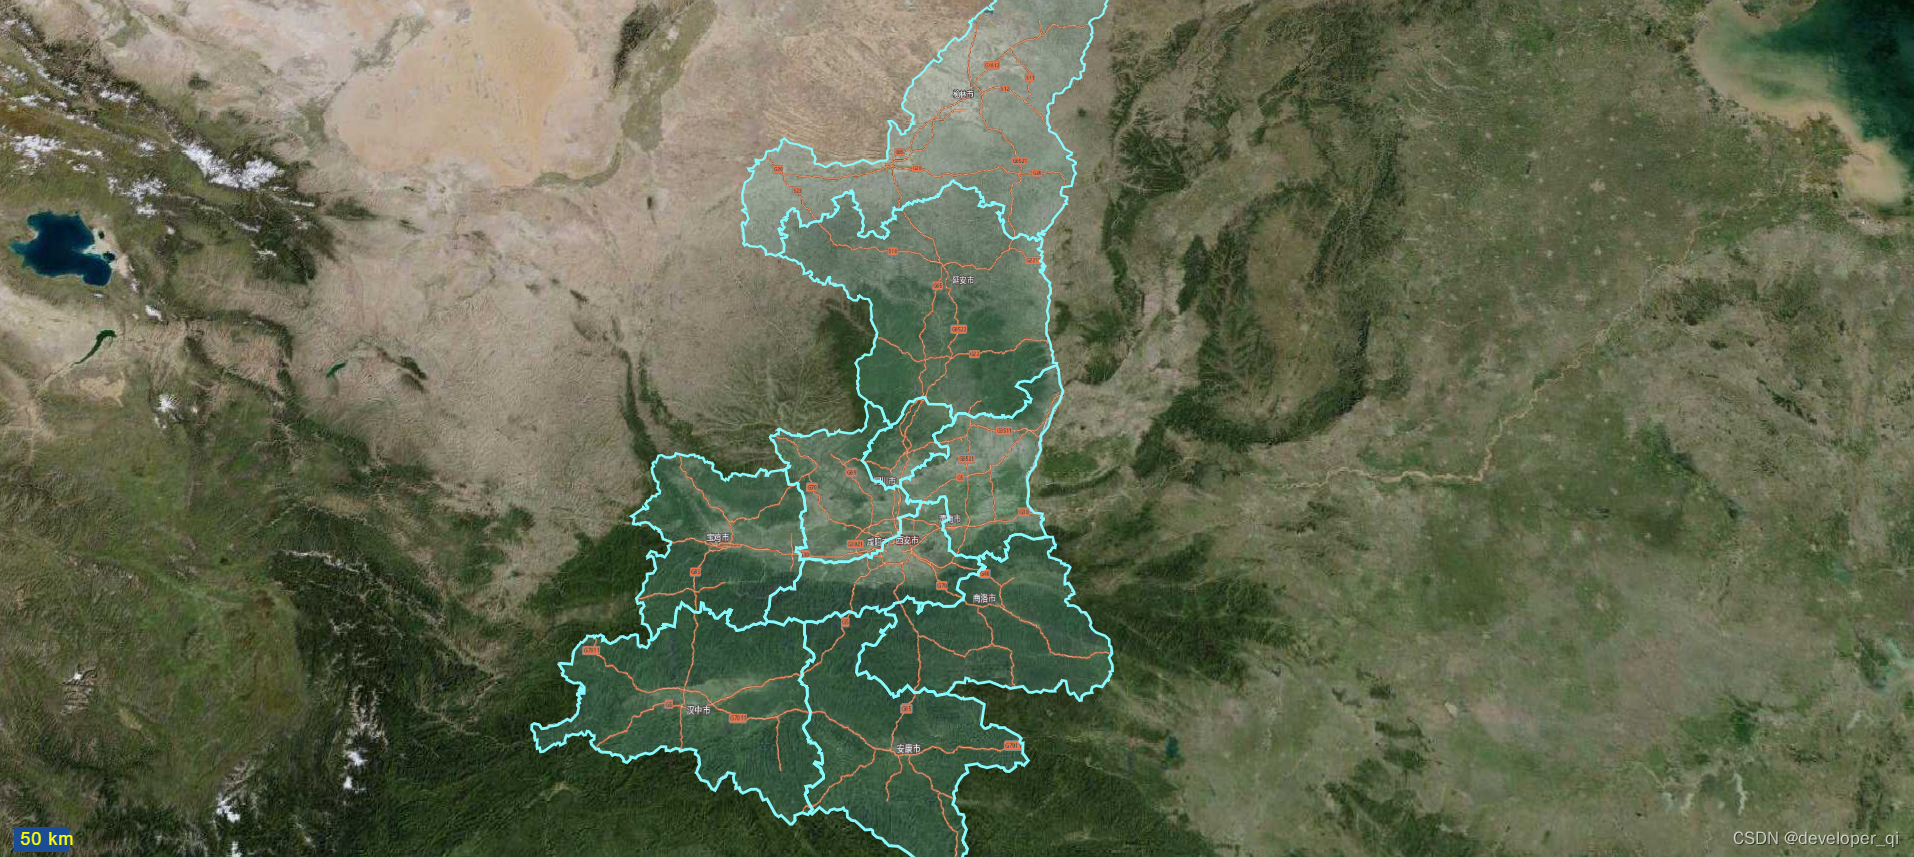
效果展示
<!--dom部分-->
<div :id="mapID" class="s-map" />
// js部分
import mapboxGL from 'mapbox-gl'
import 'mapbox-gl/dist/mapbox-gl.css'

data() {
  return {
    mapStyle: {
      version: 8,
      glyphs: 'url', // 天地图或mapbox  .pdf文件
      sources: {
        'raster-base-tiles': {
          type: 'raster',
          tiles: ['url'], // 此为城市底图
          tileSize: 256,
          zoomOffset: -1
        },
        'raster-tiles': {
          type: 'raster',
          tiles: [
            'http://t0.tianditu.gov.cn/DataServer?T=img_w&x={x}&y={y}&l={z}&tk=你的秘钥'
          ],
          tileSize: 256,
          zoomOffset: -1
        },
        'raster-label-tiles': {
          type: 'raster',
          tiles: ['url'], // 此为城市标注
          tileSize: 256,
          zoomOffset: -1
        }
      },
      layers: [{
          id: 'tdt-base-tiles',
          type: 'raster',
          source: 'raster-base-tiles',
          minzoom: 0,
          maxzoom: 22
        },
        {
          id: 'tdt-img-tiles',
          type: 'raster',
          source: 'raster-tiles',
          minzoom: 0,
          maxzoom: 22
        },
        {
          id: 'tdt-label-tiles',
          type: 'raster',
          source: 'raster-label-tiles',
          minzoom: 0,
          maxzoom: 22
        }
      ]
    }
  }
}

methods: {
  initMap() {
    var hoveredStateId = null
    let self = this
    // 初始化地图
    mapboxGL.accessToken =
      '你的秘钥'
    self.map = new mapboxGL.Map({
      style: self.mapStyle,
      center: {
        lng: 107.6,
        lat: 34.655
      },
      zoom: 5.8,
      pitch: 15,
      minZoom: 5,
      maxZoom: 17,
      container: self.mapID
      // pitchWithRotate: false // 将不会在"拖拽进行地图旋转"的同时控制地图的倾斜。
    })
    // 加载指北针图表
    // self.map.addControl(new mapboxGL.NavigationControl());
    // 加载地图比例尺
    self.map.addControl(
      new mapboxGL.ScaleControl({
        maxWidth: 80,
        unit: 'metric'
      }),
      'bottom-left'
    )
    self.map.on('click', function (e) {})
    self.map.on('load', function () {
      self.map.addSource('states', {
        type: 'geojson',
        data: self.baseUrl + '/static/json/610000_full.geojson'
      })
      // 覆盖的高亮显示
      self.map.addLayer({
        id: 'state-fills',
        type: 'fill',
        source: 'states',
        layout: {},
        paint: {
          'fill-color': 'rgba(135, 250, 254, 0.3)',
          'fill-opacity': [
            'case',
            ['boolean', ['feature-state', 'hover'], false],
            1,
            0.5
          ]
        }
      })
       // 覆盖的高亮描边
      self.map.addLayer({
        id: 'state-lines',
        type: 'line',
        source: 'states',
        layout: {},
        paint: {
          'line-color': 'rgba(135, 250, 254, 1)',
          'line-width': 2
        }
      })
    })
    // 地图初始化完成后,调用父组件的回调方法
    self.$emit('onMapLoaded', self.map)
  },
    // 定位到指定经纬度
    addPointFn(cityObj) {
      cityObj.num = cityObj.num === undefined ? '' : cityObj.num
      const self = this
      // 时间戳
      const timestamp = new Date().valueOf()
      let currEventColor = ''
      if (this.currColors && this.currColors.length > 0) {
        this.currColors.forEach(element => {
          if (element.id === feature.properties.featurecode.replace('.', '')) {
            currEventColor = element.color + '91'
          }
        })
      }

      const x = cityObj.pos[0]
      const y = cityObj.pos[1]
      // 添加动态图标
      const size = 200
      const pulsingDot = {
        width: size,
        height: size,
        data: new Uint8Array(size * size * 4),
        onAdd: function () {
          const canvas = document.createElement('canvas')
          canvas.width = this.width
          canvas.height = this.height
          this.context = canvas.getContext('2d')
        },
        render: function () {
          const duration = 1000
          const t = (performance.now() % duration) / duration
          const radius = (size / 2) * 0.3
          const outerRadius = (size / 2) * 0.7 * t + radius
          const context = this.context
          context.clearRect(0, 0, this.width, this.height)
          context.beginPath()
          context.arc(this.width / 2, this.height / 2, outerRadius, 0, Math.PI * 2)
          context.fillStyle = 'rgba(51, 102, 204,' + (1 - t) + ')'
          context.fill()
          context.beginPath()
          context.arc(this.width / 2, this.height / 2, radius, 0, Math.PI * 2)
          // context.fillStyle = 'rgba(255, 100, 100, 1)'
          context.fillStyle = currEventColor
          context.strokeStyle = 'white'
          context.lineWidth = 2 + 4 * (1 - t)
          context.fill()
          context.font = '28px Arial'
          context.textAlign = 'center'
          context.textBaseline = 'middle'
          context.fillStyle = '#e6b600'
          context.stroke()

          context.fillText(cityObj.num, this.width / 2, this.height / 2)
          this.data = context.getImageData(0, 0, this.width, this.height).data
          self.map.triggerRepaint() // 闪动效果
          return true
        }
      }
      this.mapImageIdList.push('a-' + cityObj.code + timestamp + 'positionimg') // 保存下已有的id 便于之后删除
      this.mapLayerIdList.push('a-' + cityObj.code + timestamp + 'positionpoints')
      self.map.addImage('a-' + cityObj.code + timestamp + 'positionimg', pulsingDot, {
        pixelRatio: 2
      })
      self.map.addLayer({
        id: 'a-' + cityObj.code + timestamp + 'positionpoints',
        type: 'symbol',
        source: {
          type: 'geojson',
          data: {
            type: 'FeatureCollection',
            features: [{
              type: 'Feature',
              geometry: {
                type: 'Point',
                coordinates: [x, y]
              }
            }]
          }
        },
        layout: {
          'icon-image': 'a-' + cityObj.code + timestamp + 'positionimg',
          'icon-ignore-placement': true
        }
      })
      self.map.on('mouseenter', 'a-' + cityObj.code + timestamp + 'positionpoints', function () {
        self.map.getCanvas().style.cursor = 'pointer'
      })
      self.map.on('mouseleave', 'a-' + cityObj.code + timestamp + 'positionpoints', function () {
        self.map.getCanvas().style.cursor = ''
      })

      // 记录上一个点位的点位层名
      // this.eventPointTimestamp.push('a-' + timestamp)
      // console.log(this.eventPointTimestamp)
    },
    addPop(obj) { // 地图图层上插入自定义内容
      const self = this
        let str = ''
        const content = `<div class="map-pop-style">${str}</div>`
        self.popup = new mapboxGL.Popup({ closeButton: true }).setLngLat(obj.pos).setHTML(content).addTo(self.map)
    },
}

简单的示例就完成了。其中addSource里的data属性值geojson为阿里云获取
阿里云geojson获取地址DataV.GeoAtlas地理小工具系列
另echarts geojson获取地址 
echarts-china-cities-js/geojson/shape-only at master · echarts-maps/echarts-china-cities-js · GitHub

从echarts资源列表里也可以查到

https://github.com/ecomfe/awesome-echarts

点击地图高亮展示也是类似的操作
1. 捕获地图点击事件
2. 通过地图坐标获取相应市或区县 geoJson文件
3. 调用地图addSource方法加载图层,paint属性内配置相应线或面的颜色。
 

mapbox属性内配置项文档在style分类里地址为
http://www.mapbox.cn/mapbox-gl-js/style-spec/

后续更新地图上标记地点

Mapbox GL JS 中文文档 Mapbox GL JS-地图是通过在浏览器中而不是在服务器上将矢量瓦片与样式规则相结合来动态渲染的,这使得可以根据用户交互来更改地图的样式和显示数据。在开始使用Mapbox GL JS之前,您需要有一个Mapbox访问令牌,并使用 CDN 或 Mapbox GL-npmpackage 将 Mapbox GL JS.添加到您的项目中。由于Mapbox GL JS中的层是远程的,所以它们是异步的。有关Mapbox GL JS地图中使用的Mapbox设计和自定义地图样式的更多示例,请参阅我们的。 阅读详情

相关推荐

Mapbox Android学习笔记(8)离线地图

Offline 通常,您可能会发现您的用户群大部分时间都不在网格上。Maps SDK允许您下载和存储预先选择的区域,以便在设备脱机时使用。下载地图的结果是使用下载区域内的style、tile和其他资源生成功能齐全的地图。 Offline Plugin 用户的设备并不总是有足够强大的互联网连接来下载和查看地图块。您可能想要在Android项目中构建一个离线模式来解释这种情况。Android的Mapb...

Test_tju的博客 2674

使用mapbox地图的一丢丢小心得

Mapbox是一个基于云的地图平台,提供开发人员在他们的应用程序中集成地图,并提供各种地图样式、地图数据和地理编码服务。Mapbox的地图可用于各种应用程序、网站和移动应用中,包括路线规划、导航、地点搜索、位置定位、数据可视化等。Mapbox以开源和透明度为基础,为开发人员提供了无限制的灵活性和个性化定制。Mapbox的API易于使用、精确和平滑,并支持多种开发语言和平台。此外,Mapbox还提供了开发人员工具和SDK,以便他们在开发地图应用程序时更轻松、更高效。

m0_63338904的博客 6908

掌握地图可视化:深入学习Mapbox文档

Mapbox学习文档是一份深入学习地图可视化的综合资料,涵盖了Mapbox地图开发的方方面面。本文档将带您从基础入门到进阶掌握,为您展示地图定制化的强大功能,以及如何创建令人惊叹的地图视觉效果。 本文档适用于所有对地图可视化感兴趣的开发者和设计师。不论您是刚入门的新手还是经验丰富的地图开发专家,都可以在这里找到有价值的知识和技巧。 学习本文档,您将掌握以下技能: 使用Mapbox的基本功能和API进行地图展示和交互。 制作具有个性化标识和风格的定制地图。 运用数据可视化技巧在地图上呈现各种信息。 实现地图的动态效果,提升用户体验。 了解地图开发中的最佳实践和性能优化技巧。 本文档包含大量实例和案例,帮助您快速掌握知识并应用于实际项目。 所有代码示例都经过精心编写和测试,确保准确可行。 欢迎与其他开发者共享您的经验和学习心得,一起构建更好的地图可视化世界!

MapBox介绍

来自美国的一家为开发者提供开发工具及开放平台的地图服务公司,不仅拥有有顶尖的测绘工程师们,同时110+万注册开发者以及每月3亿C端活跃用户也成为了他们的贡献者。官网:https://www.mapbox.com/mapbox以开源的形式构建了矢量瓦片技术生态,基于矢量瓦片规格和瓦片渲染规格,开发了矢量切片工具、瓦片服务传输框架、瓦片在各种终端下渲染使用的全套工具包、样式编辑等等。比如用户的地理位置移动情况、他们移动的速度。Mapbox设定了程序,收集到的数据会自动更新Mapbox地图的准确度。

weixin_39676449的博客 1万+

RV1106G3的fastboot调试

本文详细描述了在幸狐的Luckfox Pico Ultra硬件平台上,使用官方SDK进行系统优化和YOLOv5s模型部署的过程。首先,硬件板卡使用幸狐的SDK进行EMMC非Fastboot配置时功能正常,但Fastboot配置编译失败,通过修改设备树中的ramdisk大小解决了编译问题,但运行时仍报错。幸狐提供的Fastboot烧录文件可正常运行,表明硬件支持Fastboot。随后,使用官方SDK版本rv1106_rv1103_240813进行编译和调试,发现EMMC Fastboot启动失败,通过修改U-

fzktongyong的博客 2354

一文读懂AI大模型时代的RAG技术

RAG(Retrieval-Augmented Generation,检索增强生成) 是一种结合检索技术与生成模型的技术架构,旨在通过动态引入外部知识库增强大语言模型(LLM)的生成能力。其核心思想是通过检索系统从外部数据源(如企业知识库、实时文档等)获取相关信息,并将检索结果作为上下文输入生成模型,以提高生成答案的准确性、时效性和专业性

awei0916的专栏 2117

Mapbox 项目学习笔记

Mapbox L7 基础学习

weixin_57468559的博客 1449

HALCON 20.11实战:5步搞定工业图像异常检测(附完整代码)

本文提供了一份基于HALCON 20.11的工业图像异常检测实战指南。通过五个核心步骤——环境准备、数据预处理、模型训练、推理解析与工程化部署,详细演示了如何利用深度学习技术,仅使用正常样本快速构建并优化金属表面划痕等缺陷的检测模型,并附有完整可运行的HDevelop代码,助力工程师实现高效、智能的工业视觉质检。

weixin_29243279的博客 139

mapbox学习笔记

mapbox初学者笔记 初学者参考学习链接: http://www.mapbox.cn/help/how-mapbox-works/ GeoJson 一种用于编码各种地理数据结构的格式 { "type": "Feature", //图形信息 "geometry": { "type": "Point", "coordinates": [125.6, 10.1] }, //属性(包括在弹窗里的title、name和description等) "properties": {

Youxingfang的博客 1088

瑞芯微rk3568移植openbmc(一)----关于ob移植的优缺点

基于rock3a的单板,CPU为瑞芯微rk3568的环境,移植了openbmc

feixiang3839的专栏 5535

微信自动化进阶:Python识别特定消息并自动回复(基于win32api控件操作)

本文详细介绍了如何使用Python和win32api实现微信消息的智能监控与自动回复。通过精准识别聊天记录中的特定关键词,结合多级匹配策略和性能优化技巧,构建稳定高效的自动化回复系统,适用于企业客服、个人助手等场景。

weixin_42663213的博客 441

mapbox的初次笔记——wsdchong

mapbox的基本概念 任何GIS引擎必然要处理两个部分,一个是数据来源,一个是这些数据在界面呈现的样子,在style里面的source和layer对应于这两个部分。

wsdchong的博客 2467

SAP 物料主数据 Forecasting 视图,别把预测只当成一个数字字段

摘要(150字): SAP S/4HANA物料主数据的Forecasting视图常被忽视,但对依赖历史消耗规律的物料至关重要。该功能基于工厂维度的历史消耗数据,结合预测参数自动计算未来需求,动态调整重订货点和安全库存。预测模板(Forecast Profile)能标准化参数设置,而消耗数据(Consumption Values)的质量直接影响预测结果。预测值作为MRP输入,需注意保存操作才能生效。自动重订货点功能通过分析消耗波动和服务水平,实现库存策略的动态优化。Individual Forecast功能则

2007 年 ~ 2025 年,深耕 SAP 技术 18 年 1432

Mapbox 笔记1(Mapbox 是如何工作的)

文章目录初步了解MapboxMapbox 是如何工作的Access TokenToken的使用范围URL 限制创建和管理 access token创建新数据geojson数据格式创建数据集数据集转换为 tileset 初步了解Mapbox Mapbox 是如何工作的 Access Token 需要获取 access token(访问令牌)以使用 Mapbox 的各种工具、API、SDK。 Token的使用范围 每个 access token 都可以限制Mapbox API的使用范围。在选择 token 范围

hequhecong10857的博客 2610

【CanMV K210】AI 视觉 MNIST 手写数字识别与分类推理

本文介绍了基于CanMV K210开发板的MNIST手写数字识别实验。实验通过摄像头采集图像,经过开窗、灰度化、缩放、反色等预处理后,使用KPU神经网络加速器运行MNIST分类模型,最终在LCD上显示识别结果。重点讲解了分类模型与检测模型的区别、图像预处理流程以及KPU推理结果的解析方法。实验帮助理解从图像采集到分类输出的完整AI视觉处理链路,并提供了调试思路和硬件连接说明。

Mr数据杨 364

R语言中的混淆矩阵(Confusion Matrix)是一种常用的评估多分类模型性能的工具

除了准确率,混淆矩阵还提供了其他有用的指标,如灵敏度(Sensitivity)、特异度(Specificity)、精确度(Precision)和召回率(Recall)。混淆矩阵通过比较模型预测结果与实际标签的一致性,帮助我们了解模型的分类准确性和错误类型。此外,混淆矩阵还提供了各种错误类型的统计信息,如假阳性(False Positive)和假阴性(False Negative)等。通过混淆矩阵,我们可以了解模型的整体性能和错误类型,从而对模型进行评估和改进。最后,为了更好地理解混淆矩阵的结果,可以使用。

HackSquad的博客 972

mapbox 笔记

1:mapbox 更改图层属性 map.setPaintProperty(layer, 'fill-opacity', 1); 2:mapbox 更改图层数据源 map.getSource(source).setData(cityHeatDatas); 3:mapbox 获取当前地图已添加的图层layers及数据源sources const layers = map.getStyl...

qq_34870529的博客 3191

复分析 阿尔福斯(Ahlfors) 第三版答案 英文

答案分为十章,有部分习题没有答案,全英文复分析阿尔福斯(Ahlfors) 第三版答案

Mapbox学习笔记

最近公司需求要搞离线地图等一些需求,然后找了半天资料对比,决定使用mapbox来实现,理由开源,并且支持多端(Android,ios,web,pc)接入也简单。包含百度和高德大部分的功能。并且可扩展性也很高。 首先在使用之前我们需要放一个官方的链接地址把MapBox map for Android, ...

long_hai_d的博客 1478

NTscan扫描工具

ntscan是一个扫描器,可以扫描没有密码和弱密码的共享,先到配置文件中填写猜测的用户名和密码,扫描过程中右侧出现的是扫描日志。

怀旧版电脑GBC模拟器

再现原版GBC掌机的界面,电脑运行连游戏界面都一样大小,很怀旧,很真实,(英文版)强烈推荐,很小的文件,很难才找到的。

mapbox笔记

个人主写C++,初涉前端,做个笔记

chubu3218的博客 376

深度学习工具包 DeepLearningToolbox

深度学习工具包Deprecation notice.-----This toolbox is outdated and no longer maintained.There are much better tools available for deep learning than this toolbox, e.g. [Theano](http://deeplearning.net/software/theano/), [torch](http://torch.ch/) or [tensorflow](http://www.tensorflow.org/)I would suggest you use one of the tools mentioned above rather than use this toolbox.Best, Rasmus.DeepLearnToolbox================A Matlab toolbox for Deep Learning.Deep Learning is a new subfield of machine learning that focuses on learning deep hierarchical models of data.It is inspired by the human brain's apparent deep (layered, hierarchical) architecture.A good overview of the theory of Deep Learning theory is[Learning Deep Architectures for AI](http://www.iro.umontreal.ca/~bengioy/papers/ftml_book.pdf)For a more informal introduction, see the following videos by Geoffrey Hinton and Andrew Ng.* [The Next Generation of Neural Networks](http://www.youtube.com/watch?v=AyzOUbkUf3M) (Hinton, 2007)* [Recent Developments in Deep Learning](http://www.youtube.com/watch?v=VdIURAu1-aU) (Hinton, 2010)* [Unsupervised Feature Learning and Deep Learning](http://www.youtube.com/watch?v=ZmNOAtZIgIk) (Ng, 2011)If you use this toolbox in your research please cite [Prediction as a candidate for learning deep hierarchical models of data](http://www2.imm.dtu.dk/pubdb/views/publication_details.php?id=6284)```@MASTERSTHESIS\{IMM2012-06284, author = "R. B. Palm", title = "Prediction as a candidate for learning deep hierarchical models of data", year = "2012",}```Contact: rasmusbergpalm at gmail dot comDirectories included in the toolbox-----------------------------------`NN/` - A library for Feedforward Backpropagation Neural Networks`CNN/` - A library for Convolutional Neural Networks`DBN/` - A library for Deep Belief Networks`SAE/` - A library for Stacked Auto-Encoders`CAE/` - A library for Convolutional Auto-Encoders`util/` - Utility functions used by the libraries`data/` - Data used by the examples`tests/` - unit tests to verify toolbox is workingFor references on each library check REFS.mdSetup-----1. Download.2. addpath(genpath('DeepLearnToolbox'));Example: Deep Belief Network---------------------```matlabfunction test_example_DBNload mnist_uint8;train_x = double(train_x) / 255;test_x = double(test_x) / 255;train_y = double(train_y);test_y = double(test_y);%% ex1 train a 100 hidden unit RBM and visualize its weightsrand('state',0)dbn.sizes = [100];opts.numepochs = 1;opts.batchsize = 100;opts.momentum = 0;opts.alpha = 1;dbn = dbnsetup(dbn, train_x, opts);dbn = dbntrain(dbn, train_x, opts);figure; visualize(dbn.rbm{1}.W'); % Visualize the RBM weights%% ex2 train a 100-100 hidden unit DBN and use its weights to initialize a NNrand('state',0)%train dbndbn.sizes = [100 100];opts.numepochs = 1;opts.batchsize = 100;opts.momentum = 0;opts.alpha = 1;dbn = dbnsetup(dbn, train_x, opts);dbn = dbntrain(dbn, train_x, opts);%unfold dbn to nnnn = dbnunfoldtonn(dbn, 10);nn.activation_function = 'sigm';%train nnopts.numepochs = 1;opts.batchsize = 100;nn = nntrain(nn, train_x, train_y, opts);[er, bad] = nntest(nn, test_x, test_y);assert(er < 0.10, 'Too big error');```Example: Stacked Auto-Encoders---------------------```matlabfunction test_example_SAEload mnist_uint8;train_x = double(train_x)/255;test_x = double(test_x)/255;train_y = double(train_y);test_y = double(test_y);%% ex1 train a 100 hidden unit SDAE and use it to initialize a FFNN% Setup and train a stacked denoising autoencoder (SDAE)rand('state',0)sae = saesetup([784 100]);sae.ae{1}.activation_function = 'sigm';sae.ae{1}.learningRate = 1;sae.ae{1}.inputZeroMaskedFraction = 0.5;opts.numepochs = 1;opts.batchsize = 100;sae = saetrain(sae, train_x, opts);visualize(sae.ae{1}.W{1}(:,2:end)')% Use the SDAE to initialize a FFNNnn = nnsetup([784 100 10]);nn.activation_function = 'sigm';nn.learningRate = 1;nn.W{1} = sae.ae{1}.W{1};% Train the FFNNopts.numepochs = 1;opts.batchsize = 100;nn = nntrain(nn, train_x, train_y, opts);[er, bad] = nntest(nn, test_x, test_y);assert(er < 0.16, 'Too big error');```Example: Convolutional Neural Nets---------------------```matlabfunction test_example_CNNload mnist_uint8;train_x = double(reshape(train_x',28,28,60000))/255;test_x = double(reshape(test_x',28,28,10000))/255;train_y = double(train_y');test_y = double(test_y');%% ex1 Train a 6c-2s-12c-2s Convolutional neural network %will run 1 epoch in about 200 second and get around 11% error. %With 100 epochs you'll get around 1.2% errorrand('state',0)cnn.layers = { struct('type', 'i') %input layer struct('type', 'c', 'outputmaps', 6, 'kernelsize', 5) %convolution layer struct('type', 's', 'scale', 2) %sub sampling layer struct('type', 'c', 'outputmaps', 12, 'kernelsize', 5) %convolution layer struct('type', 's', 'scale', 2) %subsampling layer};cnn = cnnsetup(cnn, train_x, train_y);opts.alpha = 1;opts.batchsize = 50;opts.numepochs = 1;cnn = cnntrain(cnn, train_x, train_y, opts);[er, bad] = cnntest(cnn, test_x, test_y);%plot mean squared errorfigure; plot(cnn.rL);assert(er<0.12, 'Too big error');```Example: Neural Networks---------------------```matlabfunction test_example_NNload mnist_uint8;train_x = double(train_x) / 255;test_x = double(test_x) / 255;train_y = double(train_y);test_y = double(test_y);% normalize[train_x, mu, sigma] = zscore(train_x);test_x = normalize(test_x, mu, sigma);%% ex1 vanilla neural netrand('state',0)nn = nnsetup([784 100 10]);opts.numepochs = 1; % Number of full sweeps through dataopts.batchsize = 100; % Take a mean gradient step over this many samples[nn, L] = nntrain(nn, train_x, train_y, opts);[er, bad] = nntest(nn, test_x, test_y);assert(er < 0.08, 'Too big error');%% ex2 neural net with L2 weight decayrand('state',0)nn = nnsetup([784 100 10]);nn.weightPenaltyL2 = 1e-4; % L2 weight decayopts.numepochs = 1; % Number of full sweeps through dataopts.batchsize = 100; % Take a mean gradient step over this many samplesnn = nntrain(nn, train_x, train_y, opts);[er, bad] = nntest(nn, test_x, test_y);assert(er < 0.1, 'Too big error');%% ex3 neural net with dropoutrand('state',0)nn = nnsetup([784 100 10]);nn.dropoutFraction = 0.5; % Dropout fraction opts.numepochs = 1; % Number of full sweeps through dataopts.batchsize = 100; % Take a mean gradient step over this many samplesnn = nntrain(nn, train_x, train_y, opts);[er, bad] = nntest(nn, test_x, test_y);assert(er < 0.1, 'Too big error');%% ex4 neural net with sigmoid activation functionrand('state',0)nn = nnsetup([784 100 10]);nn.activation_function = 'sigm'; % Sigmoid activation functionnn.learningRate = 1; % Sigm require a lower learning rateopts.numepochs = 1; % Number of full sweeps through dataopts.batchsize = 100; % Take a mean gradient step over this many samplesnn = nntrain(nn, train_x, train_y, opts);[er, bad] = nntest(nn, test_x, test_y);assert(er < 0.1, 'Too big error');%% ex5 plotting functionalityrand('state',0)nn = nnsetup([784 20 10]);opts.numepochs = 5; % Number of full sweeps through datann.output = 'softmax'; % use softmax outputopts.batchsize = 1000; % Take a mean gradient step over this many samplesopts.plot = 1; % enable plottingnn = nntrain(nn, train_x, train_y, opts);[er, bad] = nntest(nn, test_x, test_y);assert(er < 0.1, 'Too big error');%% ex6 neural net with sigmoid activation and plotting of validation and training error% split training data into training and validation datavx = train_x(1:10000,:);tx = train_x(10001:end,:);vy = train_y(1:10000,:);ty = train_y(10001:end,:);rand('state',0)nn = nnsetup([784 20 10]); nn.output = 'softmax'; % use softmax outputopts.numepochs = 5; % Number of full sweeps through dataopts.batchsize = 1000; % Take a mean gradient step over this many samplesopts.plot = 1; % enable plottingnn = nntrain(nn, tx, ty, opts, vx, vy); % nntrain takes validation set as last two arguments (optionally)[er, bad] = nntest(nn, test_x, test_y);assert(er < 0.1, 'Too big error');```[![Bitdeli Badge](https://d2weczhvl823v0.cloudfront.net/rasmusbergpalm/deeplearntoolbox/trend.png)](https://bitdeli.com/free "Bitdeli Badge")

mapbox 开发笔记

mapbox 切换底图后图层消失?

GIS(地理信息系统) 1028

mapbox的初次笔记——wsdchong(转载)

mapbox的基本概念 文章目录 mapbox的基本概念 map的组成 style: Source: vector raster raster-dem geojson image video Layer: background fill line symbol raster API mapbox官网例子 styles:显示一个地图 layers:用3D形式呈现建筑物、可视化人口密度 sources:将本地json数据与矢量切片图形链接;添加实时数据、添加栅格切片数据源、添加一个第三方矢量切片数据源 优快云

Solomwn的博客 996

JSAPIThree 加载 Mapbox 数据学习笔记:使用 Mapbox 矢量瓦片地图

这是一篇关于 JSAPIThree(mapvthree)加载 Mapbox 数据的学习笔记,以初学者的视角记录如何配置 Mapbox AccessToken、加载 MVT 地图、自定义样式等功能的完整学习过程。

map_vis_3d的博客 859

Mapbox 笔记4(数据)

数据 使用 Tilequery API 创建一个健康食物查询器 要点 添加地理编码器 通过地理编码器查找周边符合条件的点数据 渲染查询后的数据点 使用 Mapbox GL JS 制作一张热力图 要点

hequhecong10857的博客 1023

mapbox地图字体替换笔记

mapbox本地字体部署

yangguangxiadewo的专栏 1105

Mapbox Android学习笔记 之 定位导航

准备工作 1.Mapbox 的账户和 access token(项目中需要用到) 2.一个包含了 Mapbox Android SDK 的安卓应用 安装导航SDK 在模块级别的 build.gradle 中添加依赖,如下: repositories { mavenCentral() maven { url 'https://mapbox.bintray.com/mapbox' } } d...

Test_tju的博客 4507
上一篇: 关于vue使用highcharts饼状图渐变色报错问题
下一篇: vite+vue3+ts框架搭建问题记录
评论
成就一亿技术人!
拼手气红包6.0元
还能输入1000个字符
 
 条评论被折叠 查看
添加红包

请填写红包祝福语或标题

个

红包个数最小为10个

元

红包金额最低5元

当前余额3.43元 前往充值 >
需支付:10.00元
成就一亿技术人!
领取后你会自动成为博主和红包主的粉丝 规则
hope_wisdom
发出的红包
实付元
使用余额支付
点击重新获取
扫码支付
钱包余额 0

抵扣说明:

1.余额是钱包充值的虚拟货币,按照1:1的比例进行支付金额的抵扣。
2.余额无法直接购买下载,可以购买VIP、付费专栏及课程。

余额充值