Jira workflow

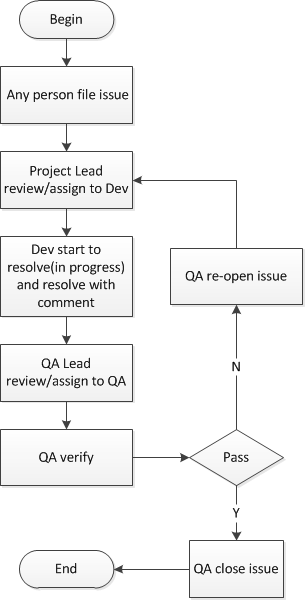
1. Allow all persons(PM, Sale, QA, Dev...) file issues(bug, new feature, task, improvement)

2. All issues new created assign to Project Lead or Component Lead automatically

3. Project Lead reviews all the issues(Priority, Fix Version, Duplicate) and assign to other devs with comments

4. Devs resolves issues assinged to himself by Project Lead, then the issue is automatically assinged to QA Lead with comments

5. QA Lead reviews the issues and assign to relevant QAs with comments

6. QA verifies the issues assigned to himself:

6.1 Close it if passed with comments

6.2 Re-open it if failed, and add comments, then the issue will be assigned to Project Lead automatically

7. Go to step 3 again

See chart below:

转载于:https://www.cnblogs.com/limei/archive/2012/01/14/2322390.html

在MATLAB中对数据进行多项式内插并绘制曲线图是数学建模和数据可视化的重要环节。《MATLAB曲线拟合与数据内插技术详解》将为你提供深入的技术解析和实战指导。 参考资源链接:[MATLAB曲线拟合与数据内插技术详解](https://wenku.youkuaiyun.com/doc/7rinsov8av?spm=1055.2569.3001.10343) 首先,你需要确保你的数据是散点形式,且已经导入MATLAB中。然后,使用MATLAB的interp1函数进行一维多项式内插。interp1函数能够根据一组已知的散点数据,估算出这些数据点之间的未知值。 假设你有一组一维散点数据x和y,你可以通过以下代码进行二次多项式内插: ```matlab x = [1, 2, 3, 4, 5]; % 已知的散点数据 y = [1, 4, 9, 16, 25]; % 已知的散点数据对应的函数值 % 使用interp1进行二次多项式内插 xx = linspace(min(x), max(x), 100); % 生成一个更密集的x轴数据点数组 yy = interp1(x, y, xx, 'poly', 2); % 'poly', 2指定二次多项式内插 % 绘制原始散点和内插后的平滑曲线 plot(x, y, 'o', xx, yy); % 使用'o'标记原始数据点 title('多项式内插曲线图'); xlabel('X轴'); ylabel('Y轴'); ``` 上述代码首先定义了原始散点数据x和y,然后使用interp1函数进行二次多项式内插,其中'poly', 2指定了多项式的阶数。最后,使用plot函数绘制出了原始散点以及通过内插得到的平滑曲线。 通过以上步骤,你可以在MATLAB中对散点数据进行多项式内插,并绘制出平滑的曲线图。为了进一步深入理解内插技术和曲线拟合,建议详细阅读《MATLAB曲线拟合与数据内插技术详解》,该资源不仅涵盖了基础概念,还包括高级技巧和案例研究,帮助你在数值分析和工程计算中达到新的高度。 参考资源链接:[MATLAB曲线拟合与数据内插技术详解](https://wenku.youkuaiyun.com/doc/7rinsov8av?spm=1055.2569.3001.10343)
评论
添加红包

请填写红包祝福语或标题

红包个数最小为10个

红包金额最低5元

当前余额3.43前往充值 >
需支付:10.00
成就一亿技术人!
领取后你会自动成为博主和红包主的粉丝 规则
hope_wisdom
发出的红包
实付
使用余额支付
点击重新获取
扫码支付
钱包余额 0

抵扣说明:

1.余额是钱包充值的虚拟货币,按照1:1的比例进行支付金额的抵扣。
2.余额无法直接购买下载,可以购买VIP、付费专栏及课程。

余额充值