


1 实验一
1.1 实验题目
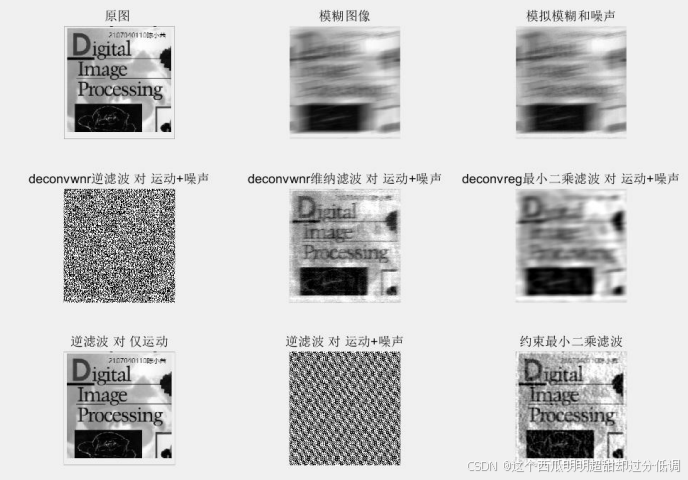
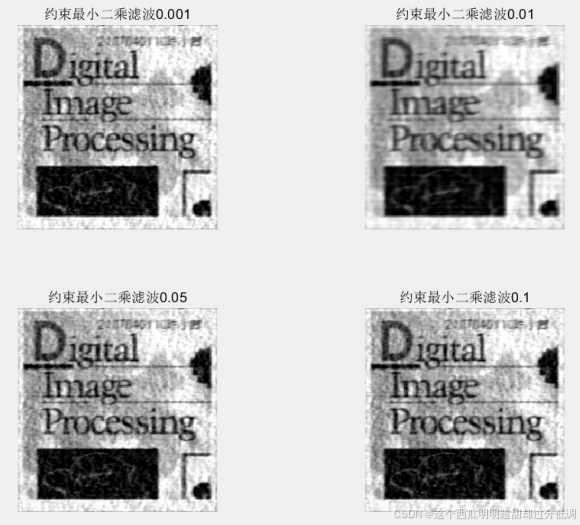
对经过大气湍流退化的图片实现全逆滤波复原、维纳滤波复原、约束最小二乘滤波复 原,并对比不同 k 值下的滤波效果。
1.2 程序源代码
% 逆滤波、维纳滤波,约束最小二乘滤波
close all;
clear all;
clc;
% 显示原始图像
I = imread('test1.png');
[d1,d2,d3] = size(I);
if(d3 > 1)
I = rgb2gray(I);
end
I = im2double(I);
[hei,wid,~] = size(I);
subplot(3,3,1),imshow(I);
title('原图 ');
%模拟运动模糊
LEN = 50;
THETA = 11;
PSF = fspecial('motion', LEN, THETA);
blurred = imfilter(I, PSF, 'conv', 'circular');
subplot(3,3,2), imshow(blurred); title('模糊图像');
% 模拟加性噪声
noise_mean = 0;
% noise_var = 0.00001;
noise_var = 0.0001;
blurred_noisy = imnoise(blurred, 'gaussian', ...
noise_mean, noise_var);
subplot(3,3,3), imshow(blurred_noisy)
title('模拟模糊和噪声')
%使用自带的 deconvwnr 进行维纳滤波。deconvreg 进行约束最小二乘滤波,deconvwnr维纳滤波,如果没有参数 NSPR,则为逆滤波
%自带逆滤波对已添加噪声图像 deconvwnr
deblurred4 = deconvwnr(blurred_noisy,PSF);
subplot(3,3,4), imshow(deblurred4); title('deconvwnr 逆滤波 对 运动+噪声')
%自带 维纳滤波 对已添加噪声图像 deconvwnr
deblurred4 = deconvwnr(blurred_noisy,PSF,0.005); %0.005 为噪声信号比
subplot(3,3,5), imshow(deblurred4); title('deconvwnr 维纳滤波对运动+噪声')
%自带的 deconvreg 进行约束最小二乘滤波
subplot(3,3,6);
imshow(deconvreg(blurred_noisy, PSF,20)); %20 为噪声功率
title('deconvreg 最小二乘滤波 对 运动+噪声');
% 自写逆滤波,约束最小二乘滤波
%自写 逆滤波 对未添加噪声图像
If = fft2(blurred);
Pf = psf2otf(PSF,[hei,wid]);
deblurred = ifft2(If./Pf);
subplot(3,3,7), imshow(deblurred); title('逆滤波 对 仅运动')
%自写 逆滤波 对已经添加噪声图像
If2 = fft2(blurred_noisy);
deblurred2 = ifft2(If2./Pf);
subplot(3,3,8), imshow(deblurred2); title('逆滤波 对 运动+噪声')
% Try restoration using Home Made Constrained Least Squares Filtering.
% 自写约束最小二乘滤波
p = [0 -1 0;-1 4 -1;0 -1 0];
P = psf2otf(p,[hei,wid]);
gama = 0.001;
If = fft2(blurred_noisy);
numerator = conj(Pf);
denominator = Pf.^2 + gama*(P.^2);
deblurred2 = ifft2( numerator.*If./ denominator );
subplot(3,3,9), imshow(deblurred2)
title('约束最小二乘滤波');
1.3 运行结果
约束最小二乘滤波不同 k 值下的滤波效:
2 实验二
2.1 实验题目
读入一幅房屋图像,分别利用 Sobel、Prewitt 提取边缘,观察二者提取边缘异同。
2.2 程序源代码
clear;clc;
I=imread('house.jpg');%读取图像
I=rgb2gray(I);%转换为灰度图像
imshow(I,[]);
title('Original Image');
%sobel 算法提取边缘
sobelBW=edge(I,'sobel');
figure;
imshow(sobelBW);
title('Sobel Edge');
%prewitt 算法提取边缘
prewittBW=edge(I,'prewitt');
figure;
imshow(prewittBW);
title('Prewitt Edge');
3 实验三
3.1 实验题目
对下图进行边缘检测、二值化、霍夫变换,以找到相关羽毛球场地线,给出中间结果。
3.2 程序源代码
clc;
close all;
clear all;
img = imread('edge.jpg'); % 读取图像
gray_img = rgb2gray(img); % 转换为灰度图像
edge_img = edge(gray_img, 'Canny'); % 使用 Canny 算子进行边缘检测
figure;
imshow(edge_img); % 显示边缘检测结果
title('边缘检测');
img = imread('edge.jpg'); % 读取图像
gray_img = rgb2gray(img); % 转换为灰度图像
binary_img = imbinarize(gray_img); % 将灰度图像转换为二值图像
figure;
imshow(binary_img); % 显示二值化结果
title('二值化');
img = imread('edge.jpg'); % 读取图像
gray_img = rgb2gray(img); % 转换为灰度图像
edge_img = edge(gray_img, 'Canny'); % 使用 Canny 算子进行边缘检测
[H,theta,rho] = hough(edge_img); % 进行霍夫变换,返回霍夫空间、角度、距离等
参数
peaks = houghpeaks(H,10); % 找到霍夫空间中的峰值点
lines = houghlines(edge_img,theta,rho,peaks); % 根据霍夫空间中的峰值点提取直线信息
figure;
imshow(img);
title('霍夫变换');
hold on;
for k = 1:length(lines)
xy = [lines(k).point1; lines(k).point2];
plot(xy(:,1),xy(:,2),'LineWidth',2,'Color','green');
% 绘制直线
end
hold off


 429
429

 被折叠的 条评论
为什么被折叠?
被折叠的 条评论
为什么被折叠?
 到【灌水乐园】发言


