


 PVS-Studio是一款静态代码分析器,用于检测C,C++,C#和Java应用程序中的错误和潜在漏洞。在Visual Studio中,它可以无缝集成并提供增量分析模式,帮助开发者在编码阶段就发现并修复问题,从而降低成本。此外,它支持从命令行检查项目,方便自动化分析,并提供误报抑制功能。PVS-Studio不仅适用于Windows平台,还支持Linux和macOS,以及Java和CMake的集成。
pvs-stdio ue4
Many of our articles are focused on anything, but not the PVS-Studio tool itself. Whereas we do a lot to make its usage convenient for developers. Nevertheless, our efforts are often concealed behind the scenes. I decided to remedy this situation and tell you about the PVS-Studio plugin for Visual Studio. If you use Visual Studio, this article is for you.
我们的许多文章都专注于任何内容,但不包括PVS-Studio工具本身。 尽管我们做了很多工作,以使开发人员可以方便地使用它。 但是,我们的努力常常被隐藏在幕后。 我决定纠正这种情况,并向您介绍有关Visual Studio的PVS-Studio插件。 如果您使用Visual Studio,则本文适合您。
什么是静态代码分析以及我们为什么需要它 (What is static code analysis and why we need it)
Static code analysis is the process of detecting errors and flaws in the source code of programs. Static analysis can be considered as a process of automated code review. Joint code review is a wonderful methodology. However, it has a significant drawback — high cost. It's necessary to gather several programmers to review newly written or rewritten code after the modifications made in it.
静态代码分析是检测程序源代码中的错误和缺陷的过程。 静态分析可以看作是自动代码审查的过程。 联合代码审查是一种很棒的方法。 但是,它有一个明显的缺点-高成本。 修改后,有必要召集几个程序员来审查新编写或重写的代码。
On the one hand, we want to review code regularly. On the other hand, it is too expensive. The compromise solution is static analysis tools. They earnestly analyze the source code of programs and give recommendations to programmers on reviewing certain code fragments. Of course, a program won't substitute a full-fledged code review, done by a team of developers. However, the ratio price/benefits makes the static analysis quite a useful practice, applied by many companies. If the reader is interested in precise numbers, I suggest you reading the article "PVS-Studio ROI".
一方面,我们希望定期检查代码。 另一方面,它太昂贵了。 折衷解决方案是静态分析工具。 他们认真地分析程序的源代码,并向程序员提出有关检查某些代码片段的建议。 当然,一个程序不会替代由一组开发人员完成的全面的代码审查。 但是,价格/收益比率使静态分析成为非常有用的实践,已被许多公司采用。 如果读者对精确数字感兴趣,建议您阅读文章“ PVS-Studio ROI ”。
There are many commercial and free static code analyzers. A large list of static analyzers is available on Wikipedia: List of tools for static code analysis. The list of languages for which there are static code analyzers is quite large (C, C++, C#, Java, Ada, Fortran, Perl, Ruby, ...). Needless to say, we will tell you about the PVS-Studio analyzer.
有许多商业和免费的静态代码分析器。 Wikipedia上提供了大量静态分析器: 静态代码分析工具列表 。 有静态代码分析器的语言列表非常多(C,C ++,C#,Java,Ada,Fortran,Perl,Ruby等)。 不用说,我们将向您介绍PVS-Studio 分析仪 。
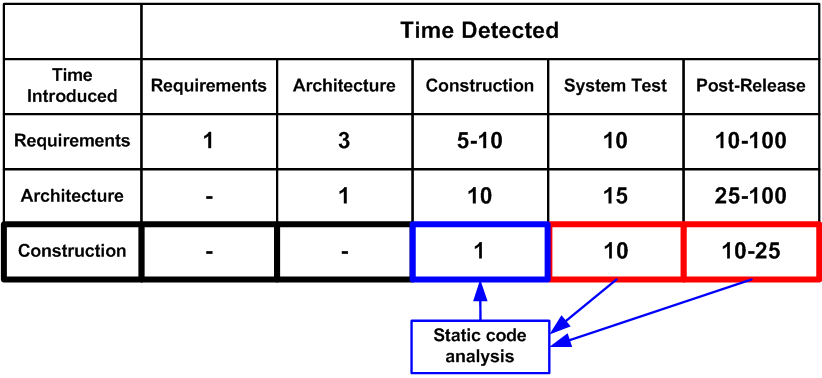
The main advantage of static code analysis is the opportunity to greatly reduce the cost of eliminating defects in a program. The earlier an error is detected, the less expensive it is to correct it. Thus, according to the book «Code Complete» by McConnell, error detection at the code testing stage is ten times more expensive than at the stage of code designing (coding):
静态代码分析的主要优点是可以大大降低消除程序缺陷的成本。 越早发现错误,纠正错误的成本就越低。 因此,根据麦康奈尔(McConnell)的《代码完成》(Code Complete)一书,在代码测试阶段进行错误检测比在代码设计(编码)阶段进行错误检测要贵十倍:
Static analysis tools allow detecting a large number of errors, typical for the stage of code designing, which significantly reduces the cost of the whole project development. For example, the PVS-Studio static code analyzer can be run in a background mode right after compilation and in case of finding potential errors will notify a programmer. More on this mode will be given below.
静态分析工具允许检测大量错误,这通常是代码设计阶段所要解决的,从而大大降低了整个项目开发的成本。 例如,PVS-Studio静态代码分析器可以在编译后立即在后台模式下运行,如果发现潜在错误,则会通知程序员。 有关此模式的更多信息,请参见下文。
PVS-Studio静态代码分析器 (PVS-Studio Static Code Analyzer)
PVS-Studio is a static analyzer that detects bugs and potential vulnerabilities in the source code of applications in C, C++ (other supported extensions: C++/CLI and C++/CX), C# and Java on Windows, Linux and macOS platforms. The analyzer is superbly integrated into the Visual Studio 2010 — 2019 and IntelliJ IDEA IDEs. In this article, we'll take a closer look at PVS-Studio, checking the code in C, C++, and C# languages. You can read about how to use PVS-Studio to check Java code in IntelliJ IDEA here.
PVS-Studio是一种静态分析器,可检测Windows,Linux和macOS平台上C,C ++(其他受支持的扩展: C ++ / CLI和C ++ / CX ),C#和Java中应用程序的源代码中的错误和潜在漏洞。 该分析仪已完美集成到Visual Studio 2010 — 2019和IntelliJ IDEA IDE中。 在本文中,我们将仔细研究PVS-Studio,检查C,C ++和C#语言的代码。 您可以在此处阅读有关如何在IntelliJ IDEA中使用PVS-Studio检查Java代码的信息 。
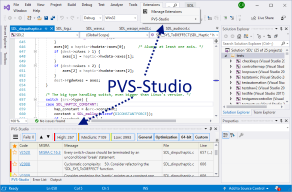
After PVS-Studio installation and its integration in Visual Studio, users get an additional item «PVS-Studio» in the main menu and the window for working with error messages:
在安装PVS-Studio并将其集成到Visual Studio中之后,用户会在主菜单和用于处理错误消息的窗口中获得一个附加项目“ PVS-Studio”:
初始设定 (Initial Settings)
The analyzer is ready to work right after installation. In most cases, you don't need to configure anything for the first run. The only setup you might need in the beginning is the exclusion of third-party libraries. You're not going to fix anything in the original files, for example, the jpeg library, so there's no need to check it. In addition, excluding of unnecessary folders will speed project analysis up. The directory's exceptions are set here: PVS-Studio > Options… > Don't Check Files > PathMasks (see Figure 3).
分析仪在安装后即可开始工作。 在大多数情况下,您无需为首次运行配置任何内容。 一开始您可能需要的唯一设置是排除第三方库。 您不会修复原始文件(例如jpeg库)中的任何内容,因此无需检查它。 此外,排除不必要的文件夹将加快项目分析的速度。 在此设置目录的例外:PVS-Studio>选项…>不要检查文件> PathMask(请参见图3)。
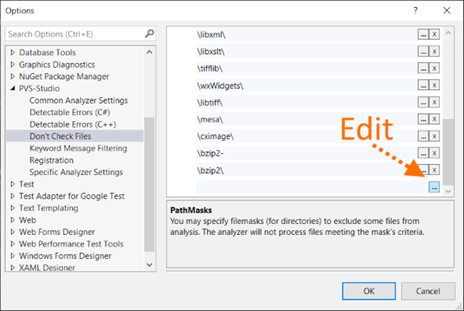
If in the full file name there is one of specified names, the analysis won't be performed for this file. By default, names of some directories are already included in the list. However, in your project, the directory with the ZLib library can be called not «zlib», but, for example, «zip_lib». Therefore, this list should be edited. To start editing, you need to click a button with three points.
如果完整文件名中包含指定的名称之一,则不会对此文件执行分析。 默认情况下,某些目录的名称已包含在列表中。 但是,在您的项目中,带有ZLib库的目录不能称为«zlib»,而可以称为«zip_lib»。 因此,应编辑此列表。 要开始编辑,您需要单击三个点的按钮。
Examples of acceptable masks for the PathMasks list:
PathMasks列表可接受的掩码的示例:
- c:\Libs\ — all files in this directory and its subdirectories will be excluded. c:\ Libs \-将排除此目录及其子目录中的所有文件。
- \Libs\ or *\Libs\* — all files in the directories, the path to which contains the subdirectory «Libs» will be excluded. If the symbols "*" aren't specified, they will be added automatically anyway, so both options are equal. \ Libs \或* \ Libs \ *-目录中所有文件,包含子目录«Libs»的路径将被排除。 如果未指定符号“ *”,则无论如何它们都会自动添加,因此两个选项相等。
- Libs or *Libs* — all files, the path to which contains the subdirectory, the name of which is equal to or contains 'Libs'. Also in this case all files, containing Libs in their name, for example, c:\project\mylibs.cpp, will be excluded. To avoid confusion, we recommend to always use slashes. Libs或* Libs *-所有文件,其路径包含子目录,该子目录的名称等于或包含'Libs'。 同样在这种情况下,所有名称中包含Lib的文件(例如c:\ project \ mylibs.cpp)也将被排除。 为避免混淆,我们建议始终使用斜杠。
In addition to excluding entire directories, you can set masks to exclude individual files. To do this, there is the setting FileNameMasks. Find out more about how to work with exception lists in the documentation: Settings: Don't Check Files.
除了排除整个目录外,您还可以设置掩码以排除单个文件。 为此,设置FileNameMasks。 在文档中找到有关如何使用异常列表的更多信息: 设置:不检查文件 。
项目检查 (Project Check)
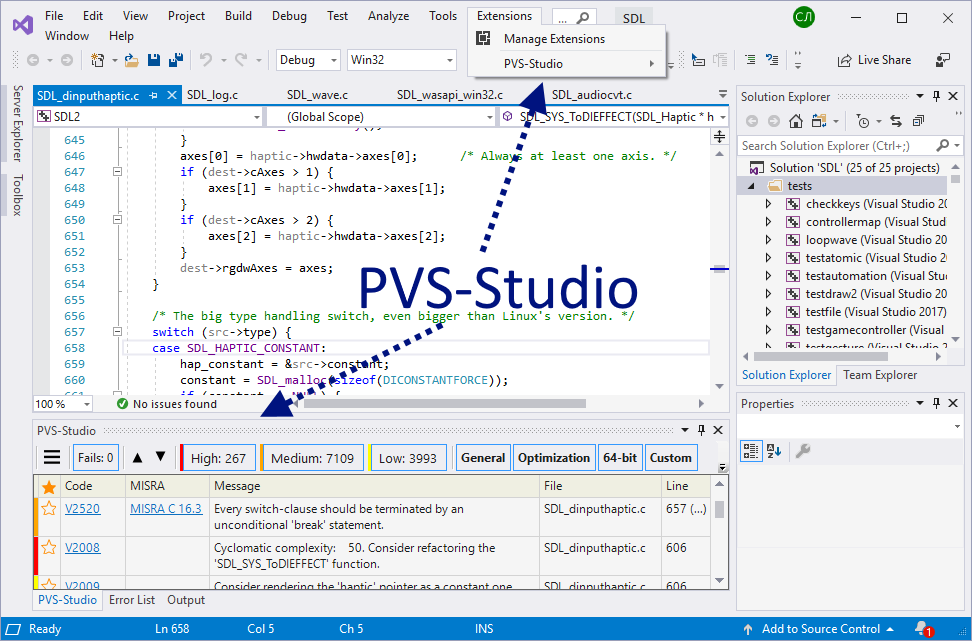
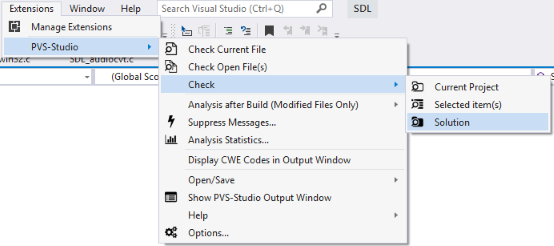
When you complete the initial settings, you can start checking the project. PVS-Studio for Visual Studio supports checking of C++ (.vcxproj) and C# (.csproj) projects. You can also immediately try to check the entire solution, which contains projects of these types. To do this, select the Extensions menu item Extensions > PVS-Studio > Check > Solution (See Figure 4).
完成初始设置后,即可开始检查项目。 PVS-Studio for Visual Studio支持检查C ++(.vcxproj)和C#(.csproj)项目。 您也可以立即尝试检查整个解决方案,其中包含这些类型的项目。 为此,选择扩展菜单项扩展> PVS-Studio>检查>解决方案(请参见图4)。
If there are some difficulties with the check, we recommend referring to the section "PVS-Studio: Troubleshooting" on our website. These are not stupid recommendations in the spirit of «check that the plug is inserted into the socket.» The section describes typical situations of users' requests and suggests options.
如果检查有困难,建议您参考我们网站上的“ PVS-Studio:故障排除 ”部分。 这些并不是“检查插头是否已插入插座”的愚蠢建议。 本节介绍了用户请求的典型情况并提出了一些建议。
使用诊断消息列表 (Working With a List of Diagnostic Messages)
After the check, all diagnostic messages will be displayed in a special window. The window has many control components. All of them serve to show exactly those diagnostic messages that are interesting to the user. However, at the first moment the window may seem complicated. Let's look at all control components (see Figure 5).
检查后,所有诊断消息将显示在特殊窗口中。 该窗口具有许多控制组件。 它们全部用于准确显示用户感兴趣的诊断消息。 但是,乍一看,窗口可能看起来很复杂。 让我们看一下所有控件组件(参见图5)。
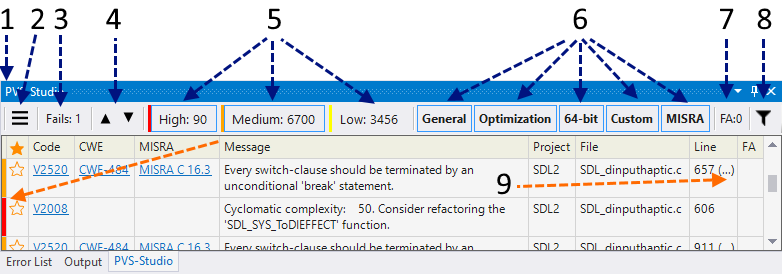
- Well, here is the PVS-Studio window. 好吧,这是PVS-Studio窗口。
- Additional menu. Allows you to access options such as marking warnings as false, hiding messages, adding files to exceptions (read about this below). 附加菜单。 允许您访问选项,例如将警告标记为false,隐藏消息,将文件添加到异常(请参阅以下内容)。
- The button enables messages «something went wrong.» For example, one of the files can't be preprocessed. 该按钮启用消息“出事了”。 例如,其中一个文件无法进行预处理。
Go to the previous/next message. This opens the relevant file and the cursor is placed on the line with a potential error. Also you can always select a diagnostic from the list with a double click. You can set hot keys for transitions to the previous/next message. By default, it's Alt+'[' and Alt+']'.
转到上一条/下一条消息。 这将打开相关文件,并将光标放在有潜在错误的行上。 同样,您始终可以双击双击列表中的诊断。 您可以设置用于切换到上一条/下一条消息的热键 。 默认情况下为Alt +'['和Alt +']'。
Buttons that include warnings of different levels. The first two diagnostic levels are now enabled. At the same time, the window shows 90 warnings of the first level, 6700 warning of the second level. The message level is shown on the left side of the window as a strip, corresponding to the strip color on the matching level button. Why are there so many triggerings? Why 6700 warnings? To demonstrate the abilities of the interface, a set of MISRA rules is enabled, which is inappropriate for regular applications :).
包含不同级别警告的按钮。 现在启用前两个诊断级别。 同时,该窗口显示第一级的90条警告,第二级的6700条警告。 消息级别在窗口左侧显示为条带,与匹配级别按钮上的条带颜色相对应。 为什么会有这么多触发因素? 为什么会有6700个警告? 为了演示该接口的功能,启用了一组MISRA规则,这不适用于常规应用程序:)。
- Active sets of diagnostic rules. General — general diagnostics, Optimization — micro-optimization, 64-bit — 64-bit diagnostics, MISRA — MISRA C and MISRA C++ standards diagnostics. All kinds of warnings are now displayed in the window. 活动的诊断规则集。 常规-常规诊断,优化-微优化,64位-64位诊断,MISRA-MISRA C和MISRA C ++标准诊断。 现在,所有警告都显示在窗口中。
- The indicator shows the number of warnings, marked as false (False Alarms). You can enable/disable display of marked messages in settings — PVS-Studio > Options… > Specific Analyzer Settings > Display False Alarms. 指示器显示警告数量,标记为“错误”(“错误警报”)。 您可以在设置中启用/禁用标记消息的显示— PVS-Studio>选项…>特定分析仪设置>显示错误警报。
- Quick filters. For example, you can shorten the list to only messages with V501 code and the ones in the XYZ project. 快速筛选。 例如,您可以将列表缩短为仅包含V501代码的消息以及XYZ项目中的消息。
- Some diagnostics suggest paying attention not to one, but several lines. In this case, dots appear next to the line number. Clicking on it, you can see the list of lines and choose one of them. 一些诊断建议不要将注意力放在某一行上,而应注意几行。 在这种情况下,行号旁边会出现点。 单击它,您可以看到行列表并选择其中之一。
The table with diagnostic messages is divided into the following columns:
带有诊断消息的表分为以下几列:
水平。 (Level. )
The level of certainty which indicates that an error, not a code smell was found. Level 1 (red) shows the most suspicious places. Level 3 (yellow) is probably a non-essential inaccuracy in the code.
确定性级别,表明发现了错误而不是代码气味。 级别1(红色)显示了最可疑的地方。 级别3(黄色)可能是代码中不必要的错误。
星。 (Star.)
It doesn't have a specific purpose. Users can interpret it as they wish. For example, a user can mark the most interesting warnings for further careful analysis. The analogy is the star mark of emails in mail clients like Thunderbird or Outlook.
它没有特定的目的。 用户可以根据需要对其进行解释。 例如,用户可以标记最有趣的警告以进行进一步的仔细分析。 类比是诸如Thunderbird或Outlook之类的邮件客户端中电子邮件的星级标记。
ID。 (ID.)
Unique message number. It can be useful when dealing with a large list. For example, you can go to a message with a specific number (see «Navigate to ID...» in the
唯一的消息号。 在处理大量列表时可能很有用。 例如,您可以转到带有特定号码的消息(请参阅“导航到ID ...”
context menu).上下文菜单 )。码 (Code)
. Message code. If you click on it, you'll open a page describing the warning.
。 消息代码。 如果单击它,将打开一个描述警告的页面。
CWE。 (CWE. )
Allows you to
让你
通过CWE(通用弱点枚举)代码identify a warning by the CWE (Common Weakness Enumeration) code. When you click on the link, you can see a description of this CWE in the network.识别警告。 单击链接时,您可以在网络中看到此CWE的描述。MISRA。 (MISRA. )
Same as above, but for the
与上述相同,但对于
MISRA standard.MISRA标准 。信息 (Message)
. The text of the diagnostic message.
。 诊断消息的文本。
项目 (Project)
. Project name (you can disable this column using a context menu).
。 项目名称(您可以使用上下文菜单禁用此列)。
文件 (File)
. File name.
。 文档名称。
线 (Line)
. Line number.
。 电话号码。
重要! (Important!)
Note that some lines end with dots. Example: «123 (...)». By clicking on this number, you'll get a list of all the lines of code that relate to this message. At the same time, you can go to each of the lines in the list.
请注意,有些线以点结尾。 例如:«123(...)»。 通过单击此数字,您将获得与此消息相关的所有代码行的列表。 同时,您可以转到列表中的每一行。
Yes, it was exhausting to read it all. However, I assure you, having started to use it, you will quickly get used to the tool. And you'll rarely click something to set up.
是的,阅读所有内容都很累。 但是,我向您保证,在开始使用它之后,您将很快习惯该工具。 而且,您很少会单击某些内容进行设置。
上下文菜单 (Context Menu)
So, by double clicking on the message, you go to the relevant piece of code. By the click of the right mouse button, the context menu opens.
因此,通过双击消息,您可以转到相关的代码段。 通过单击鼠标右键,上下文菜单打开。
The menu is quite simple, and I won't clutter the article with the description of each item. If something is not clear, you can look into the documentation.
菜单非常简单,我不会在每个项目的描述中弄乱文章。 如果不清楚,可以查看文档。
Nevertheless, I'd like to dwell on one very useful feature. Do you remember that in settings you can add folders/files to be excluded? The thing is that adding something is much simpler than it seems!
不过,我想谈谈一项非常有用的功能。 您还记得在设置中可以添加要排除的文件夹/文件吗? 事实是,添加东西比看起来要简单得多!
Pay attention to the menu option «Don't check files and hide all messages from...». When you click on it, you get a list of paths that you can add to the exceptions (see figure 6).
请注意菜单选项“不要检查文件并隐藏所有来自...的消息”。 当您单击它时,您将获得可以添加到异常的路径的列表(请参见图6)。
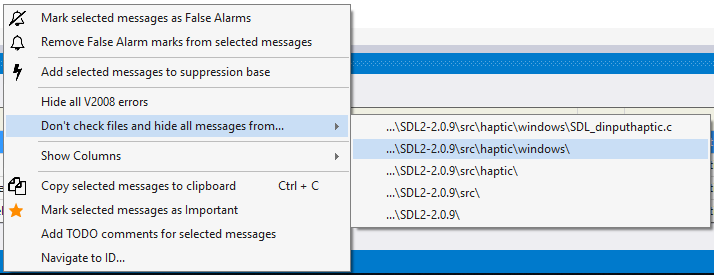
You can choose a separate file or one of the directories. The picture shows that the folder «SDL2-2.0.9\src\haptic\windows» is chosen. This means that all the files in this folder and all subfolders will be excluded from the analysis. What's more, all messages related to these files will disappear from the list immediately. Very convenient. You don't need to restart the analysis to remove all messages related to the tests.
您可以选择一个单独的文件或目录之一。 图片显示已选择文件夹“ SDL2-2.0.9 \ src \ haptic \ windows»。 这意味着该文件夹中的所有文件以及所有子文件夹都将从分析中排除。 此外,与这些文件相关的所有消息将立即从列表中消失。 很方便。 您无需重新启动分析即可删除与测试有关的所有消息。
增量分析模式 (Incremental Analysis Mode)
Introduction to PVS-Studio will be incomplete, if we conceal one of the most important features — incremental code analysis.
如果我们隐藏最重要的功能之一- 增量代码分析 ,那么PVS-Studio的介绍将是不完整的。
The earlier an error is detected, the less expensive it is to eliminate it. The best option is to highlight errors in the edited program text straight away. However, it is technically difficult and resource-intensive. That's why PVS-Studio runs in the background mode when the fixed code is successfully compiled. In so doing, you look for bugs in the code that has just been changed. The icon in the system notification area indicates that the analysis is running.
越早发现错误,消除错误的成本就越低。 最好的选择是立即突出显示已编辑程序文本中的错误。 然而,这在技术上是困难的并且是资源密集的。 因此,成功编译固定代码后,PVS-Studio在后台模式下运行。 这样,您可以在刚刚更改的代码中查找错误。 系统通知区域中的图标表示分析正在运行。
When an error is found, a pop-up window appears, warning of danger (see Figure 7).
发现错误后,将显示一个弹出窗口,警告危险(请参见图7)。
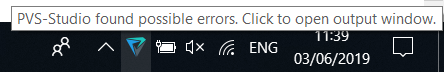
If you click on the icon, you will open the IDE with the result of the project check (see Figure 2) and you can dig into suspicious code fragments.
如果单击该图标,则将打开IDE,并带有项目检查的结果(请参见图2),然后可以挖掘可疑的代码片段。
In fact, it's easier to try working in this mode than to describe it. You write the code as before. When it is needed, the analyzer will disturb you. Give it a shot!
实际上,尝试以这种方式工作比描述它要容易。 您像以前一样编写代码。 需要时,分析仪会打扰您。 试一试!
We use this mode all the time. Yes, we also sometimes make coding errors. The ability to fix them immediately significantly reduces the time for detecting the defect and trying to understand why the program is not behaving as intended. It's very upsetting to spend 15-20 minutes debugging to eventually find a typo in the index. Here's one of the cases when PVS-Studio found an error in PVS-Studio right after it appeared in the code:
我们一直在使用此模式。 是的,我们有时还会出现编码错误。 立即修复它们的能力大大减少了检测缺陷和试图理解为什么程序表现不正常的时间。 花15到20分钟进行调试以最终在索引中找到一个错字是非常令人沮丧的。 这是在代码中出现PVS-Studio后立即在PVS-Studio中发现错误的情况之一:
if (in[0] == '\\' && in[1] == '.' && in[1] == '\\')
{
  in += 2;
  continue;
}
Well, the most interesting is yet to come. The PVS-Studio analyzer can sometimes be much more useful than this. Here's one of the reviews about our analyzer: "A User's Experience of Working with the Analyzer". The text makes me wonder.
好吧,最有趣的还没到。 PVS-Studio分析仪有时可能比这有用得多。 这是关于我们的分析仪的评论之一:“ 用户使用分析仪的体验 ”。 文字使我感到奇怪。
Let me sum it up. Incremental analysis is something you should definitely try. You'll love it as soon as you find a couple of blunders in the fresh code.
让我总结一下。 绝对应该尝试增量分析。 在新的代码中发现一些错误后,您就会爱上它。
PVS-Studio功能 (PVS-Studio Capabilities)
Let's be brief. It is impossible to succinctly describe all the diagnostics that are available in PVS-Studio. A full list of diagnostics and their detailed description can be found in the documentation: Description of detected bugs. Let's settle upon the table in which diagnostics are grouped by type. Some diagnostics are in more than one group. The fact is that classification is quite formal. For example, a typo can result in the use of uninitialized memory. Some of the errors, on the contrary, couldn't fit any of the groups, because they were too specific. Nevertheless, this table gives the insight about the functional of the static code analyzer.
简而言之。 简明扼要地描述PVS-Studio中可用的所有诊断程序是不可能的。 诊断的完整列表及其详细描述可在文档中找到: 检测到的错误的描述 。 我们来看一下按类型对诊断进行分组的表。 一些诊断程序不止一组。 事实是分类是非常正式的。 例如,一个错字可能会导致使用未初始化的内存。 相反,某些错误可能不适合任何一个组,因为它们太具体了。 但是,此表提供了有关静态代码分析器功能的见解。
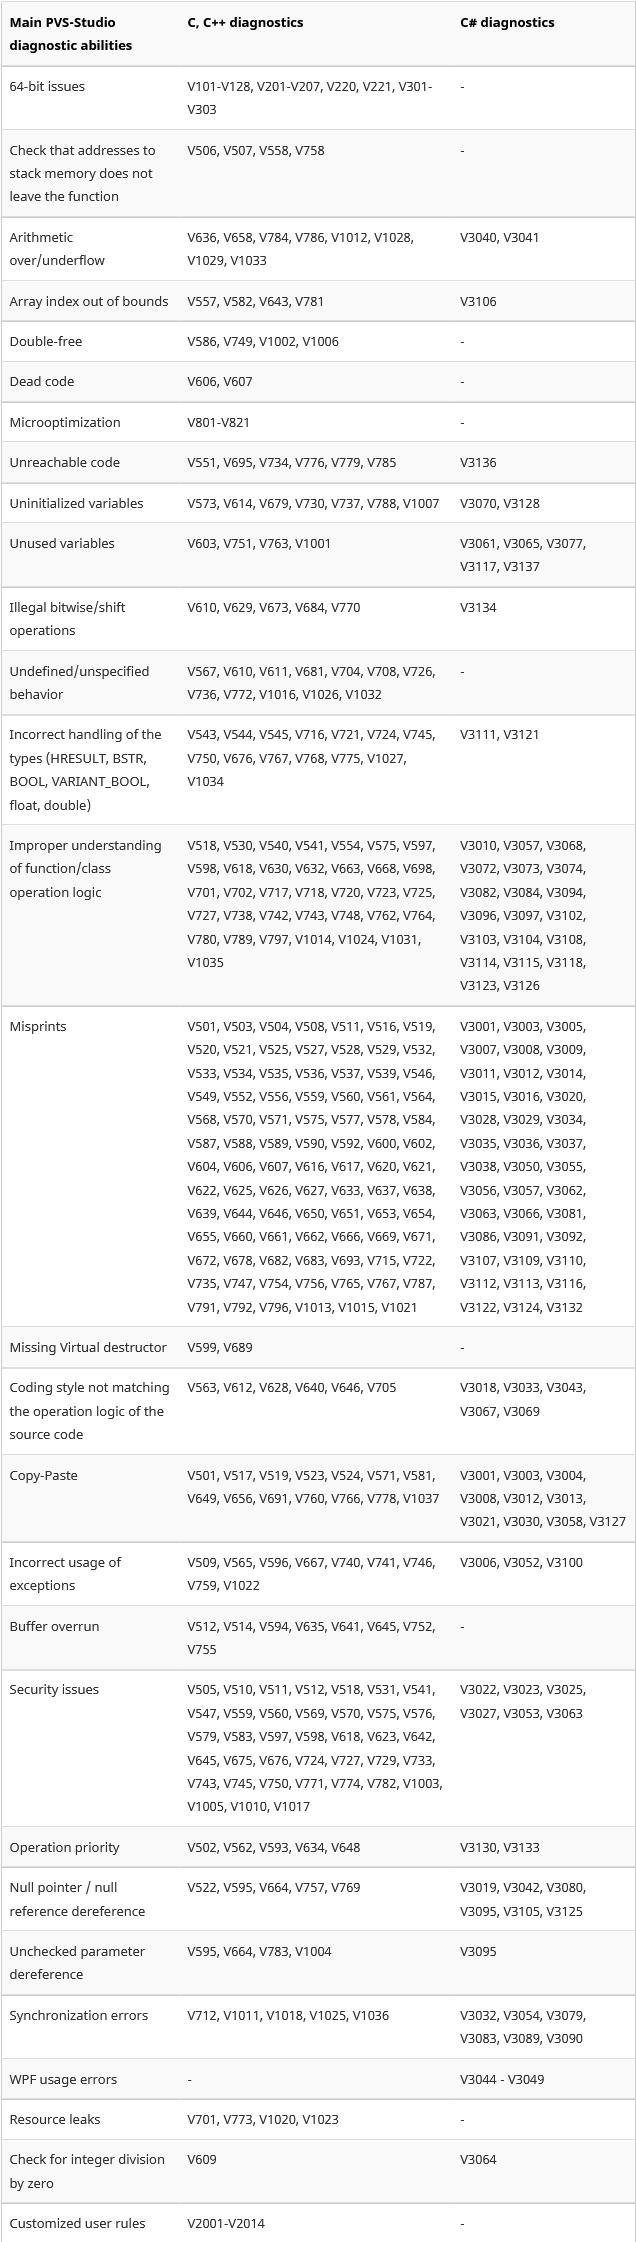
As you see, the analyzer is especially useful is such areas as looking for Copy-Paste bugs. It's great at detecting problems related to code security.
如您所见,分析器在寻找复制粘贴错误等领域特别有用。 它非常适合检测与代码安全性相关的问题。
To see these diagnostics in action, have a look at the error base. We collect all the errors that we've found, checking various open source projects with PVS-Studio.
要查看运行中的这些诊断,请查看错误基准 。 我们收集发现的所有错误,并使用PVS-Studio检查各种开源项目。
SAST (SAST)
PVS-Studio is a static application security testing tool. The analyzer can detect potential vulnerabilities in the project's code and show the appropriate error identifier in a certain classification.
PVS-Studio是静态应用程序安全性测试工具。 分析器可以检测项目代码中的潜在漏洞,并在特定分类中显示适当的错误标识符。
PVS-Studio supports the following error classifications:
PVS-Studio支持以下错误分类:
- CWE CWE
- SEI CERT SEI证书
- MISRA MISRA
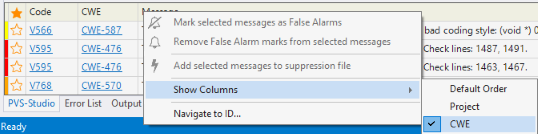
You can enable display of CWE codes by the context menu in the analyzer window by the path Show Columns > CWE
您可以通过分析器窗口中的上下文菜单,通过显示列> CWE路径启用CWE代码显示
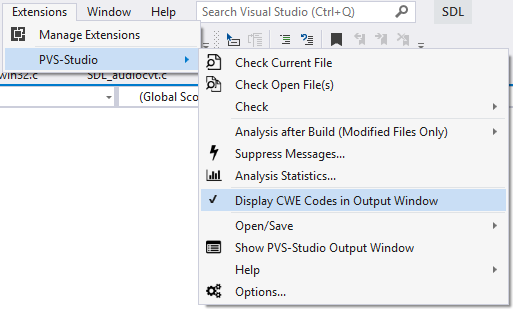
Or in the main menu (Extensions > PVS-Studio > Display CWE Codes in Output Window)
或在主菜单中(扩展> PVS-Studio>在“输出”窗口中显示CWE代码)
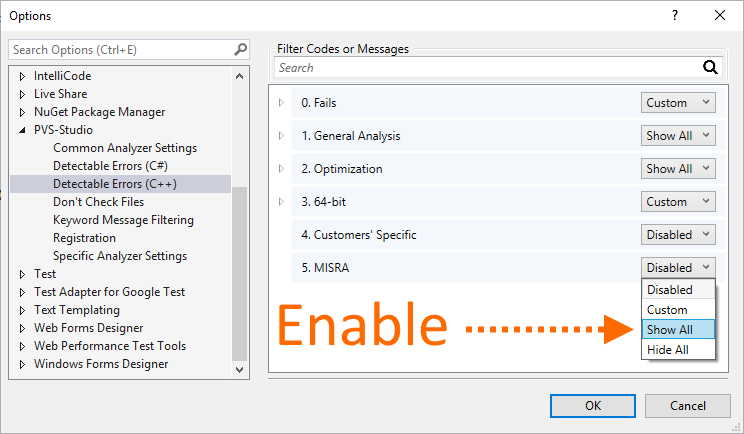
MISRA diagnostics are enabled separately in the settings:
MISRA诊断在设置中分别启用:
You can read more about these classifications here.
您可以在此处阅读有关这些分类的更多信息。
从命令行检查项目 (Checking Projects From the Command Line)
PVS-Studio_Cmd.exe — a utility for checking C++/C# Visual Studio projects (.vcxproj/.csproj) and .sln solutions from the command line. It can be useful to automate the analysis. The program is in the directory where the installation was made — by default it is 'C:\Program Files (x86)\PVS-Studio'.
PVS-Studio_Cmd.exe —用于从命令行检查C ++ / C#Visual Studio项目(.vcxproj / .csproj)和.sln解决方案的实用程序。 自动化分析可能很有用。 该程序位于进行安装的目录中-默认情况下为“ C:\ Program Files(x86)\ PVS-Studio”。
The program has many parameters, but first we need only 3 of them:
该程序有很多参数 ,但是首先我们只需要其中三个:
- --target: project or solution file that needs to be checked. --target:需要检查的项目或解决方案文件。
- --output: plog file where the report needs to be written. --output:需要在其中写入报告的plog文件。
- --progress: show progress of a check. --progress:显示检查进度。
Here's what the run will look like:
运行结果如下所示:
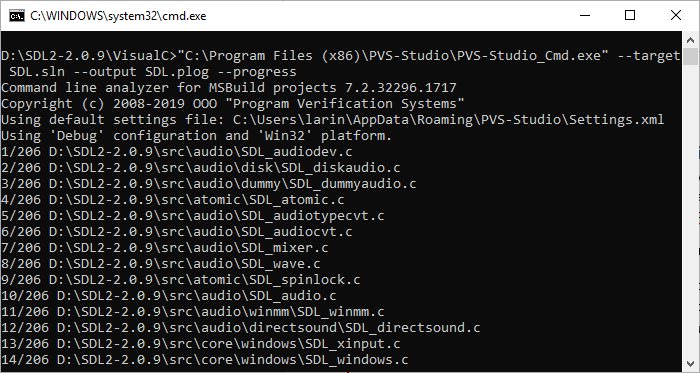
After running we'll get a plog file with a report, a path to which we specified in the running options. You can convert this report in other formats using the PlogConverter.exe utility. To view the report in IDE, double click a plog file in the finder.
运行之后,我们将获得一个带有报告的plog文件,该报告是我们在运行选项中指定的路径。 您可以使用PlogConverter.exe实用程序将该报告转换为其他格式。 要在IDE中查看报告,请在查找器中双击一个plog文件。
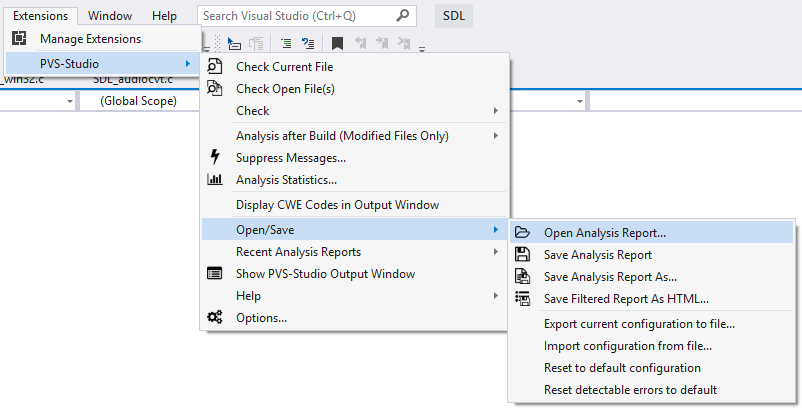
Also you can open the report file in the extension menu by the path Extensions > PVS-Studio > Open/Save > Open Analysis Report…
您也可以通过扩展> PVS-Studio>打开/保存>打开分析报告…的路径在扩展菜单中打开报告文件。
Detailed information on the utility and its parameters can be found in the documentation.
有关实用程序及其参数的详细信息可以在文档中找到。
误报抑制 (False Positives Suppression)
Some messages issued by the analyzer will inevitably be false. There's nothing we can do about it. A static analyzer is just a program that doesn't have artificial intelligence and can't pinpoint whether it's a real bug or not.
分析仪发出的某些消息不可避免地会是错误的。 我们对此无能为力。 静态分析器只是一个没有人工智能的程序,无法查明它是否是真正的错误。
To fight against false positives, the analyzer provides a set of different mechanisms. They are detailed in the following sections of documentation:
为了对抗误报,分析仪提供了一组不同的机制。 在文档的以下各节中将对它们进行详细说明:
微调 。
A rough method that only allows you to work with warnings related to new or modified code.
一种粗略的方法,仅允许您使用与新代码或已修改代码有关的警告。
结论 (Conclusion)
Of course, we didn't tell you everything about the tool. If I you tell everything, the article will turn into documentation. The aim was to show how easy it is to work with the tool within the Visual Studio environment. You can read about other environments and modes of work in the documentation and other articles on our website. There are a lot of interesting things for programmers, by the way. Come and hang around.
当然,我们并没有告诉您有关该工具的所有信息。 如果我告诉您所有内容,那么本文将变成文档。 目的是说明在Visual Studio环境中使用该工具有多么容易。 您可以在我们网站上的文档和其他文章中了解其他环境和工作方式。 顺便说一下,程序员有很多有趣的事情。 过来闲逛。
It's worth noting that PVS-Studio doesn't just work in Microsoft environment. We also support the Java language, we can work on Linux and macOS, integrate into CMake and much more. You can find out more in the documentation.
值得注意的是,PVS-Studio不仅可以在Microsoft环境中运行。 我们还支持Java语言,我们可以在Linux和macOS上工作,可以集成到CMake中等等。 您可以在文档中找到更多信息 。
I wish you bugless bad code and hope you'll enjoy PVS-Studio. If there are any questions, we will always help and give advice. Write to us.
祝您没有错误的错误代码,并希望您喜欢PVS-Studio。 如有任何疑问,我们将始终提供帮助并提供建议。 写信给我们 。
附加链接: (Additional links:)
代码审查 。
静态代码分析 。
静态代码分析工具 。
SAST.
SAST 。
Download and try PVS-Studio.
下载并尝试使用PVS-Studio。
Discuss the price of the PVS-Studio analyzer for you team and how to purchase it: buy PVS-Studio.
为您的团队讨论PVS-Studio分析仪的价格以及如何购买: 购买PVS-Studio 。
Answers to questions that are often asked at conferences.
回答会议上经常提出的问题。
pvs-stdio ue4


 1233
1233

 被折叠的 条评论
为什么被折叠?
被折叠的 条评论
为什么被折叠?
 到【灌水乐园】发言


