


 本文详细探讨了PostgreSQL中的缓冲区高速缓存机制,解释了其在提高数据库性能方面的作用,以及如何通过调整配置参数优化缓存大小。文章还介绍了预写日志(WAL)的概念,以及在数据库恢复中的关键作用。
This series will consist of four parts:
本系列将包括四个部分:
- Buffer cache (this article). 缓冲区缓存(本文)。
Write-ahead log — how it is structured and used to recover the data.
预写日志 -它的结构和用于恢复数据的方式。
Checkpoint and background writer — why we need them and how we set them up.
检查点和后台作者 -我们为什么需要它们以及如何设置它们。
WAL setup and tuning — levels and problems solved, reliability, and performance.
WAL设置和调整 -解决的级别和问题,可靠性和性能。
为什么我们需要预写日志记录? (Why do we need write-ahead logging?)
Part of the data that a DBMS works with is stored in RAM and gets written to disk (or other nonvolatile storage) asynchronously, i. e., writes are postponed for some time. The more infrequently this happens the less is the input/output and the faster the system operates.
DBMS处理的部分数据存储在RAM中,并异步写入磁盘(或其他非易失性存储)中,即 e。写延迟了一段时间。 这种情况发生的频率越低,输入/输出越少,系统运行越快。
But what will happen in case of failure, for example, power outage or an error in the code of the DBMS or operating system? All the contents of RAM will be lost, and only data written to disk will survive (disks are not immune to certain failures either, and only a backup copy can help if data on disk are affected). In general, it is possible to organize input/output in such a way that data on disk are always consistent, but this is complicated and not that much efficient (to my knowledge, only Firebird chose this option).
但是,如果发生故障(例如断电或DBMS或操作系统的代码错误),会发生什么? RAM的所有内容都会丢失,只有写入磁盘的数据才能幸存(磁盘也无法幸免于某些故障,如果磁盘上的数据受到影响,则只有备份副本可以提供帮助)。 通常,可以以磁盘上的数据始终保持一致的方式来组织输入/输出,但这很复杂且效率不高(据我所知,只有Firebird选择了此选项)。
Usually, and specifically in PostgreSQL, data written to disk appear to be inconsistent, and when recovering after failure, special actions are required to restore data consistency. Write-ahead logging (WAL) is just a feature that makes it possible.
通常,尤其是在PostgreSQL中,写入磁盘的数据似乎不一致,并且在故障后恢复时,需要采取特殊措施来恢复数据一致性。 预写日志记录(WAL)只是一项使之成为可能的功能。
缓冲区缓存 (Buffer cache)
Oddly enough, we will start a talk on WAL with discussing the buffer cache. The buffer cache is not the only structure that is stored in RAM, but one of the most critical and complicated of them. Understanding how it works is important in itself; besides we will use it as an example in order to get acquainted with how RAM and disk exchange data.
奇怪的是,我们将在WAL上开始讨论缓冲缓存。 缓冲区高速缓存不是存储在RAM中的唯一结构,而是其中最关键和最复杂的结构之一。 理解其工作原理本身很重要; 此外,我们将以它为例以熟悉RAM和磁盘如何交换数据。
Caching is used in modern computer systems everywhere; a processor alone has three or four levels of cache. In general cache is needed to alleviate the difference in the performances between two kinds of memory, of which one is relatively fast, but there is not enough of it to go round, and the other one is relatively slow, but there is quite enough of it. And the buffer cache alleviates the difference between the time of access to RAM (nanoseconds) and disk storage (milliseconds).
缓存在现代计算机系统中无处不在。 一个处理器仅具有三级或四级缓存。 通常,需要缓存来减轻两种内存之间的性能差异,其中一种相对较快,但是循环不足,另一种相对较慢,但是足够多它。 缓冲区缓存减轻了访问RAM的时间(纳秒)和磁盘存储的时间(毫秒)之间的差异。
Note that the operating system also has the disk cache that solves the same problem. Therefore, database management systems usually try to avoid double caching by accessing disks directly rather than through the OS cache. But this is not the case with PostgreSQL: all data are read and written using normal file operations.
请注意,操作系统还具有解决相同问题的磁盘缓存。 因此,数据库管理系统通常尝试通过直接访问磁盘而不是通过OS缓存来避免双重缓存。 但是PostgreSQL并非如此:所有数据都是使用常规文件操作读取和写入的。
Besides, controllers of disk arrays and even disks themselves also have their own cache. This will come in useful when we reach a discussion of reliability.
此外,磁盘阵列的控制器甚至磁盘本身也具有自己的缓存。 当我们讨论可靠性时,这将很有用。
But let's return to the DBMS buffer cache.
但是,让我们回到DBMS缓冲区高速缓存。
It is called like this because it is represented as an array of buffers. Each buffer consists of space for one data page (block) plus the header. The header, among the rest, contains:
之所以这样称呼它是因为它表示为一个缓冲区数组。 每个缓冲区由一个数据页(块)的空间和标题组成。 标题中的其余部分包含:
- The location of the page in the buffer (the file and block number there). 页面在缓冲区中的位置(文件和块号在那里)。
The indicator of a change to the data on the page, which will sooner or later need to be written to disk (such a buffer is called dirty).
页面上的数据更改的指示符,迟早需要将其写入磁盘(这样的缓冲区称为dirty )。
- The usage count of the buffer. 缓冲区的使用计数。
- The pin count of the buffer. 缓冲区的引脚数。
The buffer cache is located in the shared memory of the server and is accessible to all processes. To work with data, that is, read or update them, the processes read pages into the cache. While the page is in the cache, we work with it in RAM and save on disk accesses.
缓冲区高速缓存位于服务器的共享内存中,并且所有进程均可访问。 为了处理数据,即读取或更新数据,进程将页面读入缓存。 当页面位于缓存中时,我们在RAM中使用它并保存对磁盘的访问。
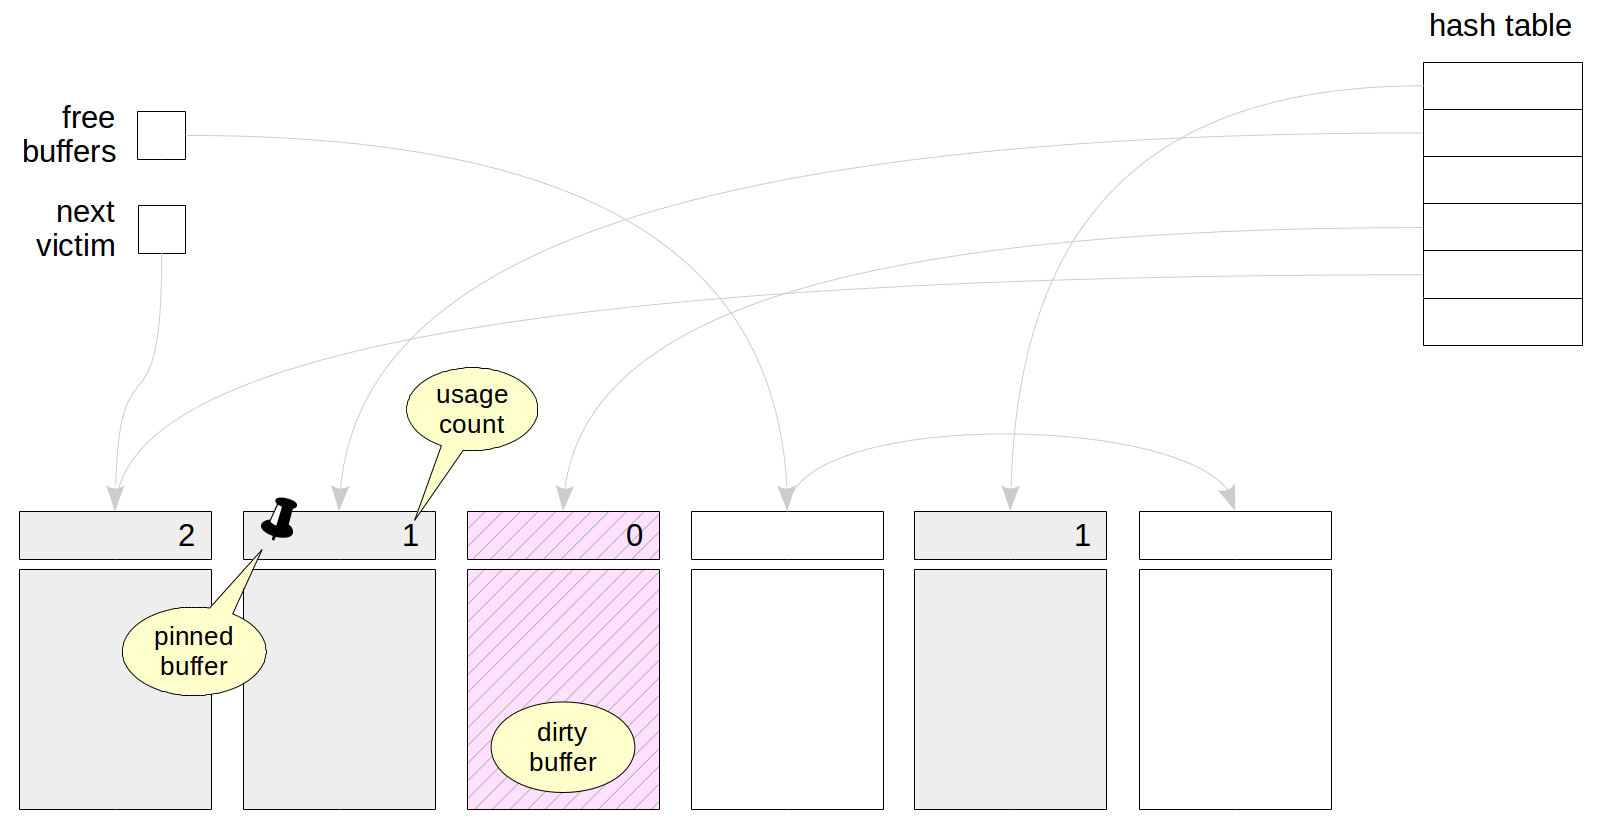
The cache initially contains empty buffers, and all of them are chained into the list of free buffers. The meaning of the pointer to the «next victim» will be clear a bit later. A hash table in the cache is used to quickly find there a page you need.
缓存最初包含空缓冲区,并且所有缓冲区都链接到空闲缓冲区列表中。 指向“下一个受害者”的指针的含义稍后会清楚。 缓存中的哈希表用于快速找到所需页面。
在缓存中搜索页面 (Search for a page in the cache)
When a process needs to read a page, it first attempts to find it in the buffer cache by means of the hash table. The file number and the number of the page in the file are used as the hash key. The process finds the buffer number in the appropriate hash bucket and checks whether it really contains the page needed. Like with any hash table, collisions may arise here, in which case the process will have to check several pages.
当进程需要读取页面时,它首先尝试通过哈希表在缓冲区高速缓存中找到它。 文件编号和文件中的页面编号用作哈希键。 该过程在适当的哈希存储桶中找到缓冲区编号,并检查它是否确实包含所需的页面。 像任何哈希表一样,此处可能会发生冲突,在这种情况下,该过程将不得不检查多个页面。
If the page needed is found in the cache, the process must «pin» the buffer by incrementing the pin count (several processes can concurrently do this). While a buffer is pinned (the count value is greater than zero), it is considered to be used and to have contents that cannot «drastically» change. For example: a new tuple can appear on the page — this does no harm to anybody because of multiversion concurrency and visibility rules. But a different page cannot be read into the pinned buffer.
如果在高速缓存中找到所需的页,则该过程必须通过增加引脚数来“固定”缓冲区(多个进程可以同时执行此操作)。 固定缓冲区(计数值大于零)时,它被认为是已使用并且具有无法“急剧”更改的内容。 例如:一个新的元组可以出现在页面上-由于多版本并发和可见性规则,这对任何人都无害。 但是无法将其他页面读入固定缓冲区。
驱逐 (Eviction)
It may so happen that the page needed will not be found in the cache. In this case, the page will need to be read from disk into some buffer.
可能发生这种情况,导致在缓存中找不到所需的页面。 在这种情况下,需要将页面从磁盘读取到某个缓冲区中。
If empty buffers are still available in the cache, the first empty one is chosen. But they will be over sooner or later (the size of a database is usually larger than the memory allocated for the cache), and then we will have to choose one of the occupied buffers, evict the page located there and read the new one into the freed space.
如果缓存中仍然有空缓冲区,则选择第一个空缓冲区。 但是它们迟早会结束(数据库的大小通常大于为缓存分配的内存),然后我们将不得不选择其中一个占用的缓冲区,逐出位于该处的页面并将新的缓冲区读入释放的空间。
The eviction technique is based on the fact that for each access to a buffer, processes increment the usage count in the buffer header. So the buffers that are used less often than the others have a smaller value of the count and are therefore good candidates for eviction.
逐出技术基于以下事实:对于缓冲区的每次访问,进程都会增加缓冲区头中的使用计数。 因此,比其他缓冲区少使用的缓冲区具有较小的计数值,因此是驱逐的良好候选对象。
The clock-sweep algorithm circularly goes through all buffers (using the pointer to the «next victim») and decreases their usage counts by one. The buffer that is selected for eviction is the first one that:
时钟扫描算法循环遍历所有缓冲区(使用指向“下一个受害者”的指针),并将其使用计数减一。 选择用于驱逐的缓冲区是第一个缓冲区:
- has a zero usage count 使用计数为零
- has a zero pin count (i. e. is not pinned) 引脚数为零(即未固定)
Note that if all buffers have a non-zero usage count, the algorithm will have to do more than one circle through the buffers, decreasing the values of counts until some of them is reduced to zero. For the algorithm to avoid «doing laps», the maximum value of the usage count is limited by 5. However, for a large-size buffer cache, this algorithm can cause considerable overhead costs.
请注意,如果所有缓冲区的使用计数都为非零,则算法将不得不对缓冲区进行一个以上的循环,从而减小计数值,直到其中一些计数减小为零为止。 为了避免“做圈”的算法,使用次数的最大值受到5的限制。但是,对于大型缓冲区高速缓存,此算法会导致可观的开销成本。
Once the buffer is found, the following happens to it.
一旦找到缓冲区,就会发生以下情况。
The buffer is pinned to show other processes that it is used. Other locking techniques are used, in addition to pinning, but we will discuss this in more detail later.
缓冲区被固定以显示其使用的其他进程。 除了固定以外,还使用了其他锁定技术,但是稍后我们将对其进行详细讨论。
If the buffer appears to be dirty, that is, to contain changed data, the page cannot be just dropped — it needs to be saved to disk first. This is hardly a good situation since the process that is going to read the page has to wait until other processes' data are written, but this effect is alleviated by checkpoint and background writer processes, which will be discussed later.
如果缓冲区看起来很脏,即包含更改的数据,则不能仅删除该页面-需要先将其保存到磁盘。 由于要读取页面的进程必须等到其他进程的数据写入后才出现这种情况,所以这种情况很难过,但是检查点和后台编写器进程会减轻这种影响,这将在后面进行讨论。
Then the new page is read from disk into the selected buffer. The usage count is set equal to one. Besides, a reference to the loaded page must be written to the hash table in order to enable finding the page in future.
然后,将新页从磁盘读取到所选缓冲区中。 使用计数设置为等于1。 此外,必须将对已加载页面的引用写入哈希表,以便将来能够找到该页面。
The reference to the «next victim» now points to the next buffer, and the just loaded buffer has time to increase the usage count until the pointer goes circularly through the entire buffer cache and is back again.
现在,对“下一个受害者”的引用指向下一个缓冲区,并且刚加载的缓冲区有时间增加使用计数,直到指针循环遍历整个缓冲区高速缓存并再次返回为止。
自己看看 (See it for yourself)
As usual, PostgreSQL has an extension that enables us to look inside the buffer cache.
像往常一样,PostgreSQL有一个扩展,使我们能够查看缓冲区高速缓存的内部。
=> CREATE EXTENSION pg_buffercache;Let's create a table and insert one row there.
让我们创建一个表并在其中插入一行。
=> CREATE TABLE cacheme(
  id integer
) WITH (autovacuum_enabled = off);
=> INSERT INTO cacheme VALUES (1);
What will the buffer cache contain? At a minimum, there must appear the page where the only row is added. Let's check this using the following query, which selects only buffers related to our table (by the relfilenode number) and interprets relforknumber:
缓冲区高速缓存将包含什么? 至少必须出现添加唯一行的页面。 让我们使用以下查询进行检查,该查询仅选择与表相关的缓冲区(通过relfilenode号)并解释relforknumber :
=> SELECT bufferid,
  CASE relforknumber
    WHEN 0 THEN 'main'
    WHEN 1 THEN 'fsm'
    WHEN 2 THEN 'vm'
  END relfork,
  relblocknumber,
  isdirty,
  usagecount,
  pinning_backends
FROM pg_buffercache
WHERE relfilenode = pg_relation_filenode('cacheme'::regclass);
bufferid | relfork | relblocknumber | isdirty | usagecount | pinning_backends
----------+---------+----------------+---------+------------+------------------
15735 | main | 0 | t | 1 | 0
(1 row) Just as we thought: the buffer contains one page. It is dirty (isdirty), the usage count (usagecount) equals one, and the page is not pinned by any process (pinning_backends).
正如我们所想:缓冲区包含一页。 它是脏的( isdirty ),使用计数( usagecount )等于1,并且该页面未由任何进程固定( pinning_backends )。
Now let's add one more row and rerun the query. To save keystrokes, we insert the row in another session and rerun the long query using the \g command.
现在,让我们再添加一行并重新运行查询。 为了保存击键,我们将行插入另一个会话中,然后使用\g命令重新运行长查询。
| => INSERT INTO cacheme VALUES (2);=> \gbufferid | relfork | relblocknumber | isdirty | usagecount | pinning_backends
----------+---------+----------------+---------+------------+------------------
15735 | main | 0 | t | 2 | 0
(1 row)No new buffers were added: the second row fit on the same page. Pay attention to the increased usage count.
没有添加新的缓冲区:第二行适合同一页面。 请注意增加的使用数量。
| => SELECT * FROM cacheme;| id
| ----
| 1
| 2
| (2 rows)=> \gbufferid | relfork | relblocknumber | isdirty | usagecount | pinning_backends
----------+---------+----------------+---------+------------+------------------
15735 | main | 0 | t | 3 | 0
(1 row)The count also increases after reading the page.
阅读页面后,计数也会增加。
But what if we do vacuuming?
但是,如果我们做吸尘怎么办?
| => VACUUM cacheme;=> \gbufferid | relfork | relblocknumber | isdirty | usagecount | pinning_backends
----------+---------+----------------+---------+------------+------------------
15731 | fsm | 1 | t | 1 | 0
15732 | fsm | 0 | t | 1 | 0
15733 | fsm | 2 | t | 2 | 0
15734 | vm | 0 | t | 2 | 0
15735 | main | 0 | t | 3 | 0
(5 rows)VACUUM created the visibility map (one-page) and the free space map (having three pages, which is the minimum size of such a map).
VACUUM创建了可见性地图(一页)和可用空间地图(具有三页,这是此类地图的最小尺寸)。
And so on.
等等。
调整大小 (Tuning the size)
We can set the cache size using the shared_buffers parameter. The default value is ridiculous 128 MB. This is one of the parameters that it makes sense to increase right after installing PostgreSQL.
我们可以使用shared_buffers参数设置缓存大小。 默认值为荒谬的128 MB。 这是在安装PostgreSQL之后立即增加的有意义的参数之一。
=> SELECT setting, unit FROM pg_settings WHERE name = 'shared_buffers';setting | unit
---------+------
16384 | 8kB
(1 row)Note that a change of this parameter requires server restart since all the memory for the cache is allocated when the server starts.
请注意,更改此参数需要重新启动服务器,因为在服务器启动时会分配所有用于缓存的内存。
What do we need to consider to choose the appropriate value?
选择合适的值需要考虑什么?
Even the largest database has a limited set of «hot» data, which are intensively processed all the time. Ideally, it's this data set that must fit in the buffer cache (plus some space for one-time data). If the cache size if less, then intensively used pages will be constantly evicting one another, which will cause excessive input/output. But blindly increasing the cache is no good either. When the cache is large, the overhead costs of its maintenance will grow, and besides, RAM is also required for other use.
即使是最大的数据库,也只有有限的“热”数据集,这些数据一直被密集地处理。 理想情况下,此数据集必须适合缓冲区高速缓存(再加上一些用于一次性数据的空间)。 如果缓存大小较小,则频繁使用的页面将不断相互淘汰,这将导致过多的输入/输出。 但是盲目增加缓存也不是一件好事。 当高速缓存很大时,其维护的开销成本将会增加,此外,RAM还需要用于其他用途。
So, you need to choose the optimal size of the buffer cache for your particular system: it depends on the data, application, and load. Unfortunately, there is no magic, one-size-fits-all value.
因此,您需要为特定系统选择最佳的缓冲区高速缓存大小:它取决于数据,应用程序和负载。 不幸的是,没有万能的万能魔法。
It is usually recommended to take 1/4 of RAM for the first approximation (PostgreSQL versions lower than 10 recommended a smaller size for Windows).
通常建议为第一个近似值占用1/4的RAM(低于10的PostgreSQL版本建议为Windows使用较小的RAM)。
And then we should adapt to the situation. It's best to experiment: increase or reduce the cache size and compare the system characteristics. To this end, you, certainly, need a test rig and you should be able to reproduce the workload. — Experiments like these in a production environment are a dubious pleasure.
然后我们应该适应这种情况。 最好进行试验:增大或减小缓存大小并比较系统特性。 为此,您当然需要测试设备,并且您应该能够重现工作负载。 —在生产环境中进行此类实验是一种令人怀疑的乐趣。
The Art of Database Experiments. 数据库实验的艺术上的演讲。
But you can get some information on what's happening directly on your live system by means of the same pg_buffercache extension. The main thing is to look from the right perspective.
但是,您可以通过相同的pg_buffercache扩展获取有关直接在实时系统上发生的情况的一些信息。 最主要的是要从正确的角度看待。
For example: you can explore the distribution of buffers by their usage:
例如:您可以通过缓冲区的使用来探索缓冲区的分布:
=> SELECT usagecount, count(*)
FROM pg_buffercache
GROUP BY usagecount
ORDER BY usagecount;
usagecount | count
------------+-------
1 | 221
2 | 869
3 | 29
4 | 12
5 | 564
| 14689
(6 rows)In this case, multiple empty values of the count correspond to empty buffers. This is hardly a surprise for a system where nothing is happening.
在这种情况下,计数的多个空值对应于空缓冲区。 对于什么也没有发生的系统来说,这不足为奇。
We can see what share of which tables in our database is cached and how intensively these data are used (by «intensively used», buffers with the usage count greater than 3 are meant in this query):
我们可以看到缓存了数据库中哪些表的份额以及这些数据的使用强度(按“频繁使用”,此查询表示使用计数大于3的缓冲区):
=> SELECT c.relname,
  count(*) blocks,
  round( 100.0 * 8192 * count(*) / pg_table_size(c.oid) ) "% of rel",
  round( 100.0 * 8192 * count(*) FILTER (WHERE b.usagecount > 3) / pg_table_size(c.oid) ) "% hot"
FROM pg_buffercache b
  JOIN pg_class c ON pg_relation_filenode(c.oid) = b.relfilenode
WHERE  b.reldatabase IN (
         0, (SELECT oid FROM pg_database WHERE datname = current_database())
       )
AND    b.usagecount is not null
GROUP BY c.relname, c.oid
ORDER BY 2 DESC
LIMIT 10;
relname | blocks | % of rel | % hot
---------------------------+--------+----------+-------
vac | 833 | 100 | 0
pg_proc | 71 | 85 | 37
pg_depend | 57 | 98 | 19
pg_attribute | 55 | 100 | 64
vac_s | 32 | 4 | 0
pg_statistic | 27 | 71 | 63
autovac | 22 | 100 | 95
pg_depend_reference_index | 19 | 48 | 35
pg_rewrite | 17 | 23 | 8
pg_class | 16 | 100 | 100
(10 rows) For example: we can see here that the vac table occupies most space (we used this table in one of the previous topics), but it has not been accessed long and it is not evicted yet only because empty buffers are still available.
例如:在这里我们可以看到vac表占用了最多的空间(我们在前面的主题之一中使用了此表),但是由于没有足够长的时间访问它并且仅由于空缓冲区仍然可用而没有将其移出。
You can consider other viewpoints, which will provide you with food for thought. You only need to take into account that:
您可以考虑其他观点,这将为您提供思考的机会。 您只需要考虑以下几点:
- You need to rerun such queries several times: the numbers will vary in a certain range. 您需要多次重新运行此类查询:数字将在一定范围内变化。
- You should not continuously run such queries (as part of monitoring) since the extension momentarily blocks accesses to the buffer cache. 您不应连续运行此类查询(作为监视的一部分),因为扩展会暂时阻止对缓冲区高速缓存的访问。
And there is one more point to note. Do not forget either that PostgreSQL works with files through usual OS calls and therefore, double caching takes place: pages get both into the buffer cache of the DBMS and the OS cache. So, not hitting the buffer cache does not always cause a need for actual input/output. But the eviction strategy of OS differs from that of the DBMS: the OS knows nothing about the meaning of the read data.
还有一点需要注意。 别忘了PostgreSQL通过通常的OS调用来处理文件,因此,发生了双重缓存:页面同时进入DBMS的缓冲区缓存和OS缓存。 因此,不命中缓冲区高速缓存并不总是导致需要实际的输入/输出。 但是OS的驱逐策略与DBMS的驱逐策略不同:OS对读取数据的含义一无所知。
大规模驱逐 (Massive eviction)
Bulk read and write operations are prone to the risk that useful pages can be fast evicted from the buffer cache by «one-time» data.
批量读取和写入操作容易产生风险,即可以通过“一次性”数据从缓冲区高速缓存中快速清除有用的页面。
To avoid this, so called buffer rings are used: only a small part of the buffer cache is allocated for each operation. The eviction is carried out only within the ring, so the rest of the data in the buffer cache are not affected.
为了避免这种情况,使用了所谓的缓冲区环 :仅为每个操作分配缓冲区缓存的一小部分。 逐出仅在环内进行,因此缓冲区高速缓存中的其余数据不受影响。
For sequential scans of large tables (whose size is greater than a quarter of the buffer cache), 32 pages are allocated. If during a scan of a table, another process also needs these data, it does not start reading the table from the beginning, but connects to the buffer ring already available. After finishing the scan, the process proceeds to reading the «missed» beginning of the table.
对于大型表的顺序扫描(其大小大于缓冲区高速缓存的四分之一),将分配32个页面。 如果在扫描表期间,另一个进程也需要这些数据,则它不会从头开始读取表,而是连接到已经可用的缓冲环。 扫描结束后,该过程将继续读取表的“ missed”(遗漏)开头。
Let's check it. To do this, let's create a table so that one row occupies a whole page — this way it is more convenient to count. The default size of the buffer cache is 128 MB = 16384 pages of 8 KB. It means that we need to insert more than 4096 rows, that is, pages, into the table.
让我们检查一下。 为此,我们创建一个表,使一行占据整个页面,这样更便于计数。 缓冲区高速缓存的默认大小为128 MB = 16384页8 KB。 这意味着我们需要在表中插入4096多行,即页面。
=> CREATE TABLE big(
  id integer PRIMARY KEY GENERATED ALWAYS AS IDENTITY,
  s char(1000)
) WITH (fillfactor=10);
=> INSERT INTO big(s) SELECT 'FOO' FROM generate_series(1,4096+1);
Let's analyze the table.
让我们分析一下表格。
=> ANALYZE big;
=> SELECT relpages FROM pg_class WHERE oid = 'big'::regclass;
relpages
----------
4097
(1 row)Now we will have to restart the server to clear the cache of the table data that the analysis has read.
现在,我们将不得不重新启动服务器以清除分析已读取的表数据的缓存。
student$ sudo pg_ctlcluster 11 main restartLet's read the whole table after the restart:
让我们在重启后阅读整个表:
=> EXPLAIN (ANALYZE, COSTS OFF) SELECT count(*) FROM big;QUERY PLAN
---------------------------------------------------------------------
Aggregate (actual time=14.472..14.473 rows=1 loops=1)
-> Seq Scan on big (actual time=0.031..13.022 rows=4097 loops=1)
Planning Time: 0.528 ms
Execution Time: 14.590 ms
(4 rows)And let's make sure that table pages occupy only 32 buffers in the buffer cache:
并且确保表页在缓冲区高速缓存中仅占用32个缓冲区:
=> SELECT count(*)
FROM pg_buffercache
WHERE relfilenode = pg_relation_filenode('big'::regclass);
count
-------
32
(1 row)But if we forbid sequential scans, the table will be read using index scan:
但是,如果我们禁止顺序扫描,则将使用索引扫描读取表:
=> SET enable_seqscan = off;
=> EXPLAIN (ANALYZE, COSTS OFF) SELECT count(*) FROM big;
QUERY PLAN
-------------------------------------------------------------------------------------------
Aggregate (actual time=50.300..50.301 rows=1 loops=1)
-> Index Only Scan using big_pkey on big (actual time=0.098..48.547 rows=4097 loops=1)
Heap Fetches: 4097
Planning Time: 0.067 ms
Execution Time: 50.340 ms
(5 rows)In this case, no buffer ring is used and the entire table will get into the buffer cache (along with almost the entire index):
在这种情况下,不使用缓冲区环,并且整个表将进入缓冲区高速缓存(以及几乎整个索引):
=> SELECT count(*)
FROM pg_buffercache
WHERE relfilenode = pg_relation_filenode('big'::regclass);
count
-------
4097
(1 row)Buffer rings are used in a similar way for a vacuum process (also 32 pages) and for bulk write operations COPY IN and CREATE TABLE AS SELECT (usually 2048 pages, but not more than 1/8 of the buffer cache).
缓冲区环以类似的方式用于真空处理(也为32页)和批量写入操作COPY IN和CREATE TABLE AS SELECT(通常为2048页,但不超过缓冲区高速缓存的1/8)。
临时表 (Temporary tables)
Temporary tables are an exception from the common rule. Since temporary data are visible to only one process, there's no need for them in the shared buffer cache. Moreover, temporary data exist only within one session and therefore do not need protection against failures.
临时表是通用规则的一个例外。 由于临时数据仅对一个进程可见,因此在共享缓冲区高速缓存中不需要它们。 此外,临时数据仅存在于一个会话中,因此不需要保护以防出现故障。
Temporary data use the cache in the local memory of the process that owns the table. Since such data are available to only one process, they do not need to be protected with locks. The local cache uses the normal eviction algorithm.
临时数据使用拥有表的进程的本地内存中的缓存。 由于此类数据仅可用于一个进程,因此不需要使用锁对其进行保护。 本地缓存使用普通逐出算法。
Unlike for the shared buffer cache, memory for the local cache is allocated as the need arises since temporary tables are far from being used in many sessions. The maximum memory size for temporary tables in a single session is limited by the temp_buffers parameter.
与共享缓冲区高速缓存不同的是,由于临时表远未在许多会话中使用,因此根据需要分配用于本地高速缓存的内存。 单个会话中临时表的最大内存大小受temp_buffers参数限制。
预热缓存 (Warming up the cache)
After server restart, some time must elapse for the cache to «warm up», that is, get filled with live actively used data. It may sometimes appear useful to immediately read the contents of certain tables into the cache, and a specialized extension is available for this:
服务器重新启动后,必须经过一些时间才能使缓存“热身”,即,将实时使用的数据填满。 立即将某些表的内容读入缓存有时看起来很有用,为此可以使用专门的扩展名:
=> CREATE EXTENSION pg_prewarm;Earlier, the extension could only read certain tables into the buffer cache (or only into the OS cache). But PostgreSQL 11 enabled it to save the up-to-date state of the cache to disk and restore it after a server restart. To make use of it, you need to add the library to shared_preload_libraries and restart the server.
之前,该扩展只能将某些表读入缓冲区高速缓存(或仅读入OS高速缓存)。 但是PostgreSQL 11使它能够将缓存的最新状态保存到磁盘,并在服务器重启后将其还原。 要使用它,您需要将库添加到shared_preload_libraries并重新启动服务器。
=> ALTER SYSTEM SET shared_preload_libraries = 'pg_prewarm';student$ sudo pg_ctlcluster 11 main restartAfter the restart, if the value of the pg_prewarm.autoprewarm parameter did not change, the autoprewarm master background process will be launched, which will flush the list of pages stored in the cache once every pg_prewarm.autoprewarm_interval seconds (do not forget to count the new process in when setting the value of max_parallel_processes).
重新启动后,如果pg_prewarm.autoprewarm参数的值未更改,则将启动autoprewarm主后台进程,它将每隔pg_prewarm.autoprewarm_interval秒刷新一次缓存中存储的页面列表(请不要忘记计算设置max_parallel_processes的值时的新过程)。
=> SELECT name, setting, unit FROM pg_settings WHERE name LIKE 'pg_prewarm%';name | setting | unit
---------------------------------+---------+------
pg_prewarm.autoprewarm | on |
pg_prewarm.autoprewarm_interval | 300 | s
(2 rows)postgres$ ps -o pid,command --ppid `head -n 1 /var/lib/postgresql/11/main/postmaster.pid` | grep prewarm10436 postgres: 11/main: autoprewarm master Now the cache does not contain the table big:
现在缓存不包含表big :
=> SELECT count(*)
FROM pg_buffercache
WHERE relfilenode = pg_relation_filenode('big'::regclass);
count
-------
0
(1 row)If we consider all its contents to be critical, we can read it into the buffer cache by calling the following function:
如果我们认为其所有内容都是至关重要的,则可以通过调用以下函数将其读取到缓冲区高速缓存中:
=> SELECT pg_prewarm('big');pg_prewarm
------------
4097
(1 row)=> SELECT count(*)
FROM pg_buffercache
WHERE relfilenode = pg_relation_filenode('big'::regclass);count
-------
4097
(1 row) The list of blocks is flushed into the autoprewarm.blocks file. To see the list, we can just wait until the autoprewarm master process completes for the first time, or we can initiate the flush manually like this:
块列表将刷新到autoprewarm.blocks文件中。 要查看列表,我们可以等到自动预热主进程第一次完成,或者我们可以手动启动刷新,如下所示:
=> SELECT autoprewarm_dump_now();autoprewarm_dump_now
----------------------
4340
(1 row)The number of flushed pages already exceeds 4097; the pages of the system catalog that are already read by the server are counted in. And this is the file:
刷新的页面数已超过4097。 服务器已读取的系统目录的页面被计入。这是文件:
postgres$ ls -l /var/lib/postgresql/11/main/autoprewarm.blocks-rw------- 1 postgres postgres 102078 jun 29 15:51 /var/lib/postgresql/11/main/autoprewarm.blocksNow let's restart the server again.
现在,让我们再次重新启动服务器。
student$ sudo pg_ctlcluster 11 main restartOur table will again be in the cache after the server start.
服务器启动后,我们的表将再次位于缓存中。
=> SELECT count(*)
FROM pg_buffercache
WHERE relfilenode = pg_relation_filenode('big'::regclass);
count
-------
4097
(1 row)That same autoprewarm master process provides for this: it reads the file, divides the pages by databases, sorts them (to make reading from disk sequential whenever possible) and passes them to a separate autoprewarm worker process for handling.
相同的自动预热主进程也可以提供此功能:它读取文件,按数据库划分页面,对它们进行排序(以尽可能从磁盘进行顺序读取),然后将它们传递给单独的自动预热工作进程进行处理。
Read on. 继续阅读 。


 3085
3085

 被折叠的 条评论
为什么被折叠?
被折叠的 条评论
为什么被折叠?
 到【灌水乐园】发言


