使用jenkins发布项目
The results of Jenkins come from different tools and will be placed in different locations within the Jenkins GUI. We will be navigating through two different pages. First we have the project view page, which is recognizable by the project name at the top. On this page, you get a general overview of the project and you can easily compare several builds. You can reach this page by clicking on the project from the default overview page. Next to the project view page, we also have the build view page. You can navigate to this page by clicking on a build number in the sidebar. Here, you will be able to view all kinds of details regarding this particular build.
Jenkins的结果来自不同的工具,并将放置在Jenkins GUI中的不同位置。 我们将浏览两个不同的页面。 首先,我们有项目视图页面,该页面可以通过顶部的项目名称来识别。 在此页面上,您可以大致了解该项目,并且可以轻松比较多个版本。 您可以通过单击默认概览页面上的项目来访问此页面。 在项目视图页面旁边,我们还有构建视图页面。 您可以通过单击侧边栏中的内部版本号导航到此页面。 在这里,您将能够查看有关此特定版本的所有详细信息。
Within this article, we will be going through each tool and have a look at what it reports back to us. In the end, we will also look at some extra details Jenkins collects for us. Since we build the same project several times, we will get straight lines within our graphs. In a real project, the graph would fluctuate.
在本文中,我们将介绍每种工具,并查看它向我们报告的内容。 最后,我们还将研究詹金斯为我们收集的一些额外细节。 由于我们多次构建同一个项目,因此在图形中会得到直线。 在实际的项目中,图形会波动。
PHP CodeSniffer (PHP CodeSniffer)
CodeSniffer is a tool which checks if your code is compliant with a general ruleset or your own custom ruleset. In our case, we configured that we would like to test our tool against PSR2. We defined this in the build.xml file.
CodeSniffer是用于检查您的代码是否符合通用规则集或您自己的自定义规则集的工具。 在本例中,我们配置为要针对PSR2测试我们的工具。 我们在build.xml文件中定义了它。
<arg value="--standard=PSR2" />On the overview page, you will see a graph named ‘Checkstyle Trend’. This graph represents the number of PRS2 issues in every build. In our code, we almost completely complied to the PSR2 standard, so our graph only shows one.
在概述页面上,您将看到一个名为“ Checkstyle Trend”的图。 该图表示每个构建中的PRS2问题的数量。 在我们的代码中,我们几乎完全符合PSR2标准,因此我们的图形仅显示了一个。
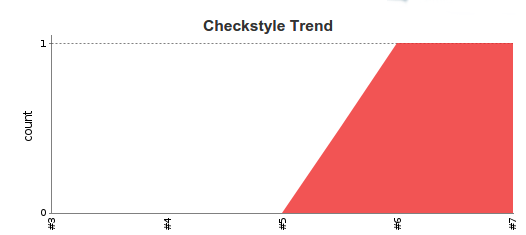
There is an additional graph lower on the page combining the data from 3 tools. CodeSniffer is one of them.
页面下方还有一个附加图,该图组合了3种工具的数据。 CodeSniffer是其中之一。
To see where the issue is located, you can either click on ‘checkstyle warnings’ in the left side menu for the latest build, or click on a particular build and then click on ‘checkstyle warnings’ for that particular build.
要查看问题所在,您可以单击左侧菜单中的“ checkstyle warnings”以获取最新版本,或者单击特定的版本,然后单击该特定版本的“ checkstyle warnings”。

On this page, you can clearly see a description of the issue. Note that you have several filters available. In the top bar, you can clearly see how many issues are new and how many are fixed. You can click the number to get a clear view of the changes. In the summary, you can quickly see the issues categorized by priority.
在此页面上,您可以清楚地看到问题的描述。 请注意,您有几个可用的过滤器。 在顶部栏中,您可以清楚地看到有多少新问题,有多少已解决。 您可以单击数字以获得更改的清晰视图。 在摘要中,您可以快速查看按优先级分类的问题。
PHP的MD (PHP MD)
MD stands for Mess Detector. This tool tries to indicate several problems within your code. This can be potential bugs, unused code or complicated methods. For the complete list of checks available, you can take a look at this page. Note that we aren’t checking for every single rule. You can define which rules you want to check for in the phpmd.xml file.
MD代表混乱探测器。 该工具试图指出代码中的几个问题。 这可能是潜在的错误,未使用的代码或复杂的方法。 有关可用检查的完整列表,请查看此页面 。 请注意,我们并没有检查每条规则。 您可以在phpmd.xml文件中定义要检查的规则。
As with PHP CodeSniffer, we see a graph on the project view page which indicates how our mess detection is progressing over time.
与PHP CodeSniffer一样,我们在项目视图页面上看到一个图形,该图形指示我们的混乱检测随着时间的推移如何进行。
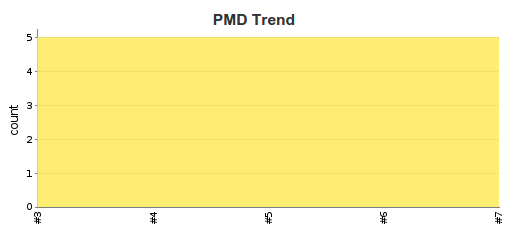
To figure out what is going wrong, you can click on ‘pmd warnings’ in the left side menu to go to the latest build. If you prefer to view a different build, click on a build and then choose ‘pmd warnings’. You will end up on a page which is similar to the PHP CodeSniffer page.
要找出问题所在,您可以单击左侧菜单中的“ pmd警告”以转到最新版本。 如果您希望查看其他版本,请单击某个版本,然后选择“ pmd warnings”。 您将最终到达一个类似于PHP CodeSniffer页面的页面。

At the top, you can again see how many issues are new and how many are fixed. Next to that you also see the priority of each issue.
在顶部,您可以再次查看有多少新问题以及已解决多少问题。 除此之外,您还可以看到每个问题的优先级。
In the details page, you get more information about where you can locate the issue. There are many tabs available to give the same information in a different way. For example, you can click on ‘types’ to find out more about each type.
在详细信息页面中,您会获得有关在何处可以找到问题的更多信息。 有许多选项卡可用于以不同的方式提供相同的信息。 例如,您可以单击“类型”以查找有关每种类型的更多信息。

As you can see, the ‘UnusedFormalParameter’ is our biggest problem. By clicking it, we will once again see which files got an unused parameter.
如您所见,“ UnusedFormalParameter”是我们最大的问题。 通过单击它,我们将再次看到哪些文件具有未使用的参数。
PHP CPD (PHP CPD)
CPD stands for Copy Paste Detector. This tool will analyze all your code and look for multiple duplicate lines. If you have lots of duplicate lines, it could mean you should rewrite some parts so the logic is shared between multiple classes. Once again on the project view page, we will see the overall progress in all builds.
CPD代表复制粘贴检测器。 该工具将分析您的所有代码并查找多个重复的行。 如果您有很多重复的行,则可能意味着您应该重写一些部分,以便在多个类之间共享逻辑。 再次在项目视图页面上,我们将看到所有构建的总体进度。
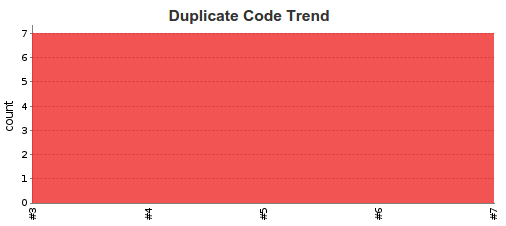
In the left side menu, we can click ‘duplicate code’ to get an overview of the problems found. As before, click on a build to get more information regarding that build. You will notice the overview looks similar like the previous pages. Let’s click on the details tab to get some more information.
在左侧菜单中,我们可以单击“重复代码”以概述发现的问题。 和以前一样,单击一个构建以获取有关该构建的更多信息。 您会发现概述与前几页类似。 让我们单击“ details选项卡以获得更多信息。
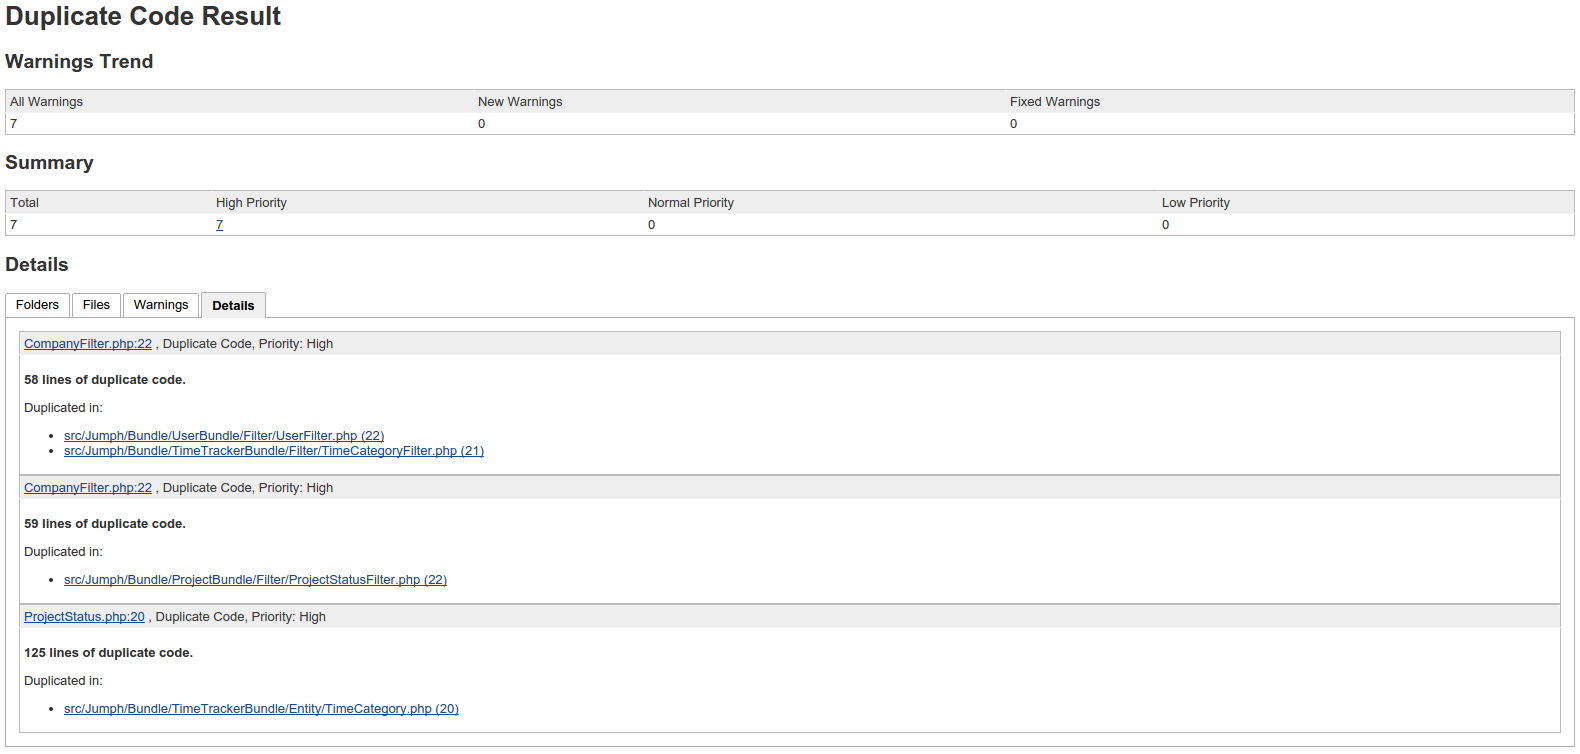
As you can see, there are 58 lines in the CompanyFilter class which are also in the UserFilter and TimeCategoryFilter class. Based on this data, you could decide that you are in need of some kind of BaseFilter which handles most parts for all 3 classes or implement a service. The solution depends on your case, PHP CPD just tells you where it found an issue.
如您所见,CompanyFilter类中有58行,UserFilter和TimeCategoryFilter类中也有58行。 根据此数据,您可以确定需要某种BaseFilter,该BaseFilter可以处理所有3个类的大部分部件或实现服务。 解决方案取决于您的情况,PHP CPD只会告诉您它在哪里发现问题。
PHP依赖 (PHP Depend)
PHP Depend is probably the metric that’s hardest to understand. PHP Depend performs a static code analysis on your code base. It results in 2 images and an overview page. Perhaps you noticed that at the top of the project view page, there is some HTML which should display an image.
PHP Depend可能是最难理解的指标。 PHP Depend在您的代码库上执行静态代码分析。 结果为2张图像和一个概述页面。 也许您已经注意到,在项目视图页面的顶部,有一些HTML应该显示图像。
The fact that the images are not shown means you have to flip a switch in Jenkins’ configuration. Go to ‘manage jenkins’ and head to ‘Configure Global Security’. There is a select box with which you can configure the ‘markup formatter’. Set this to ‘Safe HTML’ and save your settings. If you now return to the project view page, you will notice the HTML is converted to two images.
没有显示图像的事实意味着您必须在Jenkins的配置中翻转一个开关。 转到“管理詹金斯”,然后转到“配置全局安全性”。 有一个选择框,可用于配置“标记格式器”。 将其设置为“安全HTML”并保存设置。 如果现在返回项目视图页面,您会注意到HTML转换为两个图像。
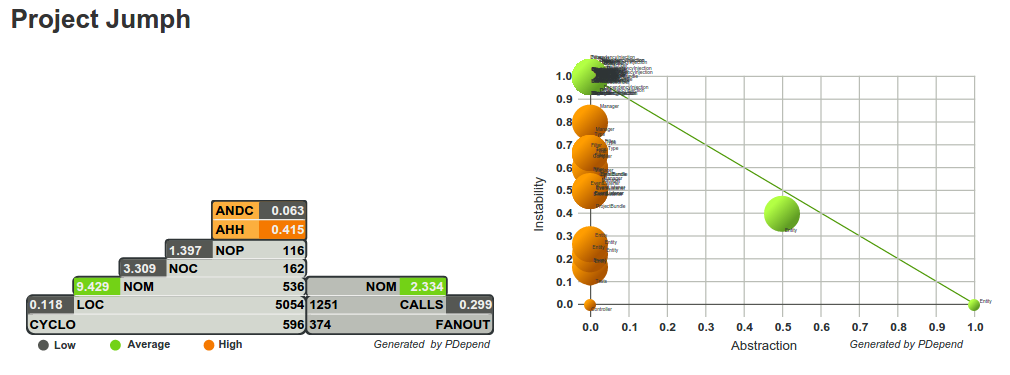
I suggest you read the official documentation of this tool to fully understand both graphs. For more information about the pyramid, you can check this link. For the abstraction instability chart you can check this link.
我建议您阅读此工具的官方文档以充分理解这两个图形。 有关金字塔的更多信息,您可以检查此链接。 对于抽象不稳定图,您可以检查此链接。
You can get more details by clicking on a specific build and then choosing ‘JDepend’ in the left side menu. You will get an overview like this.
您可以通过单击特定的构建,然后在左侧菜单中选择“ JDepend”来获取更多详细信息。 您将获得类似的概述。
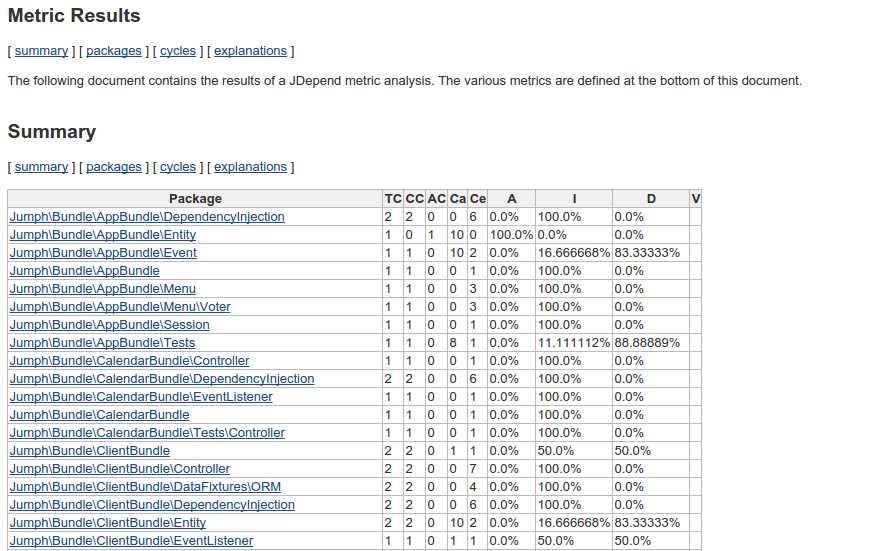
The explanation of this page is also rather big and complex, so I refer you to the official documentation in which everything is explained.
该页面的解释也相当庞大而复杂,因此,我请您参考其中解释了所有内容的官方文档 。
PHPLOC (PHPLOC)
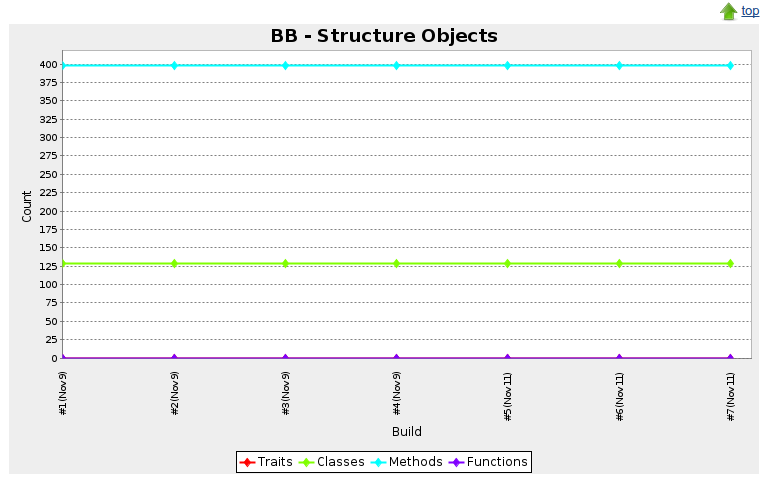
PHPLOC is a tool to quickly measure your project size. It shows you the total number of lines of code, the total number of static methods, etc. In the left side menu, you can click ‘plots’ to get the results of this tool. You have 11 plots at your disposal in which you can find this information. Below, you will see a screenshot of the plot which indicates the total lines of code and comments and the total amount of methods, classes, traits and functions.
PHPLOC是一种可以快速衡量项目规模的工具。 它显示了代码行的总数,静态方法的总数等。在左侧菜单中,您可以单击“图”以获取此工具的结果。 您有11个地块可供使用,您可以在其中找到此信息。 在下面,您将看到该图的屏幕快照,其中指出了代码和注释的总行以及方法,类,特征和函数的总数量。

PHPUnit (PHPUnit)
A big amount of statistics within Jenkins is generated by PHPUnit. On the overview alone, you will see 3 graphs generated by data coming from PHPUnit.
Jenkins中的大量统计信息是由PHPUnit生成的。 仅在概述上,您将看到3个由PHPUnit的数据生成的图形。
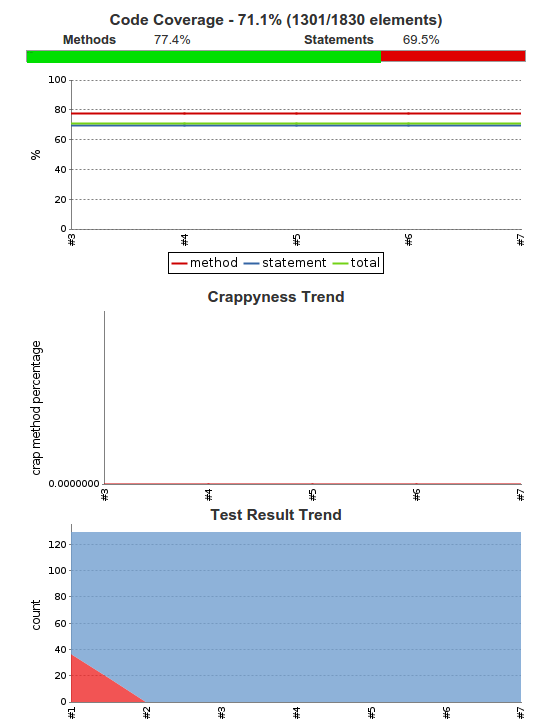
The first graph indicates how much of the code is covered with tests. In our case, 71.1%. To generate this coverage, xdebug is used in the background.
第一张图指示测试覆盖了多少代码。 就我们而言,为71.1%。 为了生成此覆盖范围,在后台使用xdebug。
The second graph indicates your CRAP level. CRAP stands for Change Risk Analysis and Predictions. CRAP is calculated by checking the complexity of your code in combination with the amount of tests performed on the code. If you skimmed through the PHP MD rules, you might have noticed that PHP MD is also capable of checking the complexity of your code, but doesn’t take the unit tests in consideration. Read here to see how PHP MD calculates your complexity.
第二张图显示了您的CRAP水平。 CRAP代表变更风险分析和预测。 通过检查代码的复杂性以及对代码执行的测试数量来计算出CRAP。 如果您浏览了PHP MD规则,您可能已经注意到PHP MD也能够检查代码的复杂性,但是没有考虑单元测试。 阅读此处以了解PHP MD如何计算您的复杂性。
The final graph shows you how many tests succeeded and how many failed. In our case, they all succeeded.
最终图形显示了成功进行了多少测试以及失败了多少。 就我们而言,他们都成功了。
In our left side bar menu, we have 2 items which are generated by PHPUnit. The first one is Crap. On this page you can see an overview of several graphs which indicate how high your current CRAP level is. At the bottom, you will actually see which methods are marked as CRAP. You will notice a column indicating the coverage and complexity.
在左侧栏菜单中,我们有2个项目是由PHPUnit生成的。 第一个是Crap 。 在此页面上,您可以看到几个图表的概述,这些图表指示您当前的CRAP级别。 在底部,您将实际看到哪些方法标记为CRAP。 您会注意到一列指示范围和复杂性。
The second menu item is ‘clover HTML report’. Within this page, you can get an overview per directory how much is covered by your unit tests.
第二个菜单项是“三叶草HTML报告”。 在此页面中,您可以获取每个目录的概述,单元测试覆盖了多少。
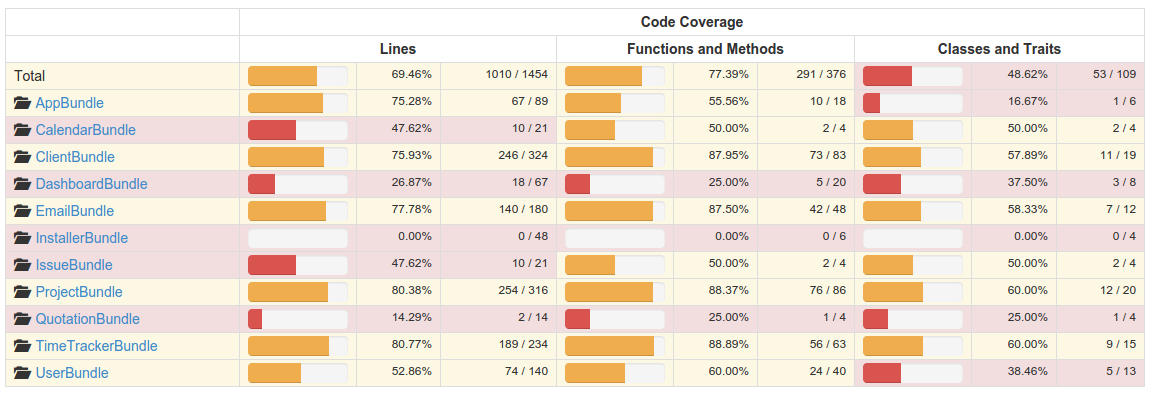
You can click on a directory to dive deeper into your source. If you reach a file, you can open up that file and see per line how much is covered. With colors, it’s indicated which parts are being tested and which are not. Hovering over a line indicates how many times this line has been called by your unit tests.
您可以单击目录以更深入地了解您的源。 如果找到文件,则可以打开该文件并每行查看覆盖了多少。 用颜色指示要测试的部分,未测试的部分。 将鼠标悬停在一行上可以指示您的单元测试调用了该行多少次。
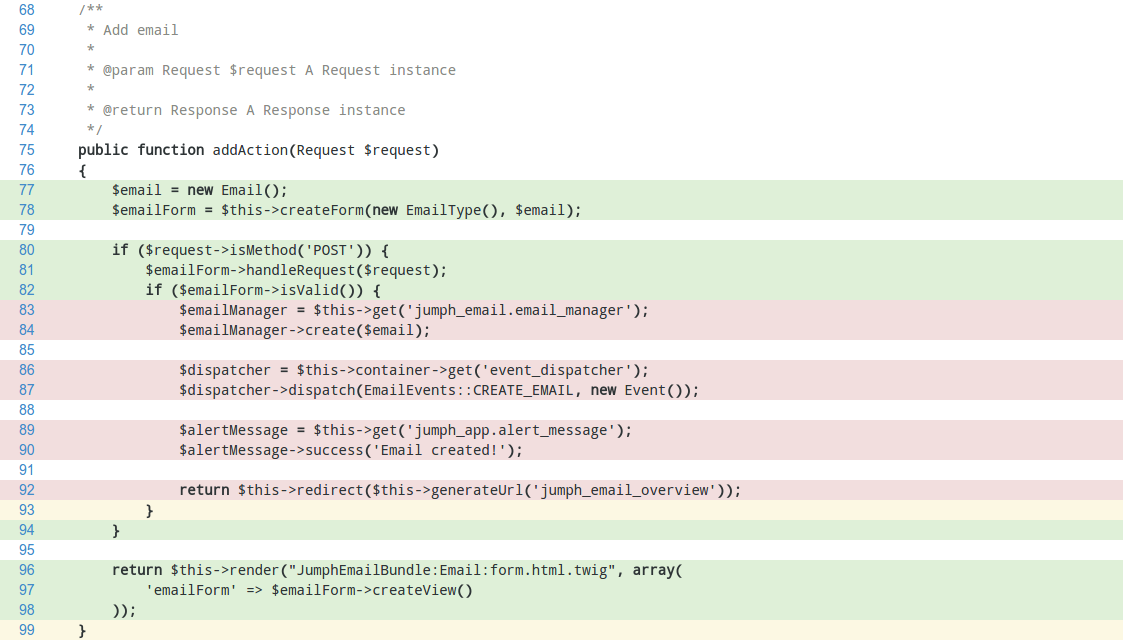
In our case we can clearly see that the part within the if statement is not called by a unit test. This is correct in our case. Only a GET request is performed on this method and not a POST request. If we implement a POST request in our unit test, this if statement will be marked green. This way you can easily spot any missing parts in your unit tests.
在我们的案例中,我们可以清楚地看到if语句中的部分未被单元测试调用。 在我们的情况下这是正确的。 此方法仅执行GET请求,而不执行POST请求。 如果我们在单元测试中实现POST请求,则此if语句将标记为绿色。 这样,您可以轻松地在单元测试中发现任何缺失的零件。
PHPDox (PHPDox)
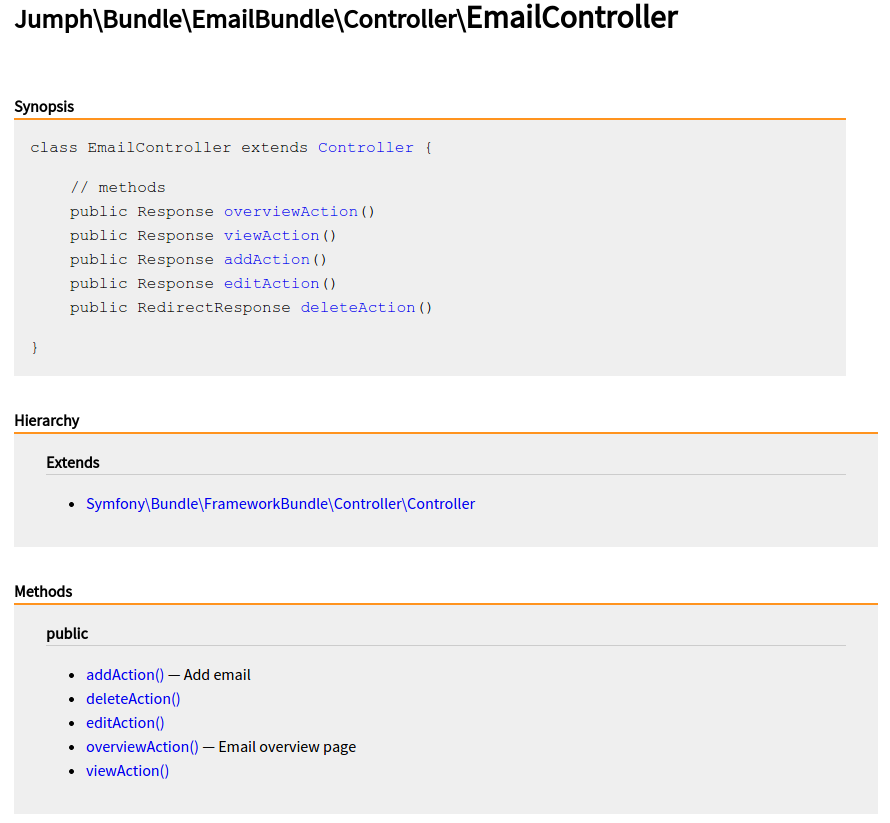
There are many tools that generate documentation based on your code and comments. PHPDox is just another tool which can perform this task for you. In the left side menu you can click on ‘API Documentation’ to go to your documentation. The nice thing about PHPDox is that it also includes the results of all the other tools.
有很多工具可以根据您的代码和注释生成文档。 PHPDox只是另一个可以为您执行此任务的工具。 在左侧菜单中,您可以单击“ API文档”以转到您的文档。 PHPDox的好处是它还包含所有其他工具的结果。
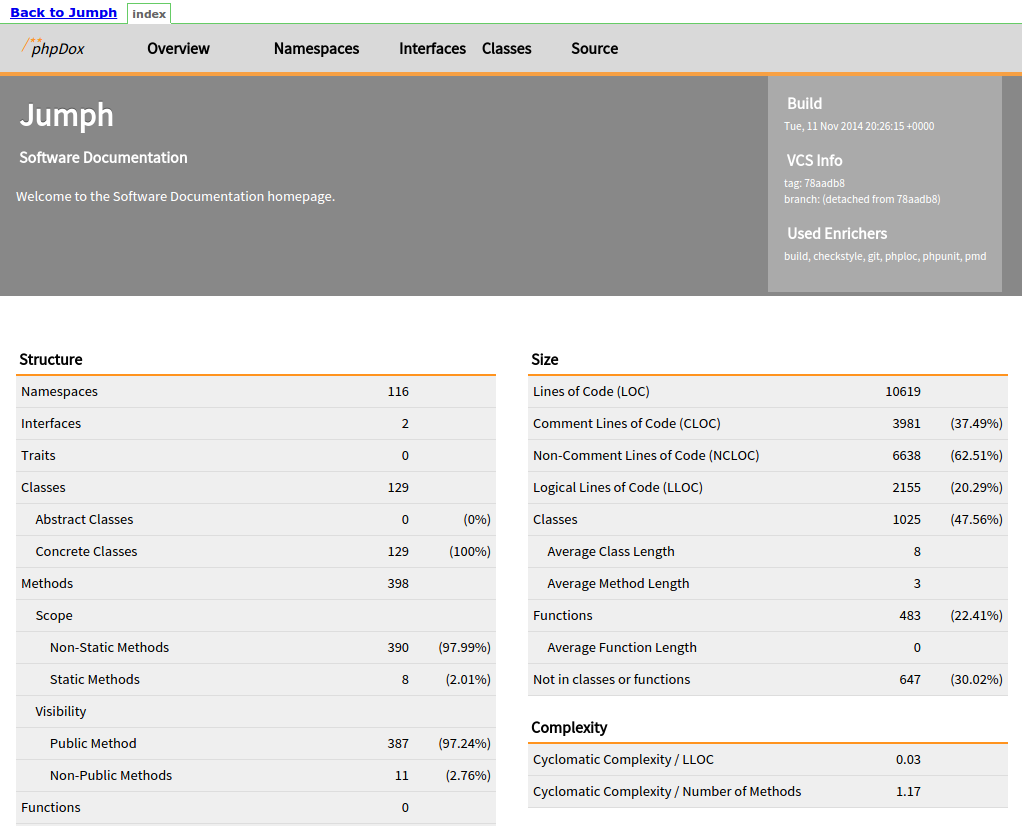
Through the navigation at the top, you can get an overview of all classes, but you can also dive deeper into a class and get an overview of all methods and descriptions. You can also view the history and the source of the file.
通过顶部的导航,您可以获取所有类的概述,但还可以更深入地研究一个类并获得所有方法和描述的概述。 您还可以查看历史记录和文件来源。
其他页面 (Other pages)
Next to the tools we set up during the previous articles, Jenkins also collects other information for you. The violations plugin we installed creates an additional page which shows an overview of PHP CodeSniffer, PHP MD and PHP CPD.
在上一篇文章中我们设置的工具旁边,Jenkins还会为您收集其他信息。 我们安装的违规插件会创建一个附加页面,其中显示了PHP CodeSniffer,PHP MD和PHP CPD的概述。
You can also click on a specific build and find a menu item named ‘changes’ in the left side menu. If you go to this page, you will see an overview of all commits made between the previous build and this build. If no changes were made of course, the page will just be blank.
您也可以单击特定的版本,然后在左侧菜单中找到名为“ changes”的菜单项。 如果转到此页面,将看到在先前版本与该版本之间进行的所有提交的概述。 如果没有进行任何更改,则该页面将为空白。

结论 (Conclusion)
In this article, we took a close look at the kind of metrics we get back from all the tools. All the information you retrieved can also be retrieved on the command line. The strength of Jenkins is that you can create graphs and overviews which better represent the issues.
在本文中,我们仔细研究了从所有工具中获得的指标。 您检索的所有信息也可以在命令行上检索。 Jenkins的优势在于您可以创建更好地表示问题的图表和概览。
In the final part, we will be swapping out some tools and adding some additional metrics. We will also take a look at how we can analyze our CSS, JavaScript and HTML code.
在最后一部分,我们将交换一些工具并添加一些其他指标。 我们还将研究如何分析CSS,JavaScript和HTML代码。
翻译自: https://www.sitepoint.com/analyzing-php-project-jenkins/
使用jenkins发布项目


 本文深入探讨了使用Jenkins进行项目发布的全过程,详细介绍了通过多种工具分析项目质量、代码风格、测试覆盖率等方面的方法。


 1958
1958

 被折叠的 条评论
为什么被折叠?


