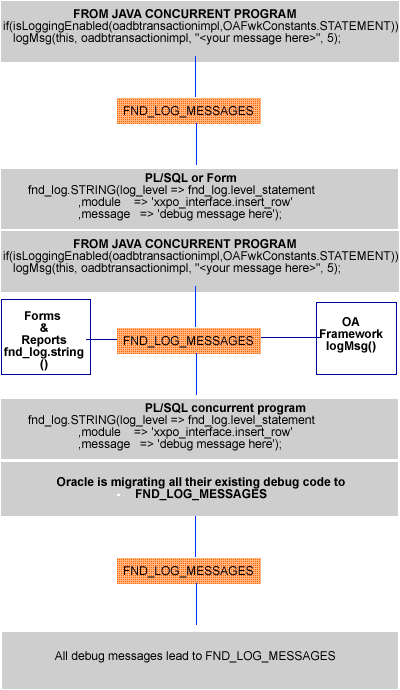
But this is changing now, thanks to FND Logging. I have been using FND Logging for over one year now, ever since 11.5.10 was released, hence I would like to share knowledge on this topic.
What is the use of FND Debug Log?
1. It helps you pinpoint the cause of error in standard Oracle Code, by making debug messages to appear in a centralized table named FND_LOG_MESSAGES.
2. You can design and build your custom extensions in a manner that can easily be debugged. This can be done by calling Oracle delivered API’s in your custom code.
Where is the debug message stored, once the logging is turned on?
Debug messages are stored in a table called FND_LOG_MESSAGES
A program written in any technology, either form, or report, or pl/sql or java concurrent program or OAF…all their debug messages will be stored in fnd_log_messages.
How to debug the issue being faced in Oracle Application?
Step 1 Set the following profile options at your user level(your fnd_user)
FND: Debug Log Level
Following possible values are available, but I suggest you set this to "Statement" level when debugging code.
LEVEL_UNEXPECTED : Internal Level Id is 6
LEVEL_ERROR : Internal Level Id is 5
LEVEL_EXCEPTION : Internal Level Id is 4
LEVEL_EVENT : Internal Level Id is 3
LEVEL_PROCEDURE : Internal Level Id is 2
LEVEL_STATEMENT : Internal Level Id is 1
FND: Debug Log Enabled
Set this profile to Yes
FND: Debug Log Module
Set this to %
Step 2
Login to the application and reproduce the problem.
Step 3
SELECT *
FROM fnd_log_messages
WHERE user_id = 209122 /*your FND_USER user_id here*/
AND TIMESTAMP > SYSDATE - .3
ORDER BY log_sequence DESC /*note the order by clause here*/
The result of this select statement will provide the list of all the debug messages, on top will appear the most recent debug messages..
Why should I setup the module name to %, in profile option?
You can set this to po%, if you know for sure that the error was caused by code written in po module. However po code might be internally calling hr code which might inturn be calling fnd code.
Hence it’s best to set this profile value as %.
You may also use comma delimited values i.e po%,hr%,fnd%
Why must I bother debugging Oracle's Standard code when I can quickly raise a tar.
If the issue is with Standard Oracle Code, first thing you must do is to search into Metalink. However having the debug information on error helps your searching ability further. Uploading the debug messages upfront during Tar creation will also help Oracle speedily understand and fix your issues.
Why to set the profile option to statement level?
This profile option has following main levels.-
Error
Warning
Procedure
Statement
I like setting this to "Statement" level as it extracts debug messages at all levels, in one glance. You can latter filter those debug messages by using below SQL for example
select * from fnd_log_messages where user_id = 111 and LOG_LEVEL =5
What if the piece of code causing the error is not appearing in fnd_log_messages?
This is very much possible. The fnd_log_messages might have helped you get close to the culprit piece of code , but may not be able to pinpoint the error as there may not be enough debug messages implanted by Oracle.
You can do one of the below:-
A. Run the database sql trace for the session with bind variables and see the last meaningful SQL statement in the raw trace file.
Please note that PL/SQL statements will not appear in trace, only the SQL Statements will appear, hence you may consider option (b) below
B. Add your own debug messages to the pl/sql code that was delivered by oracle, which you suspect is causing problem. This is a temporary change, and must only be done on development environment, NEVER DO THIS CHANGE ON PRODUCTION.
The size of table FND_LOG_MESSAGES will keep on increasing?
You can run concurrent program “Purge Debug Log and System Alerts”.
I have written a pl/sql concurrent process to interface Purchase Orders from 3rd Party System. How will add debug messages?
fnd_log.STRING(log_level => fnd_log.level_statement
,module => 'xxpo.packagename.procedurename'
,message => 'debug message here');
Will the above debug command create an entry into fnd_log_messages ?
Debug records will be created in fnd_log_messages if and only if you run the interface program after setting the profile options as suggested above.
What if a rollback occurs due to unhandled exception. Will the inserts done to fnd_log_messages be lost?
fnd_log.string eventually calls procedure FND_LOG.STRING_UNCHECKED_INTERNAL2. This procedure uses pragma AUTONOMOUS_TRANSACTION with a commit.
Hence your debug messages will not be lost despite a rollback in parent session.
来自 “ ITPUB博客 ” ,链接:http://blog.itpub.net/10359218/viewspace-677406/,如需转载,请注明出处,否则将追究法律责任。
转载于:http://blog.itpub.net/10359218/viewspace-677406/


 本文介绍了Oracle应用程序中FND Logging的功能及使用方法。通过设置不同的调试级别,可以帮助开发者定位标准Oracle代码中的错误原因,并在自定义扩展中轻松调试。文章详细解释了如何配置调试参数并提供了SQL查询示例来获取调试信息。


 8521
8521

 被折叠的 条评论
为什么被折叠?


