


记录一些常用的Python 代码功能, 便于查找.
# jupyter notebook 是否显示Dataframe的所有行和列
import pandas as pd
#pd.set_option('display.max_rows',None)
pd.set_option('display.max_columns',None)

#忽略warning 信息
import warnings
warnings.filterwarnings('ignore')

#显示多行输出信息
from IPython.core.interactiveshell import InteractiveShell
InteractiveShell.ast_node_interactivity = 'all'

#常用设定
import numpy as np
import os
import sys
import math
import matplotlib.pyplot as plt
import seaborn as sns
import re

#设定工作目录
sys.path.append("/home/workdir/01XXXX")   #当前位置就是("./")

#导入自己写的代码或函数
#从当前工作目录开始的, 导入 script/ranking.py 里定义的def readin, 或者导入整个ranking代码
from script.ranking import readin
import scripts.ranking as rk
#从 utils.py 导入def AAAA , 或导入整个utils代码
from .utils import AAAA
import utils
读入文件和基本操作
#读取csv 文件
path = '../data/test.csv'
df= pd.read_csv(path)  #sep='\t'

#连续读取文件处理
file_list=["1.csv","2.csv","3.csv"]
for i in range(0,len(file_list)):
    if i == 0:
        df=pd.read_csv('data/' + output_file_list[i])
    else:
        df2=pd.read_csv('data/' +output_file_list[i])
        df = pd.concat([df,df2,axis=0)  #行合并

#更改列名
df = df.rename(columns={"Unnamed: 0": "id"})
#特定列求和
df['score']=df[select_features].apply(lambda x:x.sum(),axis = 1)
#排序
df = df.sort_values('score',ascending = False)
#index处理
df.reset_index(drop=True,inplace=True)

#数字处理
import math
from sklearn.preprocessing import MinMaxScaler
from sklearn import datasets, decomposition,preprocessing
#to numeric
X = df[sel_features].to_numpy()
#normalization 0-1 标准化
scaler = preprocessing.MinMaxScaler().fit(X)

#替换
line = line.replace("\n", "")

#同步批量替换
def reverse(line):   # for reverse read, need to 反向互补
    seq=""
    dict = {"A":"T","T":"A","G":"C","C":"G","N":"N"}
    for i in range(0,len(line)):
        seq+=dict[line[i]]
    return str(seq[::-1])

#查找与检索
line.find(">")  #找不到就返回-1, 找到就返回位置,line是str
seq2 = re.findall(r"MA[A-Z]{9,15}GGSA",seq)   #返回“ ” 中全部内容
seq2 = re.findall(r"MA([A-Z]{9,15})GGSA",seq)   #返回()中内容

#数据记录
peptides=[]  #或者="" ,输出格式会不一样,都试试
……
if line: #一顿处理后的line仍不为空
    peptides.append(line)
或者
    peptides.extend(line)

#分割数据
f=NGS_path+file_list[0].split('/')[-1][:-9]+".fasta"

#转换成dataframe 或list
data.to_frame()
df.age.values.tolist()

#新建列带变量i
df[str(i)+'_Count'] = df['A'] + df['B']

#求中位数平均数 np
np.median(df['score'])

#数据判断条件分组
#cutoff=200
df.loc[df['score']>=cutoff,'Group'] = "High"
df.loc[df['score']<cutoff,'Group'] = "Low"
行列提取
#按某列信息提取行
df = df[df.Name == "demo"]
df = df[df['means']>0.47]  #df[df.means > 0.47]?
df = df[(df['LogA']>-5) & (df['LogC']<8)]

#提取特定行或列
df.loc[3:6]   #提取3-6行
data.loc[[idx]]  #按照索引提取行, data.loc[idx:idx]

df.iloc[:,3:6]   #提取3-6列
df[[‘col_name1','col_names2']]

提取特定元素
df.loc[2][3]   #提取2行3列的元素
#df.loc[行索引,列名]
df.loc[2:4,['col_names1','col_names2']]
#df.loc[行位置,列位置]
df.iloc[2:4,1:3]   #提取2、3行的1、2列元素

#删除特定行或列
df.drop(['Amy','Bod'])   #按行名(index)来删除, 默认 axis =0
df.drop(df.index[[1,3,5]])   #按行号删除

df.drop('name',axis = 1)
df.drop(columns =['name','age'],axis = 1) #按列名来删除
df.drop(df.columns[[1,3]])   #按列号删除
NA处理
df = df.dropna(axis=0,how='any')    #删除带na的所有行
df = df.dropna(axis=1,how='any')    #删除带na的所有列
df = df.dropna(axis=0,how='any')    #删除所有都是na的行

df = df.fillna(0)   #NA 变为0
快速合并两个dataframe
# 省时间的方法, 先找好共有的index, 再组成新的dataframe
sample = list(set(A["CCLE_Name"]).intersection(set(B.index)))   #一个是index, 一个是CCLE_Name 这一列
A.loc[A["CCLE_Name"].isin(sample)].reset_index(drop=True)   #提取A中共有index的行

# 直接拼接两个数据集, 列合并
pd.concat([B.reset_index(drop=True),A.reindex(A["CCLE_Name"].values).reset_index(drop=True)],axis=1)    #shorten the calculate time

sel_features = list(set(Type_1).union(set(Type_2)))  #union 并集, intersaction 交集
pd.concat([df.iloc[:, :1],df[sel_features]],axis=1)    #df.iloc[:, :1] 第一列


# 也可以merge, 但比较耗时,小数据集可以进行这个操作
pd.merge(A,B.loc[:,['Entity ID',"linker",KD]],how="left",on='id')   #how = left/right/inner/outer
输出内容/文件
print("output file: %s" % i)
print("Selecting", len(sel_features)+1, "indicators:",sel_features)

df.to_csv("gene__drug__cor.csv")

out_file = str(col_list[0]) +'_' + str(col_list[-1]) + '.csv'
cor.to_csv(out_file)

#屏幕输入的output csv file
if (args.OUT!="N"):
    df_out[['Entity ID','A','B']].to_csv(args.OUT, index=False)

#屏幕输入的output jpg file
if (PLOT=="Y"):
        images_path="./"
        plt.figure(dpi=120,figsize=(17,6))
        plt.rc('y-axis',labelsize="8") #y轴坐标
        plt.rc('x-axis',labelsize="8")
        (plot)
        plt.savefig("out.plot.jpg",bbox_inches='tight')
屏幕输入 和函数调用
import argparse
parser = argparse.ArgumentParser(description='argparse testing')
parser.add_argument('--IN','-i',type=str,required=True,help="please clarify the input file path")
parser.add_argument('--ROUND','-r',type=int,required=True,help="which round of peptides you would like to analysis?")
arser.add_argument('--PLOT','-p',type=str,default="N",required=False,help="Plot or not")
parser.add_argument('--OUT','-o',type=str,default="N",required=False,help="Output file name")

#printing in screen
args = parser.parse_args()
print("##############STARTING###############")
print("Running time:",datetime.now())
print("Input file:",args.IN)


def func(file,KD,r,p):
   ……
   return(list,df)

lists,df_out = func(args.IN,args.KD,args.ROUND)
统计分析
#统计元素频率
pd.value_counts(dat.gender)

##求cor
#1 vs 多列
from scipy.stats import pearsonr,spearmanr
cor = df.iloc[:,j:].apply(lambda x:spearmanr(x,df.iloc[:,i]),result_type="expand")  #pearsonr
#matrix
cor = dat.corr(method='spearman', min_periods=1, numeric_only=False)
执行shell 命令
import os

NGS_path = "./data_vIII/fastq_gz/"
command = "ls %s*.fastq.gz" % (NGS_path)
#file_list = os.popen(command).read().split("\n")
file_list =[i for i in os.popen(command).read().split("\n") if i != '']

command = "mkdir -p %sQC/" % (NGS_path)
os.system(command)
数数
#超大文件不要轻易用count啊
def count(read_list):
    countDict =dict()

    total = len(read_list)
    #remove duplicate ”peptides_list“ firstly
    #count peptides, can't use count function directly, time consuming: O(n^2)
    for pep in read_list:
        #countDict[pep]= read_list.count(pep)    #don't use count
        if pep not in countDict.keys():
            countDict[pep] =1
        else:
            countDict[pep] += 1
    #sort out into a dataframe
    PEP_count=pd.DataFrame.from_dict(countDict,orient='index',columns=['Count'])
    PEP_count['Library fraction'] = (PEP_count['Count']/total)
    PEP_count = PEP_count.sort_values("Library fraction",ascending = False)
    return PEP_count
多CPU并行
import multiprocessing
from multiprocessing import Process


def run_multi_rounds(file):
    f=NGS_path+file.split('/')[-1][:-11]+"_1.fasta"   #path to forward(_1) fasta file
    r=NGS_path+file.split('/')[-1][:-11]+"_2.fasta"   #path to reverse(_2) fasta file
    f_peptides = match_pattern(fa2AA(f))              #translation & extract peptides seq.
    r_peptides = match_pattern(fa2AA(r))
    peptides_count= count_paired_end_fraction(f_peptides,r_peptides)   #peptide counts
    df = pd.DataFrame(peptides_count)
    out_file = NGS_path+f[-35:][:6] + '_peptide_fraction.csv'    #output file name, for each round
    df.to_csv(out_file)
    print("output file: %s" % out_file)

from multiprocessing import Process
# run each round as the same time
# file_list 0,2,4 for each round has two files(_1;_2).
def run_Process():
    process = [multiprocessing.Process(target=run_multi_rounds,args=(file_list[0],)),
            multiprocessing.Process(target=run_multi_rounds,args=(file_list[2],)),
            multiprocessing.Process(target=run_multi_rounds,args=(file_list[4],)),
           ]
    [p.start() for p in process]
    [p.join() for p in process]


if __name__ =='__main__':
    run_Process()
PCA 查看 PC 重要性
X=df[sel_features].to_numpy()
i=df[sel_features].columns.values.tolist()
scaler = preprocessing.MinMaxScaler().fit(X)。 #自行normalization
X = scaler.transform(X)

#PCA heatmap
pc=10
pca = decomposition.PCA(n_components=pc)
pca.fit(X.T)
print(pca.explained_variance_ratio_)    #每个PC的占比 (可以画落石图)
X_pca = pca.transform(X.T)
#PLOTING
df_p = pd.DataFrame(X_pca, index = i,columns=['PC%s' % i for i in range (1,pc+1)])   #["PC1","PC2","PC3","PC4","PC5","PC6","PC7","PC8"]
plt.figure(dpi=120)
plt.rc('ytick',labelsize="6")
plt.rc('xtick',labelsize="6")
sns.heatmap(data=df_p,cmap=sns.diverging_palette(100,200, sep=50, n=17),vmin=-2,vmax=2,yticklabels=True)    #vmin=-2,vmax=2 限定了颜色均等.diverging_palette的”100“,”200“可以调整颜色
画图
from matplotlib import pyplot as plt

### 散点图
plt.plot(df['score'],'o')
plt.xlabel('ID')  #index
plt.ylabel('score')
plt.show()

###线性图
sns.regplot(x="age",y="score", ci=0.95, data=df)

###热图
scaler = preprocessing.StandardScaler().fit(X)。                  #自己normalization
X = scaler.transform(X)
df_p = pd.DataFrame(X, index = df['ID'],columns=sel_features)    #组成新的dataframe
plt.figure(dpi=120)
plt.rc('ytick',labelsize="6")
plt.rc('xtick',labelsize="6")
sns.heatmap(data=df_p.T,cmap=sns.cubehelix_palette(as_cmap=True),yticklabels=True,xticklabels=True)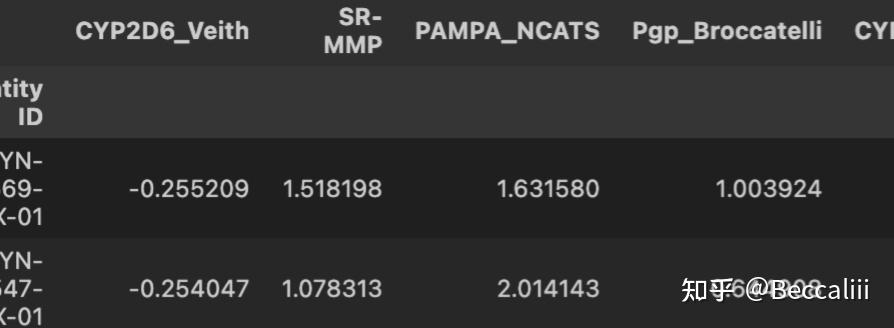
df_p.head(2) 样本在行,特征在列
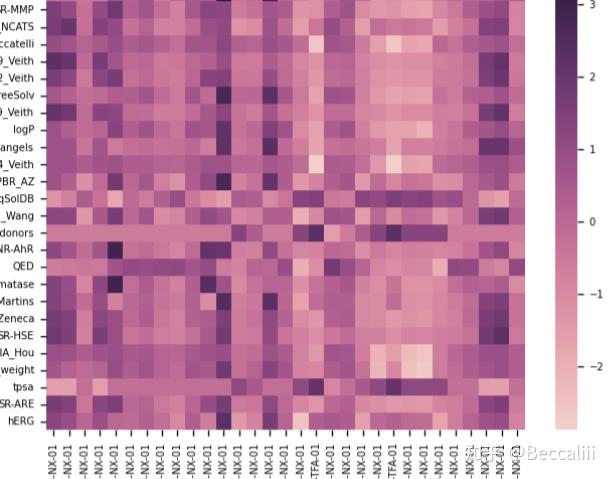
样本在x轴,特征在y轴
#箱型图。 #多图拼在一张图
ind_list = ['Wang', 'Martins','AZ']
df_p = df[ind_list,'Group']

images_path="./"
my_dpi=96
plt.figure(figsize=(1000/my_dpi, 1000/my_dpi), dpi=my_dpi)
plt.rc('ytick',labelsize="8")
plt.rc('xtick',labelsize="8")
for i in range(0,len(ind_list)):   #每一个ind,先计算ttest/utest, 再画图
    #mannwhitneyu(g1[indicator],g2[indicator],use_continuity=True,alternative='less').pvalue
    #mannwhitneyu(g1[indicator],g2[indicator],use_continuity=True,alternative='greater').pvalue
    #stats.ttest_ind(g1[indicator], g2[indicator])

    # Loop to plot
    plt.subplot(len(ind_list),4,i+1)
    sns.boxplot(x="Group",y=ind_list[i],data=df_p,hue="Group",order=["Low","High"], palette="Blues")
    sns.swarmplot(x="Group",y=ind_list[i],data=df_p,color=".25")  #加点
plt.tight_layout()
plt.savefig("plot_output.jpg") 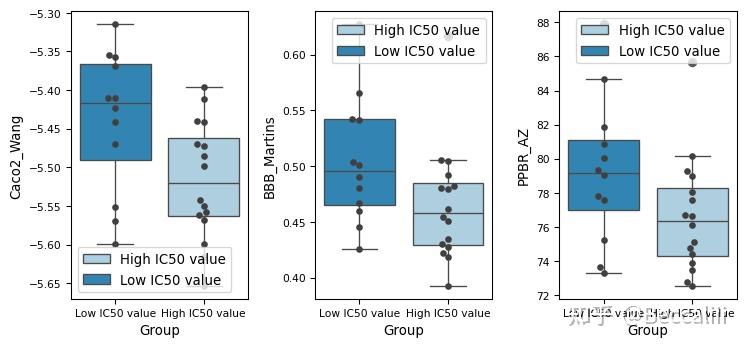


 被折叠的 条评论
为什么被折叠?
被折叠的 条评论
为什么被折叠?
 到【灌水乐园】发言


