


 本文介绍了Matplotlib库中text函数的使用,包括在图表上添加文本注释、设置字体样式和颜色,以及通过bbox参数添加带有边框的注释。详细阐述了fontdict参数中的verticalalignment和horizontalalignment属性,以及bbox的boxstyle、facecolor、alpha等属性。通过示例代码展示了不同参数设置的效果,帮助读者掌握如何在Python数据可视化中创建和定制文本注释。
text函数使用–Matplotlib
1. 函数功能
函数功能: Add text to the axes. Add the text s to the axes at location x, y in data coordinates.
添加注释文本;在坐标(x,y)位置添加文本
2.函数语法
函数语法: text(x, y, s, fontdict=None, **kwargs)
3.函数参与与示例
函数参数:
x, y: float; The position to place the text. By default, this is in data coordinates. The coordinate system can be changed using the transform parameter.
浮点型,放置注释文本的数字坐标位置
s: str; The text.
字符型,文本内容
fontdict: dict, default: None ; A dictionary to override the default text properties. If fontdict is None, the defaults are determined by rcParams.
字典类型,默认为空;用于覆盖默认文本属性的字典项,若字典项为空则默认属性由rcParams确定
默认设置如下:
{'fontsize': rcParams['axes.titlesize'],
 'fontweight': rcParams['axes.titleweight'],
 'color': rcParams['axes.titlecolor'],
 'verticalalignment': 'baseline',
 'horizontalalignment': loc}
**kwargs: Text properties
其他参数: 设置文本属性
可设置的文本属性与参数取值如下:


其中红框圈出的是fontdict中定义的默认属性。
在坐标(x,y)添加注释文本

设置注释文本的字体


不解之处:
1. fontdict中 verticalalignment、horizontalalignment两个参数使用与效果呈现不理解
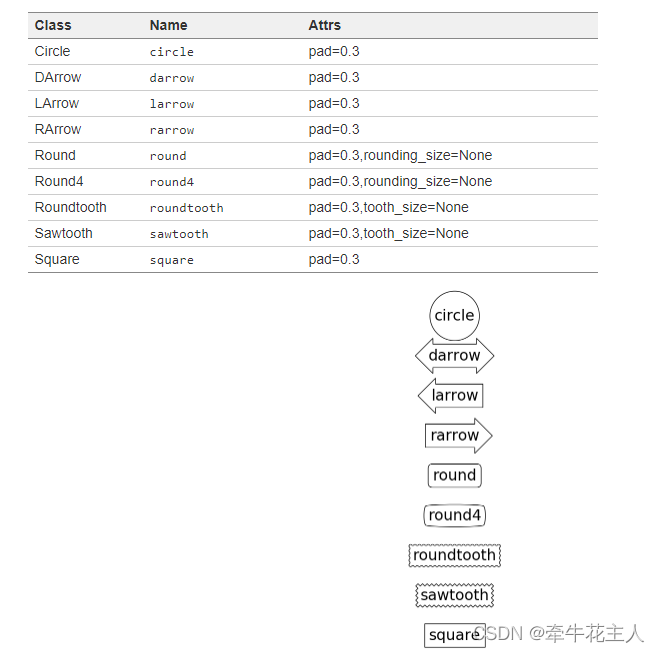
4. bbox功能
给注释文本增加边框
| 参数 | 含义 |
|---|---|
| boxstyle | 边框类型,常用参数:Square: 矩形框;Circle:圆形框;Round:圆角矩形框 |
| facecolor | 边框填充颜色 |
| alpha | 边框填充颜色的透明度 |
| edgecolor | 边框边界线颜色 |
| linewidth | 边框边界线宽度 |
| linestyle | 边框边界线线条风格 |
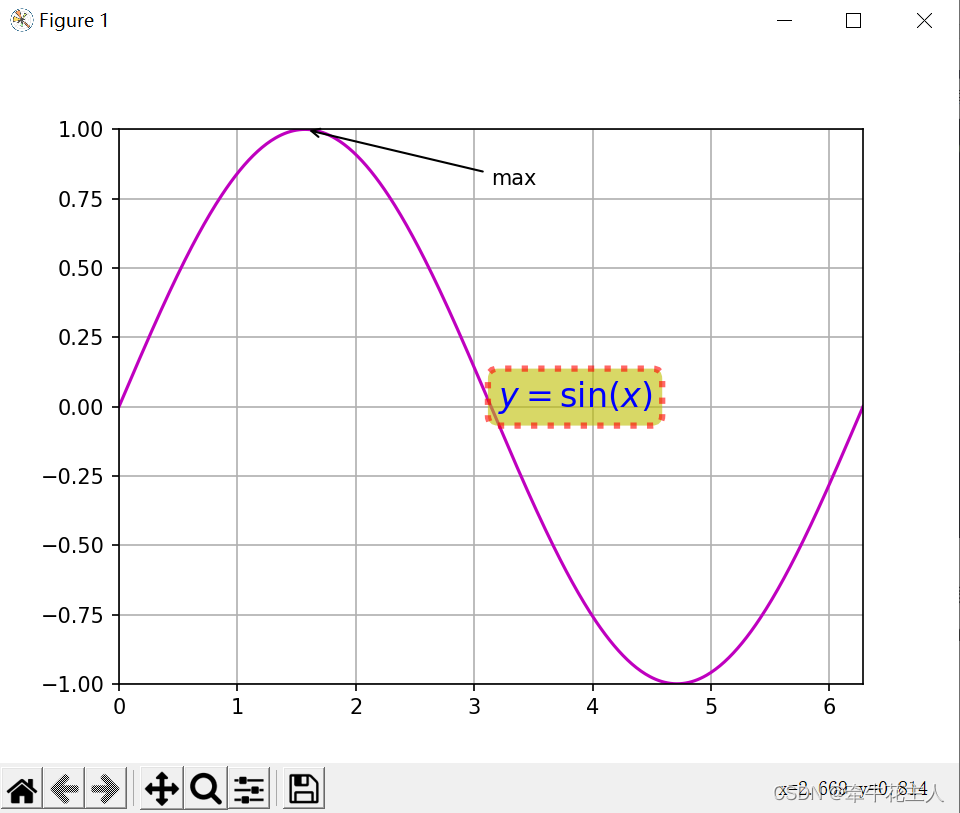
import matplotlib.pyplot as plt
import numpy as np

x = np.linspace(0, 2 * np.pi, 500)
y = np.sin(x)

plt.plot(x, y, c='m')

plt.xlim(0, 2 * np.pi)
plt.ylim(-1, 1)

plt.annotate('max', xy=(np.pi / 2, 1), xytext=(np.pi, 0.8),
             arrowprops=dict(arrowstyle='->',
                             connectionstyle='arc3'))
plt.text(3.2, 0, '$y=\sin(x)$', fontsize=16, color='b',
         bbox=dict(boxstyle='round', facecolor='y', alpha=0.6,
                   edgecolor='r', linestyle=':', linewidth=3))
plt.grid()
plt.show()
4.1 边框类型:bboxstyle
5. 常用参数总结与示例
| 参数 | 含义 |
|---|---|
| x,y | 注释文本的坐标 |
| s | 注释文本 |
| fontsize | 注释文本的字体大小 |
| color | 注释文本的颜色 |
| alpha | 注释文本的透明度 |
| backgroundcolor | 注释文本的背景颜色 |
| fontstyle | 注释文本的风格: ‘normal’; ‘italic’; ‘oblique’ |
| fontweight | 注释文本粗细 :常见取值有: 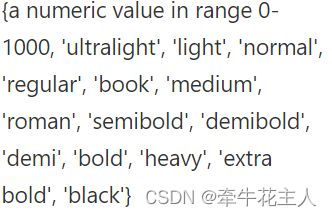 |
| rotation | 注释文本的旋转角度,取值为正值: 逆时针旋转;取值为负值: 顺时针旋转 |
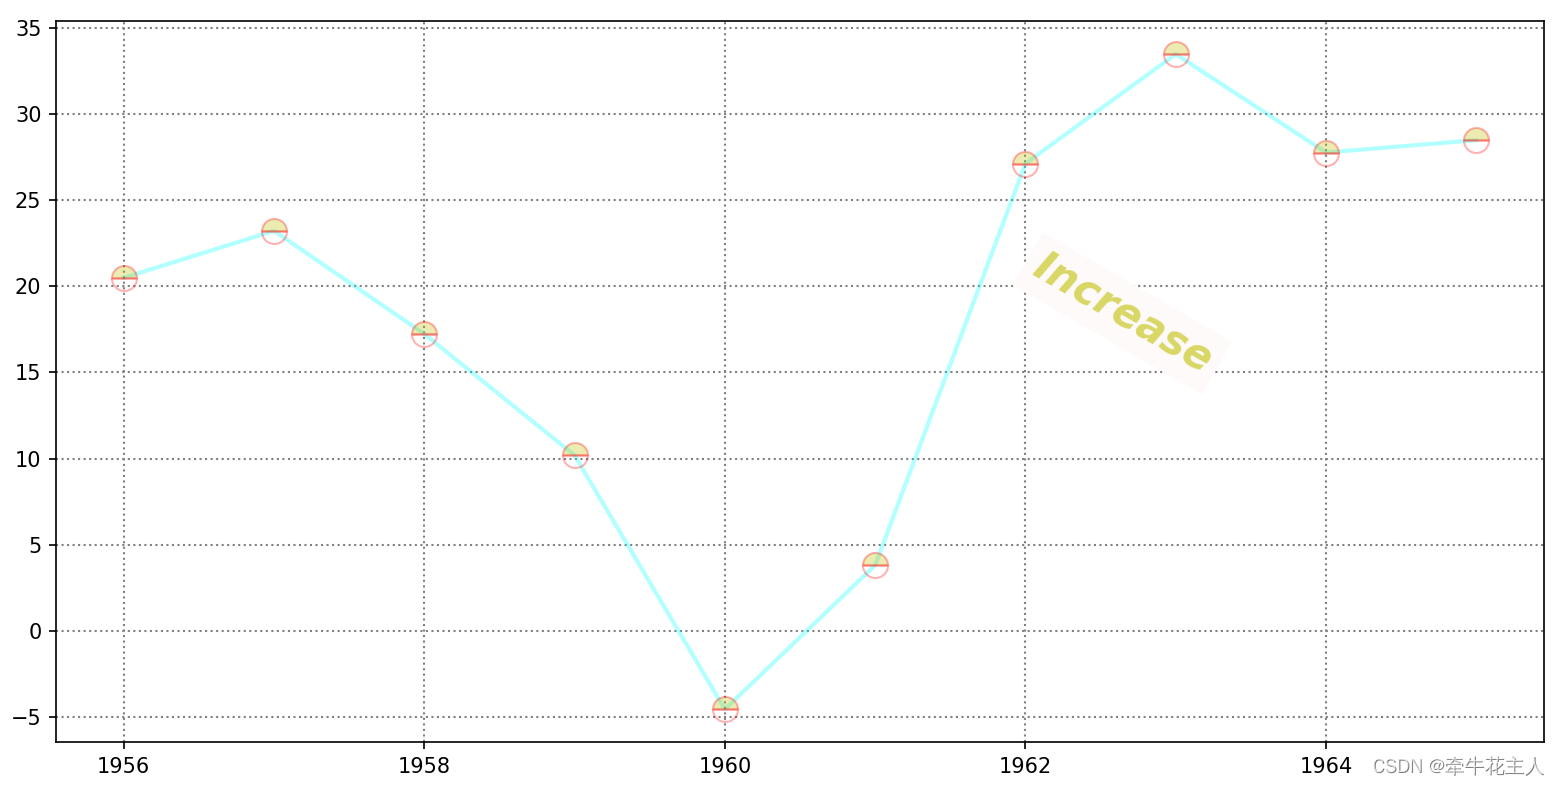
import numpy as np
import matplotlib.pyplot as plt

x = np.arange(1956, 1966)
y = [20.5, 23.23, 17.24, 10.19, -4.57,
     3.8, 27.14, 33.5, 27.78, 28.5, ]

plt.plot(x, y, c='cyan', ls='-', lw=2, alpha=0.3, marker='o',
         ms=12, fillstyle='top', mfc='y', mec='r', mew=1)

plt.text(1962, 15, 'Increase', fontsize=20, alpha=0.6,
         backgroundcolor='snow', color='y', fontstyle='oblique',
         fontweight='heavy', rotation=-30)

plt.grid(ls=':', lw=1, c='gray')

plt.show()
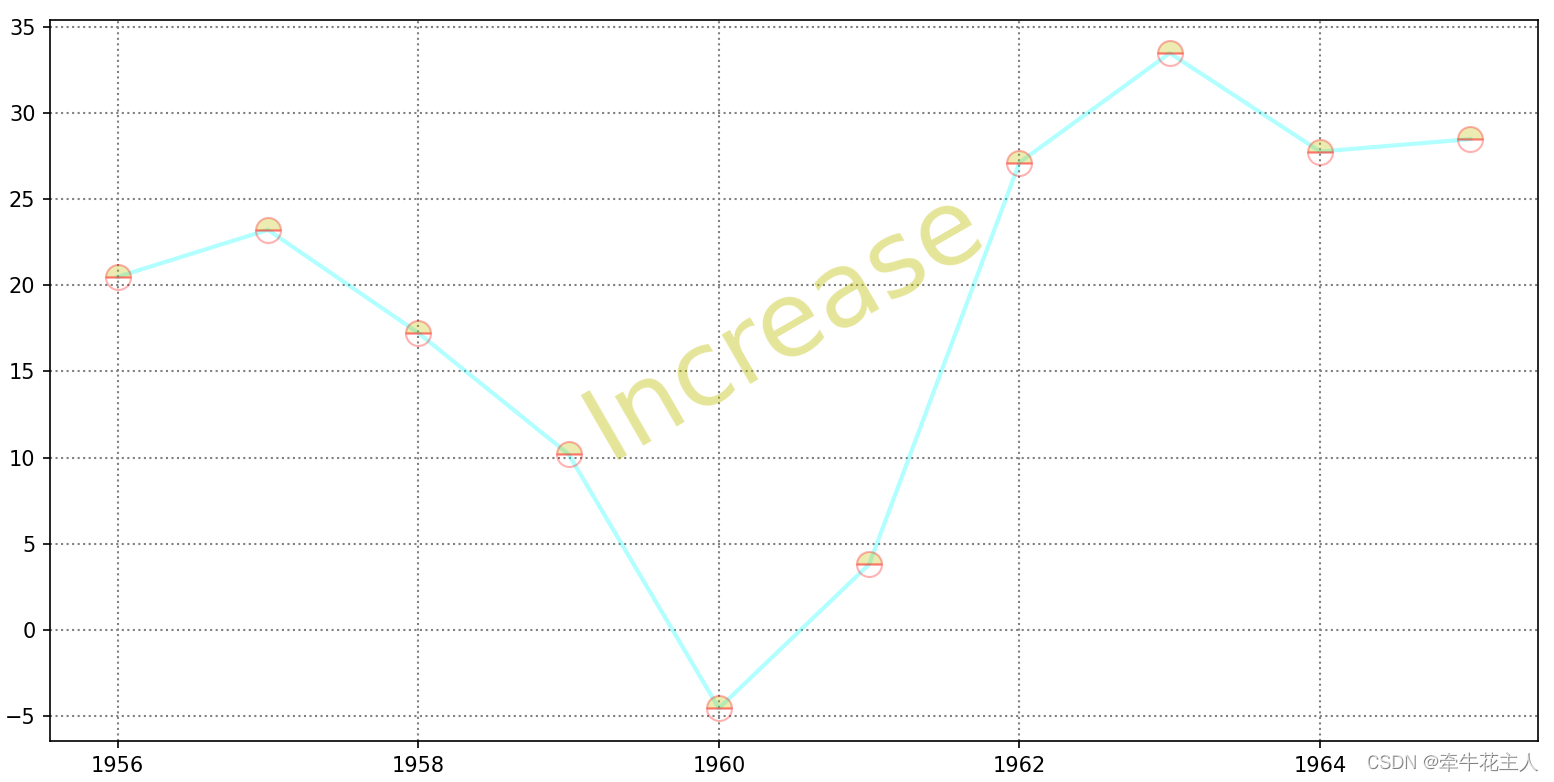
import numpy as np
import matplotlib.pyplot as plt

x = np.arange(1956, 1966)
y = [20.5, 23.23, 17.24, 10.19, -4.57,
     3.8, 27.14, 33.5, 27.78, 28.5, ]

plt.plot(x, y, c='cyan', ls='-', lw=2, alpha=0.3, marker='o',
         ms=12, fillstyle='top', mfc='y', mec='r', mew=1)

plt.text(1959, 10, 'Increase', fontsize=50, alpha=0.4,
         color='y', fontstyle='normal', fontweight='light', rotation=30)

plt.grid(ls=':', lw=1, c='gray')

plt.show()
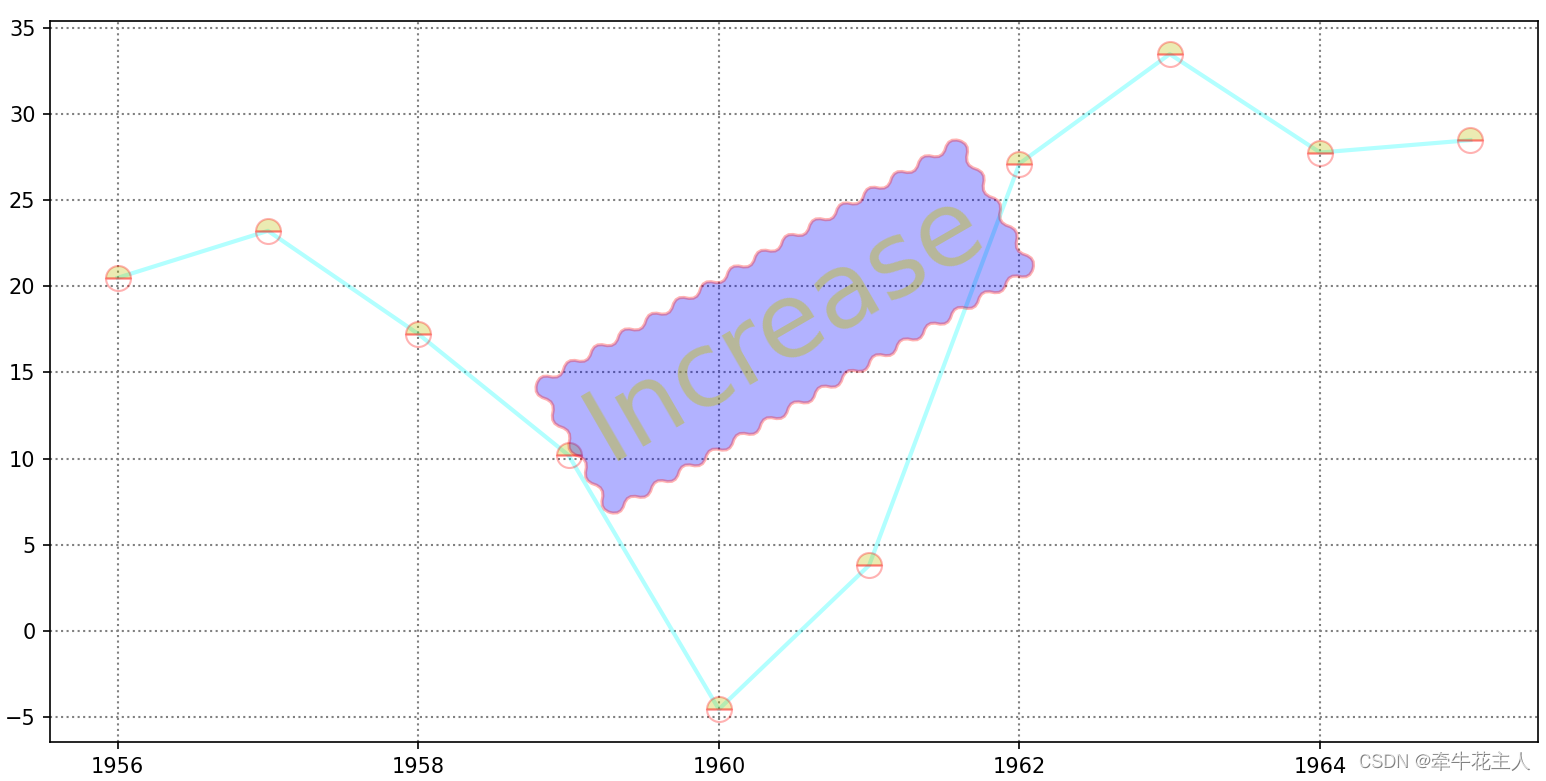
import numpy as np
import matplotlib.pyplot as plt

x = np.arange(1956, 1966)
y = [20.5, 23.23, 17.24, 10.19, -4.57,
     3.8, 27.14, 33.5, 27.78, 28.5, ]

plt.plot(x, y, c='cyan', ls='-', lw=2, alpha=0.3, marker='o',
         ms=12, fillstyle='top', mfc='y', mec='r', mew=1)

plt.text(1959, 10, 'Increase', fontsize=50, alpha=0.4,
         color='y', fontstyle='normal', fontweight='light', rotation=30,
         bbox=dict(boxstyle='roundtooth', edgecolor='r',facecolor='b',
                   alpha=0.3, linewidth=1.5)
         )

plt.grid(ls=':', lw=1, c='gray')

plt.show()
原文链接/参考文献:
[1] https://matplotlib.org/api/_as_gen/matplotlib.pyplot.text.html


 1342
1342

 被折叠的 条评论
为什么被折叠?
被折叠的 条评论
为什么被折叠?
 到【灌水乐园】发言


