


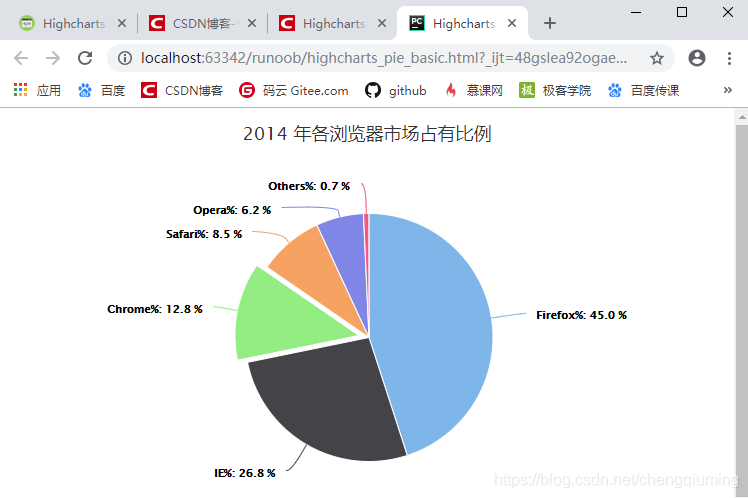
 本文展示了一个使用Highcharts库创建的基本饼图示例,图表显示了2014年各浏览器的市场占有率,包括Firefox、IE、Chrome、Safari、Opera和其他浏览器的数据分布。
一 代码
<html>
<head>
<meta charset="UTF-8" />
<title>Highcharts 基本饼图</title>
<script src="http://apps.bdimg.com/libs/jquery/2.1.4/jquery.min.js"></script>
<script src="http://code.highcharts.com/highcharts.js"></script>
</head>
<body>
<div id="container" style="width: 550px; height: 400px; margin: 0 auto"></div>
<script language="JavaScript">
$(document).ready(function() {
   var chart = {
       plotBackgroundColor: null,
       plotBorderWidth: null,
       plotShadow: false
   };
   // 主标题
   var title = {
      text: '2014 年各浏览器市场占有比例'
   };
   // 提示
   var tooltip = {
      pointFormat: '{series.name}: <b>{point.percentage:.1f}%</b>'
   };
   var plotOptions = {
      pie: {
         allowPointSelect: true,
         cursor: 'pointer',
         dataLabels: {
            enabled: true,
            format: '<b>{point.name}%</b>: {point.percentage:.1f} %',
            style: {
               color: (Highcharts.theme && Highcharts.theme.contrastTextColor) || 'black'
            }
         }
      }
   };
   // 数据
   var series= [{
      // 描述数据类型为饼图
      type: 'pie',
      name: 'Browser share',
      data: [
         ['Firefox',   45.0],
         ['IE',       26.8],
         {
            name: 'Chrome',
            y: 12.8,
            sliced: true,
            selected: true
         },
         ['Safari',    8.5],
         ['Opera',     6.2],
         ['Others',   0.7]
      ]
   }];

   var json = {};
   json.chart = chart;
   json.title = title;
   json.tooltip = tooltip;
   json.series = series;
   json.plotOptions = plotOptions;
   $('#container').highcharts(json);
});
</script>
</body>
</html>
二 运行结果


 203
203

 被折叠的 条评论
为什么被折叠?
被折叠的 条评论
为什么被折叠?
 到【灌水乐园】发言


