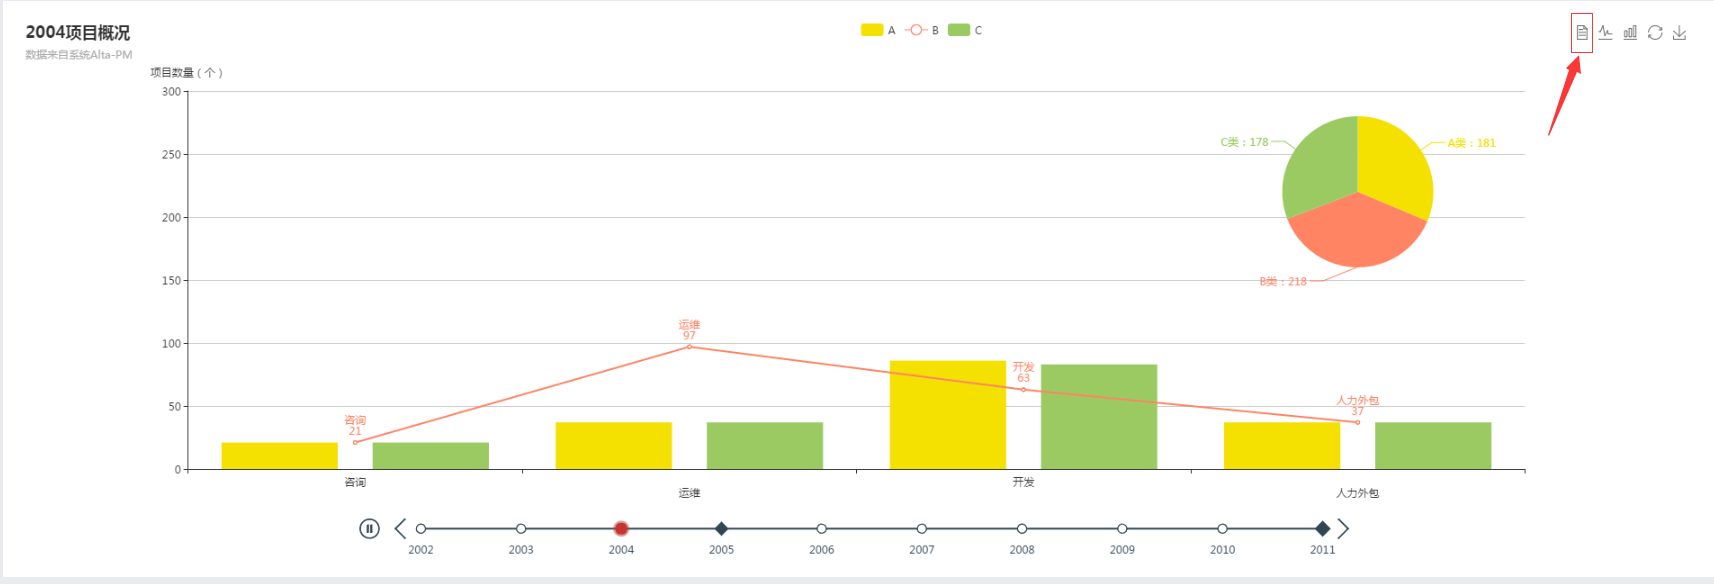
自定义echarts的toolbox事件(dataView表格)

原文出处:https://blog.youkuaiyun.com/u012890715/article/details/78857086
 

toolbox: {
                show : true,
                feature : {
                    mark : {show: true},
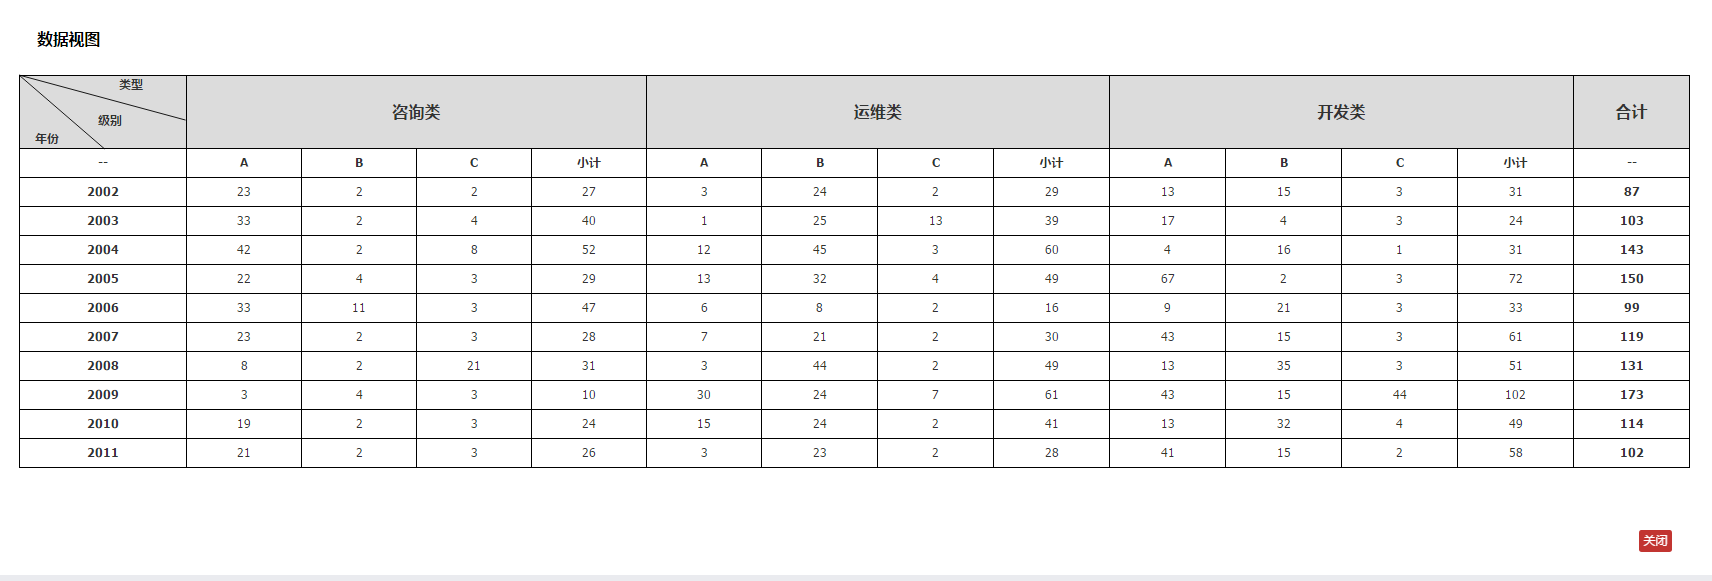
                    dataView : {
                    	show: true, readOnly: true,
                    	optionToContent : function(opt) {
                    		var table = $("#tableDiv").html();
                    		return table;
                    	}
                    },
                    magicType : {show: true, type: ['line', 'bar']},
                    restore : {show: true},
                    saveAsImage : {show: true}
                }
            }
<div id="tableDiv">
	    	<div id="lineDiv" style='position:absolute;z-index:9999;'></div>
		    <table cellspacing="0" cellpadding="0" style="border-collapse:collapse; width: 100%;margin-top: 20px;">
		      	<tr style="background-color: gainsboro;">
		          <th id="lineTd" style="border:#000000 solid 1px;width:10%;height:76px;" 
		          	points="[110,79,222,42,222,79]">                                 类型<br>
		          			         <br>                          级别<br>     年份</th>
		          <th style="text-align:center;border:#000000 solid 1px;height:45px;font-size: 18px;" colspan="4">咨询类</th>        
		          <th style="text-align:center;border:#000000 solid 1px;height:45px;font-size: 18px;" colspan="4">运维类</th>        
		          <th style="text-align:center;border:#000000 solid 1px;height:45px;font-size: 18px;" colspan="4">开发类</th>        
		          <th style="text-align:center;border:#000000 solid 1px;height:45px;font-size: 18px;">合计</th>        
		        </tr>
		        <tr>
		            <th style="text-align:center;border:#000000 solid 1px;width:89px;height:32px;">--</th>
		            <th style="text-align:center;border:#000000 solid 1px;width:89px;height:32px;">A</th>
		            <th style="text-align:center;border:#000000 solid 1px;width:89px;height:32px;">B</th>
		            <th style="text-align:center;border:#000000 solid 1px;width:89px;height:32px;">C</th>
		            <th style="text-align:center;border:#000000 solid 1px;width:89px;height:32px;">小计</th>
		            <th style="text-align:center;border:#000000 solid 1px;width:89px;height:32px;">--</th>
		        </tr>
		    </table>
	    </div>


要优化饼图的dataView中的样式,可以通过以下步骤进行: 1. 在echarts实例化的时候,设置dataView的参数,例如: ```javascript var myChart = echarts.init(document.getElementById('main')); myChart.setOption({ toolbox: { feature: { dataView: { show: true, title: '数据视图', readOnly: true, lang: ['数据视图', '关闭', '刷新'], optionToContent: function(opt) { var axisData = opt.series[0].data; var html = '<table style="width:100%;text-align:center"><tbody><tr><td>名称</td><td>值</td></tr>'; for (var i = 0, l = axisData.length; i < l; i++) { html += '<tr><td>' + axisData[i].name + '</td><td>' + axisData[i].value + '</td></tr>'; } html += '</tbody></table>'; return html; } } } }, series: [{ name: '访问来源', type: 'pie', radius: '55%', data: [{ value: 335, name: '直接访问' }, { value: 310, name: '邮件营销' }, { value: 234, name: '联盟广告' }, { value: 135, name: '视频广告' }, { value: 1548, name: '搜索引擎' } ] }] }); ``` 2. 在optionToContent函数中,可以自定义生成的html代码,样式可以通过css设置,例如: ```javascript optionToContent: function(opt) { var axisData = opt.series[0].data; var html = '<table style="width:100%;text-align:center"><tbody><tr><td>名称</td><td>值</td></tr>'; for (var i = 0, l = axisData.length; i < l; i++) { html += '<tr><td>' + axisData[i].name + '</td><td>' + axisData[i].value + '</td></tr>'; } html += '</tbody></table>'; html = '<div style="font-size:14px;color:#333">' + html + '</div>'; return html; } ``` 在这里,我设置了表格的居中和字体颜色,同时在外层包裹了一个div,设置了字体大小。 3. 如果需要更加复杂的样式,可以使用JavaScript或jQuery来进行修改。例如,通过jQuery来修改table的样式: ```javascript optionToContent: function(opt) { var axisData = opt.series[0].data; var html = '<table><tbody><tr><td>名称</td><td>值</td></tr>'; for (var i = 0, l = axisData.length; i < l; i++) { html += '<tr><td>' + axisData[i].name + '</td><td>' + axisData[i].value + '</td></tr>'; } html += '</tbody></table>'; html = '<div style="font-size:14px;color:#333">' + html + '</div>'; $(html).find('table').css({ 'border': '1px solid #ccc', 'border-collapse': 'collapse', 'width': '100%', 'text-align': 'center' }); $(html).find('th,td').css({ 'border': '1px solid #ccc', 'padding': '5px' }); return html; } ``` 在这里,我使用了jQuery来选取生成的html中的table元素,并设置了边框、宽度和居中对齐等样式。
评论 1
添加红包

请填写红包祝福语或标题

红包个数最小为10个

红包金额最低5元

当前余额3.43前往充值 >
需支付:10.00
成就一亿技术人!
领取后你会自动成为博主和红包主的粉丝 规则
hope_wisdom
发出的红包
实付
使用余额支付
点击重新获取
扫码支付
钱包余额 0

抵扣说明:

1.余额是钱包充值的虚拟货币,按照1:1的比例进行支付金额的抵扣。
2.余额无法直接购买下载,可以购买VIP、付费专栏及课程。

余额充值