


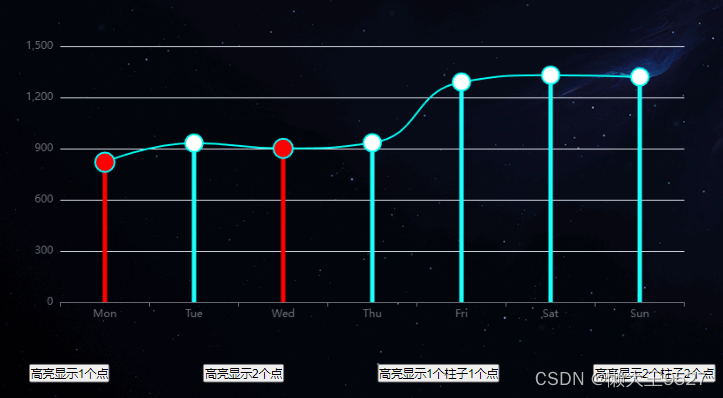
需求:实现当用户点击 ECharts 中的某个图表之外的按钮时,图表中的两个折线点的图形颜色高亮显示或者两个柱子高亮显示,实现这个功能其实很简单,ECharts 官网有 Api 可实现,方法如下:
// 如果要高亮系列:
dispatchAction({
  type: 'highlight'
  // 用 index 或 id 或 name 来指定系列。
  // 可以使用数组指定多个系列。
  seriesIndex?: number | number[],
  seriesId?: string | string[],
  seriesName?: string | string[]
  // 数据项的 index,如果不指定也可以通过 name 属性根据名称指定数据项
  dataIndex?: number | number[],
  // 可选,数据项名称,在有 dataIndex 的时候忽略
  name?: string | string[],
});
简单示例实现代码如下:
创建一个有柱图和折线图的组件 lineChart.vue
<template>
  <div>
    <div ref="chart" style="height: 420px"></div>
    <div style="display: flex; justify-content: space-around">
      <button @click="showPoints1">高亮显示1个点</button>
      <button @click="showPoints2">高亮显示2个点</button>
      <button @click="showPoints3">高亮显示1个柱子1个点</button>
      <button @click="showPoints4">高亮显示2个柱子2个点</button>
    </div>
  </div>
</template>

<script>
export default {
  data() {
    return {
      chartInstance: null,
      currentHighLigh: {
        seriesIndex: [],
        dataIndex: []
      }
    };
  },
  mounted() {
    this.setChartOption();
  },
  methods: {
    setChartOption() {
      this.chartInstance = this.$echarts.init(this.$refs.chart);
      const option = {
        xAxis: {
          type: "category",
          data: ["Mon", "Tue", "Wed", "Thu", "Fri", "Sat", "Sun"],
        },
        yAxis: {
          type: "value",
        },
        series: [
          {
            data: [820, 932, 901, 934, 1290, 1330, 1320],
            type: "line",
            smooth: true,
            symbolSize: 20,
            itemStyle: {
              normal: {
                color: "#00FFF6",
                borderColor: "#00FFF6",
                borderWidth: 2,
                lineStyle: {
                  color: "#00FFF6", // 折线颜色
                },
              },
              emphasis: {
                color: "red", // 鼠标悬浮时圆点颜色
              },
            },
          },
          {
            type: "bar",
            barWidth: 5,
            tooltip: {
              show: false,
            },
            label: {
              show: false,
              position: "top",
              color: "#fff",
            },
            itemStyle: {
              normal: {
                color: "#1cfffb",
                lineStyle: {
                  width: 5,
                  color: "#1cfffb", // 折线颜色
                },
              },
              emphasis: {
                color: "red", // 鼠标悬浮时圆点颜色
              },
            },
            data: [820, 932, 901, 934, 1290, 1330, 1320],
          },
        ],
      };
      option && this.chartInstance.setOption(option);
    },
    highlightPoints(seriesIndex, dataIndexes) {
      this.chartInstance.dispatchAction({
        type: "highlight",
        seriesIndex: seriesIndex,
        dataIndex: dataIndexes,
      });
    },
    showPoints1() {
      // 如果有高亮,先取消高亮
      this.hiddenPoints();
      this.currentHighLigh = {
        seriesIndex: [0],
        dataIndex: [1]
      }
      // 假设我们要高亮第一个系列中的第一个和第三个点
      // this.highlightPoints(0, [0, 2]);

      // 假设我们要高亮第二个系列中的第二个和第四个点
      // this.highlightPoints(1, [1, 3]);

      // 假设我们要高亮第一个系列和第二个系列中的第一个和第三个点
      // this.highlightPoints([0, 1], [0, 2]);

      // 假设我们要高亮第一个系列中的第二个点
      this.highlightPoints(0, 1);
    },
    showPoints2() {
      // 如果有高亮,先取消高亮
      this.hiddenPoints();
      this.currentHighLigh = {
        seriesIndex: 0,
        dataIndex: [0, 2]
      }
      // 假设我们要高亮第一个系列中的第一个和第三个点
      this.highlightPoints(0, [0, 2]);
    },
    showPoints3() {
      // 如果有高亮,先取消高亮
      this.hiddenPoints();
      this.currentHighLigh = {
        seriesIndex: [0, 1],
        dataIndex: [2]
      }
      // 假设我们要高亮第二个系列中的第三个柱子
      this.highlightPoints([0, 1], 2);
    },
    showPoints4() {
      // 如果有高亮,先取消高亮
      this.hiddenPoints();
      this.currentHighLigh = {
        seriesIndex: [0, 1],
        dataIndex: [0, 2]
      }
      // 假设我们要高亮第一个系列和第二个系列中的第一个和第三个点
      this.highlightPoints([0, 1], [0, 2]);
    },
    // 取消高亮
    hiddenPoints() {
      // 如取消高亮系列:
      this.chartInstance.dispatchAction({
          type: 'downplay',
          // 可以使用数组指定多个系列。
          seriesIndex: this.currentHighLigh.seriesIndex,
          // 数据项的 index,如果不指定也可以通过 name 属性根据名称指定数据项
          dataIndex: this.currentHighLigh.dataIndex
      })
    }
  },
};
</script>

<style scoped>
/* 你的样式 */
</style>
欢迎收看!


 到【灌水乐园】发言


