


 这篇博客探讨了如何利用Python进行数据可视化,重点在于如何展示和操作图片以及创建子图。通过实例,读者将学习到如何有效地利用Python库展示多个图像并组织成子图,从而增强数据的解释力。
In [33]: import matplotlib.pyplot as plt

In [37]: %matplotlib
Using matplotlib backend: Qt5Agg

In [35]: data
Out[35]: array([0, 1, 2, 3, 4, 5, 6, 7, 8, 9])
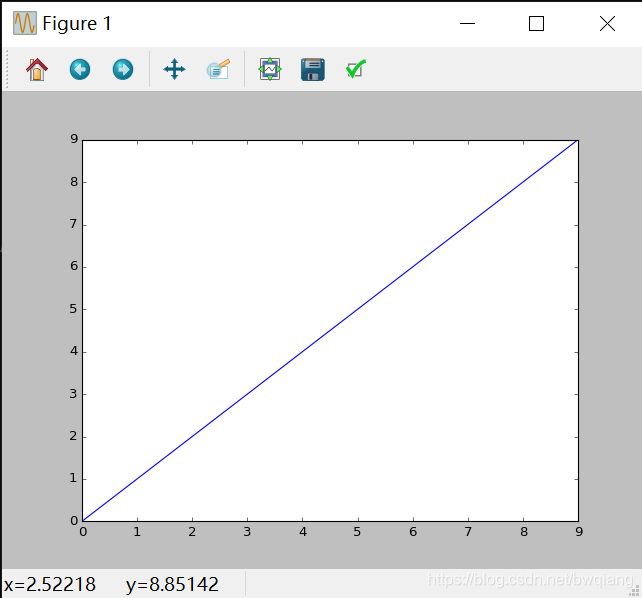
使用plt.show()显示所有图片。
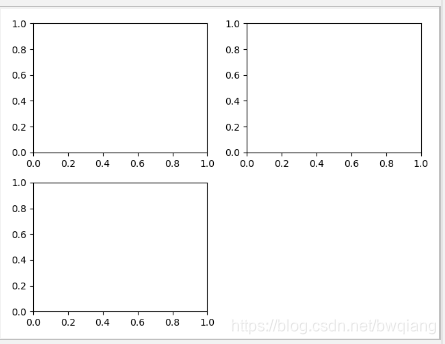
图片与子图
# 产生空白图片,显示出来
In [40]: fig = plt.figure()

In [51]: ax1 = fig.add_subplot(2,2,1)

In [52]: ax2 = fig.add_subplot(2,2,2)

In [53]: ax3 = fig.add_subplot(2,2,3)
# 画图显示 如下图
In [59]: plt.plot([1.5, 3.5, -2, 1.6])
Out[59]: [<matplotlib.lines.Line2D at 0x20fb5210e48>]
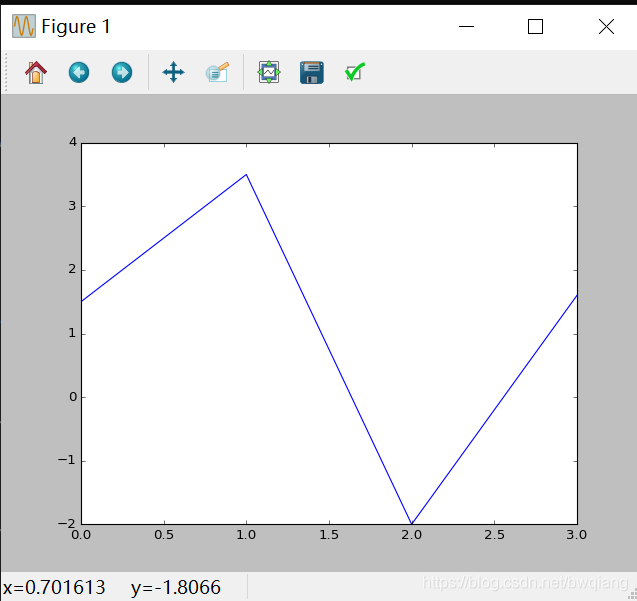
# 'k--’是用于绘制黑色分段线的style选项
In [62]
最低0.47元/天 解锁文章


 被折叠的 条评论
为什么被折叠?
被折叠的 条评论
为什么被折叠?
 到【灌水乐园】发言


