


 本文介绍Golang的pprof工具,用于分析程序的堆栈和CPU信息。通过源码示例展示如何使用pprof,包括设置HTTP服务提供性能数据,以及如何通过网页和命令行查看堆栈和CPU性能详情。
[golang]pprof性能分析工具
2017年08月11日 14:02:22 moxiaomomo 阅读数:9133 标签: golangpprof 更多
个人分类: Golang
版权声明:本文为博主原创文章,未经博主允许不得转载。 https://blog.youkuaiyun.com/moxiaomomo/article/details/77096814
1. 关于pprof
pprof是golang程序一个性能分析的工具,可以查看堆栈、cpu信息等。
2. 源码示例
package main

import (
    "flag"
    "log"
    "net/http"
    _ "net/http/pprof"
    "sync"
    "time"
)

func Counter(wg *sync.WaitGroup) {
    time.Sleep(time.Second)

    var counter int
    for i := 0; i < 1000000; i++ {
        time.Sleep(time.Millisecond * 200)
        counter++
    }
    wg.Done()
}

func main() {
    flag.Parse()

    //远程获取pprof数据
    go func() {
        log.Println(http.ListenAndServe("localhost:8080", nil))
    }()

    var wg sync.WaitGroup
    wg.Add(10)
    for i := 0; i < 10; i++ {
        go Counter(&wg)
    }
    wg.Wait()

    // sleep 10mins, 在程序退出之前可以查看性能参数.
    time.Sleep(60 * time.Second)
}
3. 编译运行
go run test_pprof.go- 1
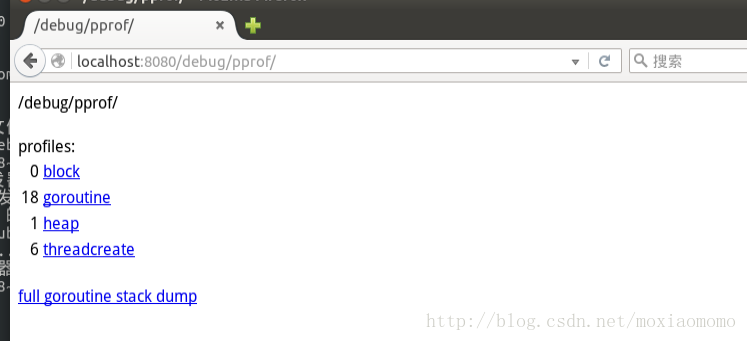
4. 通过网页查看overview
5. 通过终端命令查看各参数
查看堆栈信息
root@XIAOMO:~# go tool pprof http://localhost:8080/debug/pprof/heap
Fetching profile from http://localhost:8080/debug/pprof/heap
Saved profile in /root/pprof/pprof.localhost:8080.inuse_objects.inuse_space.003.pb.gz
Entering interactive mode (type "help" for commands)
(pprof) top10
1069.45kB of 1069.45kB total (  100%)
Showing top 10 nodes out of 11 (cum >= 512.19kB)
      flat  flat%   sum%        cum   cum%
  557.26kB 52.11% 52.11%   557.26kB 52.11%  html.init
  512.19kB 47.89%   100%   512.19kB 47.89%  runtime.malg
         0     0%   100%   557.26kB 52.11%  html/template.init
         0     0%   100%   557.26kB 52.11%  main.init
         0     0%   100%   557.26kB 52.11%  net/http/pprof.init
         0     0%   100%   557.26kB 52.11%  runtime.goexit
         0     0%   100%   557.26kB 52.11%  runtime.main
         0     0%   100%   512.19kB 47.89%  runtime.mcommoninit
         0     0%   100%   512.19kB 47.89%  runtime.mpreinit
         0     0%   100%   512.19kB 47.89%  runtime.rt0_go
(pprof) web
top10命令查看了堆栈空间最大的10个函数调用;
web明令则生成了很详细的图, 如下: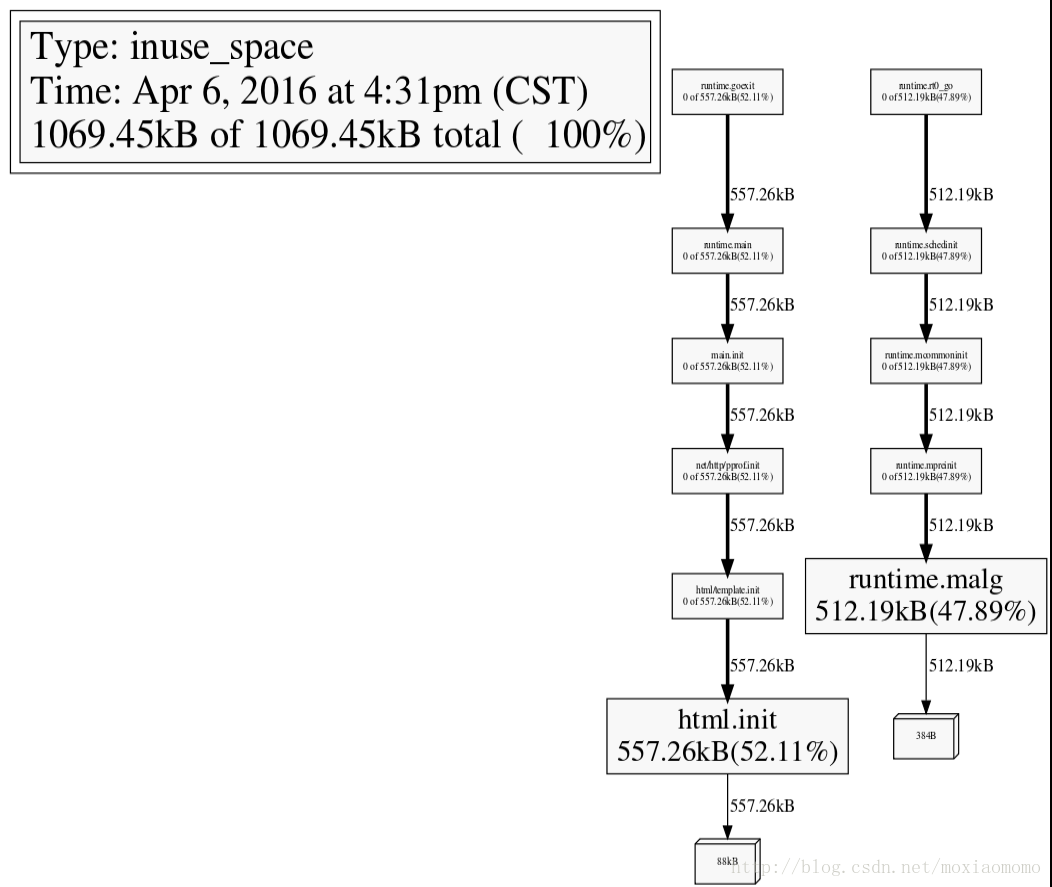
查看cpu性能信息
root@xiaomo:~$ go tool pprof http://localhost:8080/debug/pprof/profile
Fetching profile from http://localhost:8080/debug/pprof/profile
Please wait... (30s)
Saved profile in /home/xiaomo/pprof/pprof.pprof.localhost:8080.samples.cpu.001.pb.gz
Entering interactive mode (type "help" for commands)
(pprof) web
输入命令web后生成详细结果,如下图所示: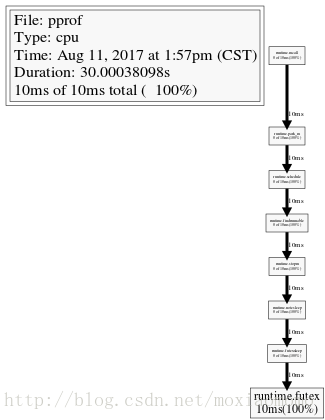


 97
97

 被折叠的 条评论
为什么被折叠?
被折叠的 条评论
为什么被折叠?
 到【灌水乐园】发言


