


 本文介绍如何利用R语言中的ggplot2包来绘制钻石数据集的密度图,并展示了不同属性下的可视化效果。
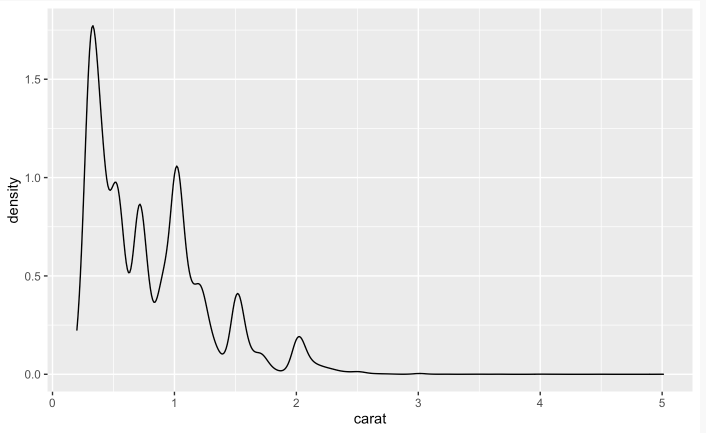
diamonds 是内置数据集
library(ggplot2)
ggplot(diamonds, aes(carat)) +
  geom_density()
ggplot(diamonds, aes(depth, colour = cut)) +
  geom_density() +
  xlim(55, 70)
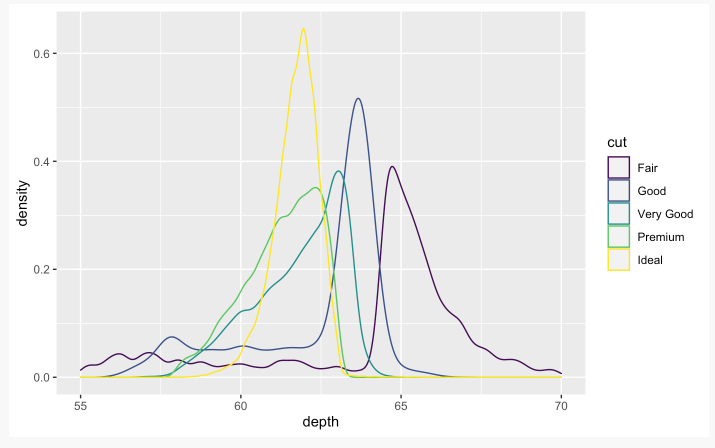
更多示例: https://ggplot2.tidyverse.org/reference/geom_density.html#examples


 2075
2075

 被折叠的 条评论
为什么被折叠?
被折叠的 条评论
为什么被折叠?
 到【灌水乐园】发言


