


 本文详细解析了气象数据可视化配置文件的结构与参数设置,包括蒸发量、降水量及平均温度的图标展示方式,底部与左侧的位置设定,以及图例高度的调整。通过这些配置,可以实现对气象数据的有效可视化呈现。
legend: [
{
itemWidth: 33,
data: [
{
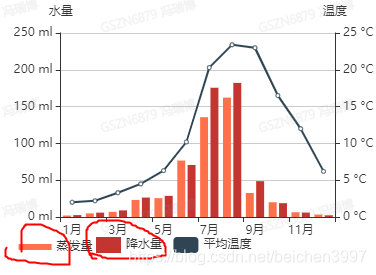
name: "蒸发量",
icon: "rect"
}
],
bottom: "5%",
left: "3%",
itemHeight: 6
},
{
data: [
{
name: "降水量",
icon: "rect"
}
],
bottom: "5%",
left: "23%",
itemHeight: 16},
{ data: [
{
name: "平均温度",
icon: "roundRect"
}
],
bottom: "5%",
left: "43%",
itemHeight: 16}
],


 6047
6047

 被折叠的 条评论
为什么被折叠?
被折叠的 条评论
为什么被折叠?
 到【灌水乐园】发言


