


 本文全面介绍了Elasticsearch,它是基于Lucene的分布式全文搜索和数据分析引擎。与MySQL相比,它在响应时间、分词、相关性方面有优势。文中还阐述了其基础概念、架构,介绍了安装部署方法,以及在搜索、门户等场景的应用,最后列举了常用命令和控制台、可视化、仪表盘的使用。
一、什么是Elasticsearch
Elasticsearch 是一个高度可扩展的、开源的、基于 Lucene 的分布式、RESTful 风格的全文搜索和数据分析引擎。 作为 Elastic Stack 的核心,Elasticsearch使用Java开发并使用 Lucene 作为其核心来实现所有索引和搜索的功能,通过简单的 RESTful API 来隐藏 Lucene 的复杂性,从而让全文搜索变得简单。
二、为什么使用Elasticsearch
- 响应时间
mysql:当数据库中数据仅为上万条时,关键词查询就比较慢了
elasticsearch:基于倒排索引的,因此检索速度得到了量级的提升
- 分词
mysql:组合词检索在数据库是很难完成的
elasticsearch:因为支持中文分词插件,所以很好地解决了问题
- 相关性
mysql:数据库并不支持相关性搜索.
例如,当用户搜索"咖啡厅"的时候,他很可能更想知道附近哪里可以喝咖啡,而不是怎么开咖啡厅.
elasticsearch:支持全文搜索和相关度评分.这样在返回结果就会根据分数由高到低排列.分数越高,
意味着和查询语句越相关.
例如,当用户搜索“星巴克咖啡”,带有“星巴克咖啡”的信息就要比只包含“咖啡”的信息靠前。
三、Elasticsearch可以做什么
1、定义自己的搜索方式
通过 Elasticsearch,您能够执行及合并多种类型的搜索(结构化数据、非结构化数据、地理位置、指标),搜索方式随心而变。
基于各项元素(从词频或新近度到热门度等)对搜索结果进行排序。将这些内容与功能进行混搭,以优化向用户显示结果的方式。
而且,由于我们的大部分用户都是真实的人,Elasticsearch 具备齐全功能,可以处理包括各种复杂情况(例如拼写错误)在内的人为错误。
2、分析大规模数据
找到与查询最匹配的 10 个文档并不困难。但如果面对的是十亿行日志,又该如何解读呢?Elasticsearch 聚合让您能够从大处着眼,探索数据的趋势和规律,原型环境和生产环境可无缝切换;无论 Elasticsearch 是在一个节点上运行,还是在一个包含 300 个节点的集群上运行,都能够以相同的方式与 Elasticsearch 进行通信。
它能够水平扩展,每秒钟可处理海量事件,同时能够自动管理索引和查询在集群中的分布方式,以实现极其流畅的操作。
3、分布式自动检测
硬件故障。网络分割。Elasticsearch 为您检测这些故障并确保您的集群(和数据)的安全性和可用性。通过跨集群复制功能,辅助集群可以作为热备份随时投入使用。Elasticsearch 运行在一个分布式的环境中,从设计之初就考虑到了这一点,目的只有一个,让您永远高枕无忧。
全文本搜索只是全球众多公司利用 Elasticsearch 解决各种挑战的冰山一角,Elasticsearch数字、文本、地理位置、结构化数据、非结构化数据。适用于所有数据类型。
4、关系型数据库对比分析
- Mysql
ES数据架构的主要概念(与关系数据库Mysql对比)

(1)关系型数据库中的数据库(DataBase),等价于ES中的索引(Index)
(2)一个数据库下面有N张表(Table),等价于1个索引Index下面有N多类型(Type),
(3)一个数据库表(Table)下的数据由多行(ROW)多列(column,属性)组成,等价于1个Type由多个文档(Document)和多Field组成。
(4)在一个关系型数据库里面,schema定义了表、每个表的字段,还有表和字段之间的关系。 与之对应的,在ES中:Mapping定义索引下的Type的字段处理规则,即索引如何建立、索引类型、是否保存原始索引JSON文档、是否压缩原始JSON文档、是否需要分词处理、如何进行分词处理等。
(5)在数据库中的增insert、删delete、改update、查search操作等价于ES中的增PUT/POST、删Delete、改_update、查GET.。
四、Elasticsearch基础概念
1. ElaticSearch 和 DB 的关系
Elasticsearch 中,文档归属于一种类型 type,而这些类型存在于索引 index 中,我们可以列一些简单的不同点,来类比传统关系型数据库:
Relational DB -> Databases -> Tables -> Rows -> Columns
Elasticsearch -> Indices -> Types -> Documents -> Fields
Elasticsearch 集群可以包含多个索引 indices,每一个索引可以包含多个类型 types,每一个类型包含多个文档 documents,然后每个文档包含多个字段 Fields。而在 DB 中可以有多个数据库 Databases,每个库中可以有多张表 Tables,没个表中又包含多行Rows,每行包含多列Columns。
2. 索引
消索引基本概念(indices):
索引是含义相同属性的文档集合,是 ElasticSearch 的一个逻辑存储,可以理解为关系型数据库中的数据库,ElasticSearch 可以把索引数据存放到一台服务器上,也可以 sharding 后存到多台服务器上,每个索引有一个或多个分片,每个分片可以有多个副本。
索引类型(index_type):
索引可以定义一个或多个类型,文档必须属于一个类型。在 ElasticSearch 中,一个索引对象可以存储多个不同用途的对象,通过索引类型可以区分单个索引中的不同对象,可以理解为关系型数据库中的表。每个索引类型可以有不同的结构,但是不同的索引类型不能为相同的属性设置不同的类型。
3. 文档
文档(document):
文档是可以被索引的基本数据单位。存储在 ElasticSearch 中的主要实体叫文档 document,可以理解为关系型数据库中表的一行记录。每个文档由多个字段构成,ElasticSearch 是一个非结构化的数据库,每个文档可以有不同的字段,并且有一个唯一的标识符。
4. 映射
映射(mapping):
ElasticSearch 的 Mapping 非常类似于静态语言中的数据类型:声明一个变量为 int 类型的变量,以后这个变量都只能存储 int 类型的数据。同样的,一个 number 类型的 mapping 字段只能存储 number 类型的数据。
同语言的数据类型相比,Mapping 还有一些其他的含义,Mapping 不仅告诉 ElasticSearch 一个 Field 中是什么类型的值, 它还告诉 ElasticSearch 如何索引数据以及数据是否能被搜索到。
ElaticSearch 默认是动态创建索引和索引类型的 Mapping 的。这就相当于无需定义 Solr 中的 Schema,无需指定各个字段的索引规则就可以索引文件,很方便。但有时方便就代表着不灵活。比如,ElasticSearch 默认一个字段是要做分词的,但我们有时要搜索匹配整个字段却不行。如有统计工作要记录每个城市出现的次数。对于 name 字段,若记录 new york 文本,ElasticSearch 可能会把它拆分成 new 和 york 这两个词,分别计算这个两个单词的次数,而不是我们期望的 new york。
3. 文档
消息发送者可以发送一个消息而无须等待响应。消息发送者将消息发送到一条虚拟的通道(主题或者队列)上,消息接收者则订阅或者监听该通道。一条消息可能最终转发给一个或多个消息接收者,这些接收者都无需对消息发送者做出同步回应。整个过程是异步的。
3. 文档
消息发送者可以发送一个消息而无须等待响应。消息发送者将消息发送到一条虚拟的通道(主题或者队列)上,消息接收者则订阅或者监听该通道。一条消息可能最终转发给一个或多个消息接收者,这些接收者都无需对消息发送者做出同步回应。整个过程是异步的。
五、Elasticsearch通常用于什么场景
1. 搜索领域:如百度、谷歌,全文检索等。
2. 门户网站:访问统计、文章点赞、留言评论等。
3. 广告推广:记录员工行为数据、消费趋势、员工群体进行定制推广等。
4. 信息采集:记录应用的埋点数据、访问日志数据等,方便大数据进行分析。
六、Elasticsearch架构介绍
ElasticSearch 架构图如下所示:

从下往上来分析ElasticSearch 架构图
Gateway,代表ElasticSearch索引的持久化存储方式。
在Gateway中,ElasticSearch默认先把索引存储在内存中,然后当内存满的时候,再持久化到Gateway里。当ES集群关闭或重启的时候,它就会从Gateway里去读取索引数据。比如LocalFileSystem和HDFS、AS3等。
DistributedLucene Directory,它是Lucene里的一些列索引文件组成的目录。它负责管理这些索引文件。包括数据的读取、写入,以及索引的添加和合并等。
River,代表是数据源。是以插件的形式存在于ElasticSearch中。
Mapping,映射的意思,非常类似于静态语言中的数据类型。
比如我们声明一个int类型的变量,那以后这个变量只能存储int类型的数据。比如我们声明一个double类型的mapping字段,则只能存储double类型的数据。
Mapping不仅是告诉ElasticSearch,哪个字段是哪种类型。还能告诉ElasticSearch如何来索引数据,以及数据是否被索引到等。
Search Moudle,搜索模块
Index Moudle,索引模块
Disvcovery,主要是负责集群的master节点发现。比如某个节点突然离开或进来的情况,进行一个分片重新分片等。这里有个发现机制。发现机制默认的实现方式是单播和多播的形式,即Zen,同时也支持点对点的实现。另外一种是以插件的形式,即EC2。
Scripting,即脚本语言。包括很多,这里不多赘述。如mvel、js、python等。
Transport,代表ElasticSearch内部节点,代表跟集群的客户端交互。包括 Thrift、Memcached、Http等协议
RESTful Style API,通过RESTful方式来实现API编程。
3rd plugins,代表第三方插件。
Java(Netty),是开发框架。
JMX,是监控。
七、Elasticsearch安装部署
1.单节点安装部署
1. 前面说到,Elasticsearch是基于java开发的,所以安装Elasticsearch必须有java环境,对于elasticsearch官网提供的安装包分为2类:有java环境的与无java环境的。对于elasticsearch与jvm的版本支持关系如下图(访问https://www.elastic.co/cn/support/matrix#matrix_os可以详细知道elasticsearch运行的环境要求——操作系统、jvm、产品兼容等信息):
2. 下载Elasticsearch7.5.2(这里下载的是window版本,可根据自己的需求选择下载什么版本),下载地址:https://www.elastic.co/cn/downloads/elasticsearch;国内下载地址:https://elasticsearch.cn/download/,使用迅雷下载比较快
3. 解压下载的window压缩包,进入命令窗口,切换目录至解压后文件的bin目录下,执行elasticsearch.bat命令启动elasticsearch。
4. 启动完成后,访问127.0.0.1:9200进行访问,验证是否启动成功。
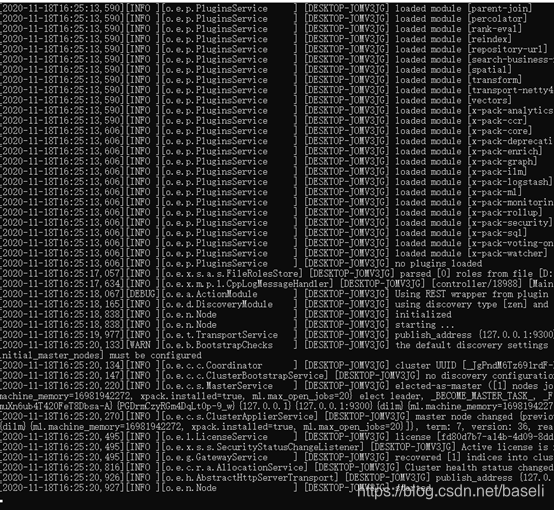
如果一切顺利,你将会看到下面的一堆信息:
输入127.0.0.1:9200访问页面

需要注意一下我们的节点是否能绑定到ip地址(192.168.8.112)和端口(9200)。elasticsearch默认使用端口9200去接入REST API。我这里将端口改为了19200,你可以保持默认,后面在多节点安装部署中会详细介绍各个参数配置位置和描述。
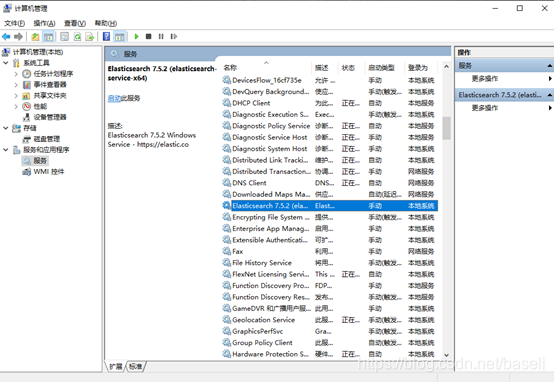
5. 安装为服务
在bin目录下进入cmd命令窗口,执行elasticsearch-service.bat install,将其安装为windows服务;执行elasticsearch-service.bat remove 删除已安装的Elasticsearch服务(如果启动则停止服务),安装后服务列表会出现elasticsearch的对应服务,后续启动即可在这里启动,避免服务器重启后无法访问,也可以设置为开机自动启动。
这没有太多的细节,我们看到节点名字是"DESKTOP-JOMV3JG"(在你的例子上名字会不一样)的节点已经启动了,并且在单个集群中选取自己作为主节点。这个时候不用知道master是什么意思。重要的是,我们已经在一个集群中启动了一个节点。
2.多节点(集群)安装部署
在实际生产中,我们为了存储搜索海量的数据,达到高可用易维护的目的,我们往往会使用多节点,及集群。
接下来我们再来了解下集群的结构是怎样的,这将有助于使用和优化。
- 集群架构:
首先我们应该清楚多台主机构成了一个集群,每台主机称作一个节点(Node)。
如图就是一个三节点的集群:

在图中,每个 Node 都有三个分片,其中 P 开头的代表 Primary 分片,即主分片,R 开头的代表 Replica 分片,即副本分片。所以图中主分片 1、2,副本分片 0 储存在 1 号节点,副本分片 0、1、2 储存在 2 号节点,主分片 0 和副本分片 1、2 储存在 3 号节点,一共是 3 个主分片和 6 个副本分片。同时我们还注意到 1 号节点还有个 MASTER 的标识,这代表它是一个主节点,它相比其他的节点更加特殊,它有权限控制整个集群,比如资源的分配、节点的修改等等。
这里就引出了一个概念就是节点的类型,我们可以将节点分为这么四个类型:
- 主节点:即 Master 节点。主节点的主要职责是和集群操作相关的内容,如创建或删除索引,跟踪哪些节点是群集的一部分,并决定哪些分片分配给相关的节点。稳定的主节点对集群的健康是非常重要的。默认情况下任何一个集群中的节点都有可能被选为主节点。索引数据和搜索查询等操作会占用大量的cpu,内存,io资源,为了确保一个集群的稳定,分离主节点和数据节点是一个比较好的选择。虽然主节点也可以协调节点,路由搜索和从客户端新增数据到数据节点,但最好不要使用这些专用的主节点。一个重要的原则是,尽可能做尽量少的工作。
- 数据节点:即 Data 节点。数据节点主要是存储索引数据的节点,主要对文档进行增删改查操作,聚合操作等。数据节点对 CPU、内存、IO 要求较高,在优化的时候需要监控数据节点的状态,当资源不够的时候,需要在集群中添加新的节点。
- 负载均衡节点:也称作 Client 节点,也称作客户端节点。当一个节点既不配置为主节点,也不配置为数据节点时,该节点只能处理路由请求,处理搜索,分发索引操作等,从本质上来说该客户节点表现为智能负载平衡器。独立的客户端节点在一个比较大的集群中是非常有用的,他协调主节点和数据节点,客户端节点加入集群可以得到集群的状态,根据集群的状态可以直接路由请求。
- 预处理节点:也称作 Ingest 节点,在索引数据之前可以先对数据做预处理操作,所有节点其实默认都是支持 Ingest 操作的,也可以专门将某个节点配置为 Ingest 节点。
以上就是节点几种类型,一个节点其实可以对应不同的类型,如一个节点可以同时成为主节点和数据节点和预处理节点,但如果一个节点既不是主节点也不是数据节点,那么它就是负载均衡节点。具体的类型可以通过具体的配置文件来设置。
- 安装部署:
- 下载安装
下载安装和单节点第一步、第二步中完全相同,这里不再阐述。
- 集群配置

-
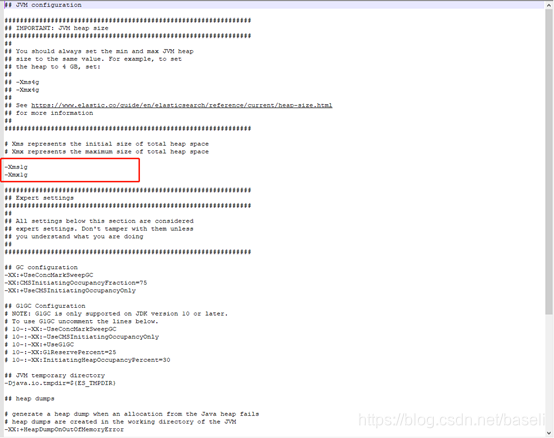
- JVM配置
根据实际需要配置JVM参数
- 安装为服务
在bin目录下进入cmd命令窗口,执行elasticsearch-service.bat install,将其安装为windows服务;执行elasticsearch-service.bat remove 删除已安装的Elasticsearch服务(如果启动则停止服务),安装后服务列表会出现elasticsearch的对应服务,后续启动即可在这里启动,避免服务器重启后无法访问,也可以设置为开机自动启动。
-

-
3.设置密码
一般测试阶段为了方便可以不设置密码,但是生产环境为了安全还是设置复杂一点的面比较好。
1.需要在配置文件中开启x-pack验证, 修改config目录下面的elasticsearch.yml文件,在里面添加如下内容,并重启.
xpack.security.enabled: true
xpack.license.self_generated.type: basic
xpack.security.transport.ssl.enabled: true
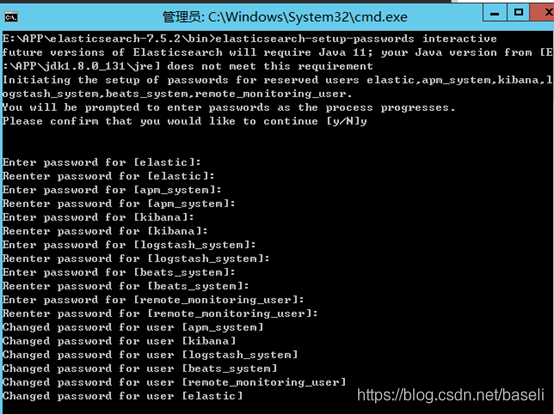
2,执行设置用户名和密码的命令,这里需要为4个用户分别设置密码,elastic, kibana, logstash_system,beats_system
切换到安装目录的bin目录下,输入命令elasticsearch-setup-passwords interactive,即可看到以下画面,输入y确定,然后开始分别设置几个账户的密码,设置完成后会自动退出该命令。
-
3,使用命令修改密码
命令如下:
curl -H "Content-Type:application/json" -XPOST -u elastic 'http://127.0.0.1:9200/_xpack/security/user/elastic/_password' -d '{ "password" : "123456" }'
当下面的可视化工具安装完成后也可以在可视化界面的设置中修改密码。
本文配置文件如下:
elasticsearch.yml文件:
-
# ======================== Elasticsearch Configuration =========================
#
# NOTE: Elasticsearch comes with reasonable defaults for most settings.
# Before you set out to tweak and tune the configuration, make sure you
# understand what are you trying to accomplish and the consequences.
#
# The primary way of configuring a node is via this file. This template lists
# the most important settings you may want to configure for a production cluster.
#
# Please consult the documentation for further information on configuration options:
# https://www.elastic.co/guide/en/elasticsearch/reference/index.html
#
# ---------------------------------- Cluster -----------------------------------
#
# Use a descriptive name for your cluster:
#集群名称
#cluster.name: my-application
cluster.name: expression
#
# ------------------------------------ Node ------------------------------------
#
# Use a descriptive name for the node:
#节点名称
#node.name: node-1
node.name: node-1
#
# Add custom attributes to the node:
#
#node.attr.rack: r1
#
# ----------------------------------- Paths ------------------------------------
#
# Path to directory where to store the data (separate multiple locations by comma):
#数据存放路径
#path.data: /path/to/data
#
# Path to log files:
#日志存放路径
#path.logs: /path/to/logs
#
# ----------------------------------- Memory -----------------------------------
#
# Lock the memory on startup:
#
#bootstrap.memory_lock: true
#
# Make sure that the heap size is set to about half the memory available
# on the system and that the owner of the process is allowed to use this
# limit.
#
# Elasticsearch performs poorly when the system is swapping the memory.
#
# ---------------------------------- Network -----------------------------------
#
# Set the bind address to a specific IP (IPv4 or IPv6):
#当前节点的IP地址
#network.host: 192.168.169.86
network.host: 192.168.169.86
#
# Set a custom port for HTTP:
#对外提供服务的端口号
#http.port: 9200
http.port: 19200
#
# For more information, consult the network module documentation.
#
# --------------------------------- Discovery ----------------------------------
#
# Pass an initial list of hosts to perform discovery when this node is started:
# The default list of hosts is ["127.0.0.1", "[::1]"]
#
#discovery.seed_hosts: ["host1", "host2"]
discovery.seed_hosts: ["192.168.169.86"]
#
# Bootstrap the cluster using an initial set of master-eligible nodes:
#
#cluster.initial_master_nodes: ["node-1", "node-2"]
cluster.initial_master_nodes: ["node-1"]
#
# For more information, consult the discovery and cluster formation module documentation.
#
# ---------------------------------- Gateway -----------------------------------
#
# Block initial recovery after a full cluster restart until N nodes are started:
#
#gateway.recover_after_nodes: 3
#
# For more information, consult the gateway module documentation.
#
# ---------------------------------- Various -----------------------------------
#
# Require explicit names when deleting indices:
#
#action.destructive_requires_name: true
xpack.security.enabled: true
xpack.license.self_generated.type: basic
xpack.security.transport.ssl.enabled: true
jvm.options配置文件
-
## JVM configuration
################################################################
## IMPORTANT: JVM heap size
################################################################
##
## You should always set the min and max JVM heap
## size to the same value. For example, to set
## the heap to 4 GB, set:
##
## -Xms4g
## -Xmx4g
##
## See https://www.elastic.co/guide/en/elasticsearch/reference/current/heap-size.html
## for more information
##
################################################################# Xms represents the initial size of total heap space
# Xmx represents the maximum size of total heap space-Xms1g
-Xmx1g################################################################
## Expert settings
################################################################
##
## All settings below this section are considered
## expert settings. Don't tamper with them unless
## you understand what you are doing
##
################################################################## GC configuration
-XX:+UseConcMarkSweepGC
-XX:CMSInitiatingOccupancyFraction=75
-XX:+UseCMSInitiatingOccupancyOnly## G1GC Configuration
# NOTE: G1GC is only supported on JDK version 10 or later.
# To use G1GC uncomment the lines below.
# 10-:-XX:-UseConcMarkSweepGC
# 10-:-XX:-UseCMSInitiatingOccupancyOnly
# 10-:-XX:+UseG1GC
# 10-:-XX:G1ReservePercent=25
# 10-:-XX:InitiatingHeapOccupancyPercent=30## JVM temporary directory
-Djava.io.tmpdir=${ES_TMPDIR}## heap dumps
# generate a heap dump when an allocation from the Java heap fails
# heap dumps are created in the working directory of the JVM
-XX:+HeapDumpOnOutOfMemoryError# specify an alternative path for heap dumps; ensure the directory exists and
# has sufficient space
-XX:HeapDumpPath=data# specify an alternative path for JVM fatal error logs
-XX:ErrorFile=logs/hs_err_pid%p.log## JDK 8 GC logging
8:-XX:+PrintGCDetails
8:-XX:+PrintGCDateStamps
8:-XX:+PrintTenuringDistribution
8:-XX:+PrintGCApplicationStoppedTime
8:-Xloggc:logs/gc.log
8:-XX:+UseGCLogFileRotation
8:-XX:NumberOfGCLogFiles=32
8:-XX:GCLogFileSize=64m# JDK 9+ GC logging
9-:-Xlog:gc*,gc+age=trace,safepoint:file=logs/gc.log:utctime,pid,tags:filecount=32,filesize=64m
八、可视化工具Kibnan安装1. Kibnan是什么
Kibana 是为 Elasticsearch设计的开源分析和可视化平台。你可以使用 Kibana 来搜索,查看存储在 Elasticsearch 索引中的数据并与之交互。你可以很容易实现高级的数据分析和可视化,以图表的形式展现出来。
使用前我们肯定需要先有Elasticsearch啦,安装使用Elasticsearch可以参考Elasticsearch构建全文搜索系统
- 下载安装
打开中文社区网址https://elasticsearch.cn/download/,选择对应版本下载并解压,也可以去官网下载,不过速度要慢一些。
-

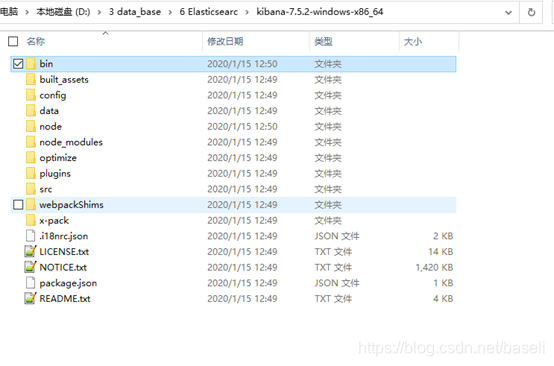
解压完后目录如下:
-
- Kibnan配置文件参数详解
Kibana server 启动时从 kibana.yml 文件中读取配置属性。Kibana 默认配置 localhost:5601 。改变主机和端口号,或者连接其他机器上的 Elasticsearch,需要更新 kibana.yml 文件。也可以启用 SSL 和设置其他选项,该参数名称可能会因为版本不同会有所不同,常用设置请看下一节设置具体参数,详细参数学习请根据当前版本查看官方文档。
server.port:
默认值: 5601 Kibana 由后端服务器提供服务,该配置指定使用的端口号。
server.host:
默认值: "localhost" 指定后端服务器的主机地址。
server.basePath:
如果启用了代理,指定 Kibana 的路径,该配置项只影响 Kibana 生成的 URLs,转发请求到 Kibana 时代理会移除基础路径值,该配置项不能以斜杠 (/)结尾。
server.maxPayloadBytes:
默认值: 1048576 服务器请求的最大负载,单位字节。
server.name:
默认值: "您的主机名" Kibana 实例对外展示的名称。
server.defaultRoute:
默认值: "/app/kibana" Kibana 的默认路径,该配置项可改变 Kibana 的登录页面。
elasticsearch.url:
默认值: "http://localhost:9200" 用来处理所有查询的 Elasticsearch 实例的 URL 。
elasticsearch.preserveHost:
默认值: true 该设置项的值为 true 时,Kibana 使用 server.host 设定的主机名,该设置项的值为 false 时,Kibana 使用主机的主机名来连接 Kibana 实例。
kibana.index:
默认值: ".kibana" Kibana 使用 Elasticsearch 中的索引来存储保存的检索,可视化控件以及仪表板。如果没有索引,Kibana 会创建一个新的索引。
kibana.defaultAppId:
默认值: "discover" 默认加载的应用。
tilemap.url:
Kibana 用来在 tile 地图可视化组件中展示地图服务的 URL。默认时,Kibana 从外部的元数据服务读取 url,用户也可以覆盖该参数,使用自己的 tile 地图服务。例如:"https://tiles.elastic.co/v2/default/{z}/{x}/{y}.png?elastic_tile_service_tos=agree&my_app_name=kibana"
tilemap.options.minZoom:
默认值: 1 最小缩放级别。
tilemap.options.maxZoom:
默认值: 10 最大缩放级别。
tilemap.options.attribution:
默认值: "© [Elastic Tile Service](https://www.elastic.co/elastic-tile-service)" 地图属性字符串。
tilemap.options.subdomains:
服务使用的二级域名列表,用 {s} 指定二级域名的 URL 地址。
elasticsearch.username: 和 elasticsearch.password:
Elasticsearch 设置了基本的权限认证,该配置项提供了用户名和密码,用于 Kibana 启动时维护索引。Kibana 用户仍需要 Elasticsearch 由 Kibana 服务端代理的认证。
server.ssl.enabled
默认值: "false" 对到浏览器端的请求启用 SSL,设为 true 时, server.ssl.certificate 和 server.ssl.key 也要设置。
server.ssl.certificate: 和 server.ssl.key:
PEM 格式 SSL 证书和 SSL 密钥文件的路径。
server.ssl.keyPassphrase
解密私钥的口令,该设置项可选,因为密钥可能没有加密。
server.ssl.certificateAuthorities
可信任 PEM 编码的证书文件路径列表。
server.ssl.supportedProtocols
默认值: TLSv1、TLSv1.1、TLSv1.2 版本支持的协议,有效的协议类型: TLSv1 、 TLSv1.1 、 TLSv1.2 。
server.ssl.cipherSuites
默认值: ECDHE-RSA-AES128-GCM-SHA256, ECDHE-ECDSA-AES128-GCM-SHA256, ECDHE-RSA-AES256-GCM-SHA384, ECDHE-ECDSA-AES256-GCM-SHA384, DHE-RSA-AES128-GCM-SHA256, ECDHE-RSA-AES128-SHA256, DHE-RSA-AES128-SHA256, ECDHE-RSA-AES256-SHA384, DHE-RSA-AES256-SHA384, ECDHE-RSA-AES256-SHA256, DHE-RSA-AES256-SHA256, HIGH,!aNULL, !eNULL, !EXPORT, !DES, !RC4, !MD5, !PSK, !SRP, !CAMELLIA. 具体格式和有效参数可通过[OpenSSL cipher list format documentation](https://www.openssl.org/docs/man1.0.2/apps/ciphers.html#CIPHER-LIST-FORMAT) 获得。
elasticsearch.ssl.certificate: 和 elasticsearch.ssl.key:
可选配置项,提供 PEM格式 SSL 证书和密钥文件的路径。这些文件确保 Elasticsearch 后端使用同样的密钥文件。
elasticsearch.ssl.keyPassphrase
解密私钥的口令,该设置项可选,因为密钥可能没有加密。
elasticsearch.ssl.certificateAuthorities:
指定用于 Elasticsearch 实例的 PEM 证书文件路径。
elasticsearch.ssl.verificationMode:
默认值: full 控制证书的认证,可用的值有 none 、 certificate 、 full 。 full 执行主机名验证,certificate 不执行主机名验证。
elasticsearch.pingTimeout:
默认值: elasticsearch.requestTimeout setting 的值,等待 Elasticsearch 的响应时间。
elasticsearch.requestTimeout:
默认值: 30000 等待后端或 Elasticsearch 的响应时间,单位微秒,该值必须为正整数。
elasticsearch.requestHeadersWhitelist:
默认值: [ 'authorization' ] Kibana 客户端发送到 Elasticsearch 头体,发送 no 头体,设置该值为[]。
elasticsearch.customHeaders:
默认值: {} 发往 Elasticsearch的头体和值, 不管 elasticsearch.requestHeadersWhitelist 如何配置,任何自定义的头体不会被客户端头体覆盖。
elasticsearch.shardTimeout:
默认值: 0 Elasticsearch 等待分片响应时间,单位微秒,0即禁用。
elasticsearch.startupTimeout:
默认值: 5000 Kibana 启动时等待 Elasticsearch 的时间,单位微秒。
pid.file:
指定 Kibana 的进程 ID 文件的路径。
logging.dest:
默认值: stdout 指定 Kibana 日志输出的文件。
logging.silent:
默认值: false 该值设为 true 时,禁止所有日志输出。
logging.quiet:
默认值: false 该值设为 true 时,禁止除错误信息除外的所有日志输出。
logging.verbose
默认值: false 该值设为 true 时,记下所有事件包括系统使用信息和所有请求的日志。
ops.interval
默认值: 5000 设置系统和进程取样间隔,单位微妙,最小值100。
status.allowAnonymous
默认值: false 如果启用了权限,该项设置为 true 即允许所有非授权用户访问 Kibana 服务端 API 和状态页面。
cpu.cgroup.path.override
如果挂载点跟 /proc/self/cgroup 不一致,覆盖 cgroup cpu 路径。
cpuacct.cgroup.path.override
如果挂载点跟 /proc/self/cgroup 不一致,覆盖 cgroup cpuacct 路径。
console.enabled
默认值: true 设为 false 来禁用控制台,切换该值后服务端下次启动时会重新生成资源文件,因此会导致页面服务有点延迟。
elasticsearch.tribe.url:
Elasticsearch tribe 实例的 URL,用于所有查询。
elasticsearch.tribe.username: 和 elasticsearch.tribe.password:
Elasticsearch 设置了基本的权限认证,该配置项提供了用户名和密码,用于 Kibana 启动时维护索引。Kibana 用户仍需要 Elasticsearch 由 Kibana 服务端代理的认证。
elasticsearch.tribe.ssl.certificate: 和 elasticsearch.tribe.ssl.key:
可选配置项,提供 PEM 格式 SSL 证书和密钥文件的路径。这些文件确保 Elasticsearch 后端使用同样的密钥文件。
elasticsearch.tribe.ssl.keyPassphrase
解密私钥的口令,该设置项可选,因为密钥可能没有加密。
elasticsearch.tribe.ssl.certificateAuthorities:
指定用于 Elasticsearch tribe 实例的 PEM 证书文件路径。
elasticsearch.tribe.ssl.verificationMode:
默认值: full 控制证书的认证,可用的值有 none 、 certificate 、 full 。 full 执行主机名验证, certificate 不执行主机名验证。
elasticsearch.tribe.pingTimeout:
默认值: elasticsearch.tribe.requestTimeout setting 的值,等待 Elasticsearch 的响应时间。
elasticsearch.tribe.requestTimeout:
Default: 30000 等待后端或 Elasticsearch 的响应时间,单位微秒,该值必须为正整数。
elasticsearch.tribe.requestHeadersWhitelist:
默认值: [ 'authorization' ] Kibana 发往 Elasticsearch 的客户端头体,发送 no 头体,设置该值为[]。
elasticsearch.tribe.customHeaders:
默认值: {} 发往 Elasticsearch的头体和值,不管 elasticsearch.tribe.requestHeadersWhitelist 如何配置,任何自定义的头体不会被客户端头体覆盖。
- 设置监听端口号、es地址、索引名、用户密码
在kibana安装目录的config目录下找到kibana.yml,打开并修改以下参数,如果elasticsearch安装时设置了密码,还需要在配置文件的elasticsearch.hosts:后面加上用户名和密码参数,如下:
elasticsearch.username: "elastic"
elasticsearch.password: "初始化设置的密码"
如果想使用中文可在配置文件最后加上以下配置
i18n.locale: "zh-CN"

本文配置文件如下:
-
kibana.yml配置文件
# Kibana is served by a back end server. This setting specifies the port to use.
#server.port: 5601
server.port: 15601
# Specifies the address to which the Kibana server will bind. IP addresses and host names are both valid values.
# The default is 'localhost', which usually means remote machines will not be able to connect.
# To allow connections from remote users, set this parameter to a non-loopback address.
#server.host: "localhost"
server.host: "192.168.169.86"
# Enables you to specify a path to mount Kibana at if you are running behind a proxy.
# Use the `server.rewriteBasePath` setting to tell Kibana if it should remove the basePath
# from requests it receives, and to prevent a deprecation warning at startup.
# This setting cannot end in a slash.
#server.basePath: ""# Specifies whether Kibana should rewrite requests that are prefixed with
# `server.basePath` or require that they are rewritten by your reverse proxy.
# This setting was effectively always `false` before Kibana 6.3 and will
# default to `true` starting in Kibana 7.0.
#server.rewriteBasePath: false# The maximum payload size in bytes for incoming server requests.
#server.maxPayloadBytes: 1048576# The Kibana server's name. This is used for display purposes.
#server.name: "your-hostname"# The URLs of the Elasticsearch instances to use for all your queries.
#elasticsearch.hosts: ["http://localhost:9200"]
elasticsearch.hosts: ["http://192.168.169.86:19200"]
elasticsearch.username: "elastic"
elasticsearch.password: "Artfess@023"
# When this setting's value is true Kibana uses the hostname specified in the server.host
# setting. When the value of this setting is false, Kibana uses the hostname of the host
# that connects to this Kibana instance.
#elasticsearch.preserveHost: true# Kibana uses an index in Elasticsearch to store saved searches, visualizations and
# dashboards. Kibana creates a new index if the index doesn't already exist.
#kibana.index: ".kibana"
kibana.index: ".kibana"
# The default application to load.
#kibana.defaultAppId: "home"# If your Elasticsearch is protected with basic authentication, these settings provide
# the username and password that the Kibana server uses to perform maintenance on the Kibana
# index at startup. Your Kibana users still need to authenticate with Elasticsearch, which
# is proxied through the Kibana server.
#elasticsearch.username: "kibana"
#elasticsearch.password: "pass"# Enables SSL and paths to the PEM-format SSL certificate and SSL key files, respectively.
# These settings enable SSL for outgoing requests from the Kibana server to the browser.
#server.ssl.enabled: false
#server.ssl.certificate: /path/to/your/server.crt
#server.ssl.key: /path/to/your/server.key# Optional settings that provide the paths to the PEM-format SSL certificate and key files.
# These files validate that your Elasticsearch backend uses the same key files.
#elasticsearch.ssl.certificate: /path/to/your/client.crt
#elasticsearch.ssl.key: /path/to/your/client.key# Optional setting that enables you to specify a path to the PEM file for the certificate
# authority for your Elasticsearch instance.
#elasticsearch.ssl.certificateAuthorities: [ "/path/to/your/CA.pem" ]# To disregard the validity of SSL certificates, change this setting's value to 'none'.
#elasticsearch.ssl.verificationMode: full# Time in milliseconds to wait for Elasticsearch to respond to pings. Defaults to the value of
# the elasticsearch.requestTimeout setting.
#elasticsearch.pingTimeout: 1500# Time in milliseconds to wait for responses from the back end or Elasticsearch. This value
# must be a positive integer.
#elasticsearch.requestTimeout: 30000# List of Kibana client-side headers to send to Elasticsearch. To send *no* client-side
# headers, set this value to [] (an empty list).
#elasticsearch.requestHeadersWhitelist: [ authorization ]# Header names and values that are sent to Elasticsearch. Any custom headers cannot be overwritten
# by client-side headers, regardless of the elasticsearch.requestHeadersWhitelist configuration.
#elasticsearch.customHeaders: {}# Time in milliseconds for Elasticsearch to wait for responses from shards. Set to 0 to disable.
#elasticsearch.shardTimeout: 30000# Time in milliseconds to wait for Elasticsearch at Kibana startup before retrying.
#elasticsearch.startupTimeout: 5000# Logs queries sent to Elasticsearch. Requires logging.verbose set to true.
#elasticsearch.logQueries: false# Specifies the path where Kibana creates the process ID file.
#pid.file: /var/run/kibana.pid# Enables you specify a file where Kibana stores log output.
#logging.dest: stdout# Set the value of this setting to true to suppress all logging output.
#logging.silent: false# Set the value of this setting to true to suppress all logging output other than error messages.
#logging.quiet: false# Set the value of this setting to true to log all events, including system usage information
# and all requests.
#logging.verbose: false# Set the interval in milliseconds to sample system and process performance
# metrics. Minimum is 100ms. Defaults to 5000.
#ops.interval: 5000# Specifies locale to be used for all localizable strings, dates and number formats.
# Supported languages are the following: English - en , by default , Chinese - zh-CN .
#i18n.locale: "en"
i18n.locale: "zh-CN"
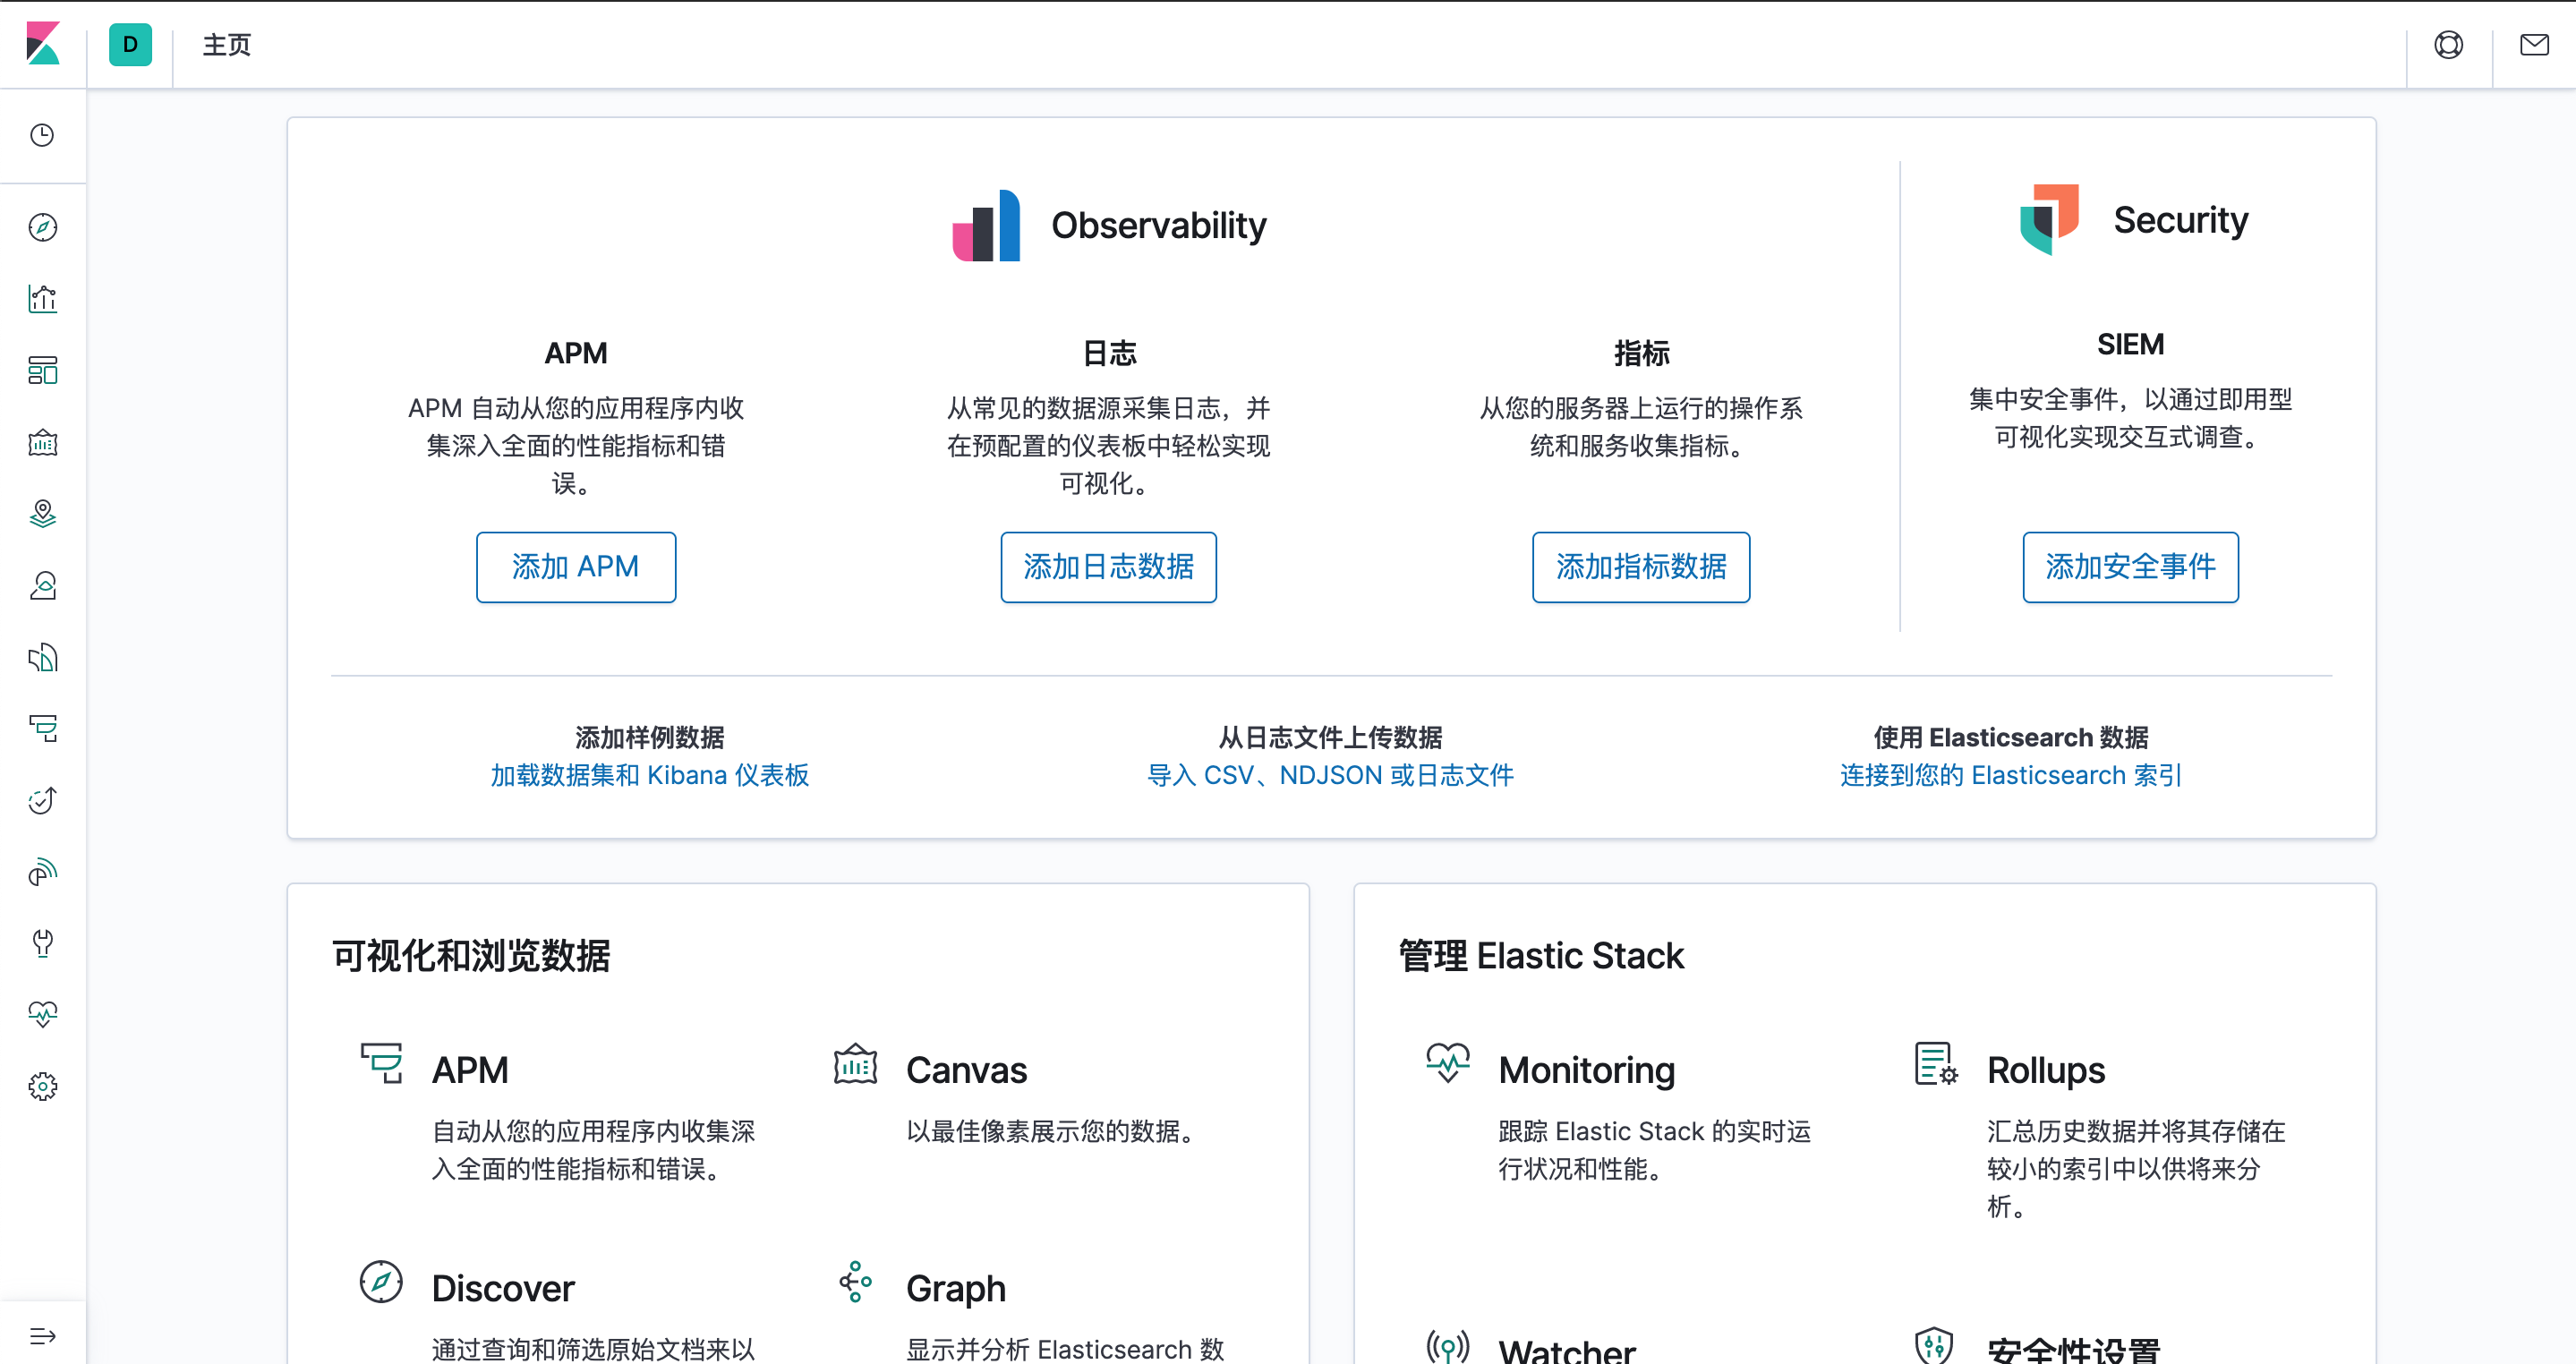
5. Kibnan使用
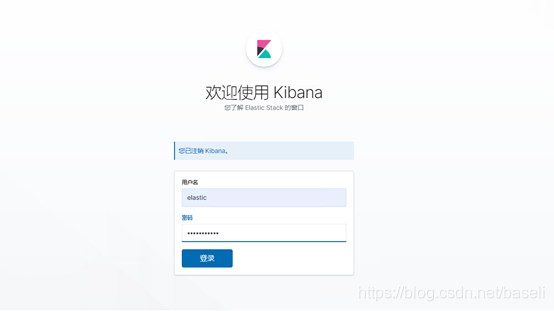
打开http://localhost:5601,画风如下

如果有密码需要输入配置文件中的用户名密码登陆。
-
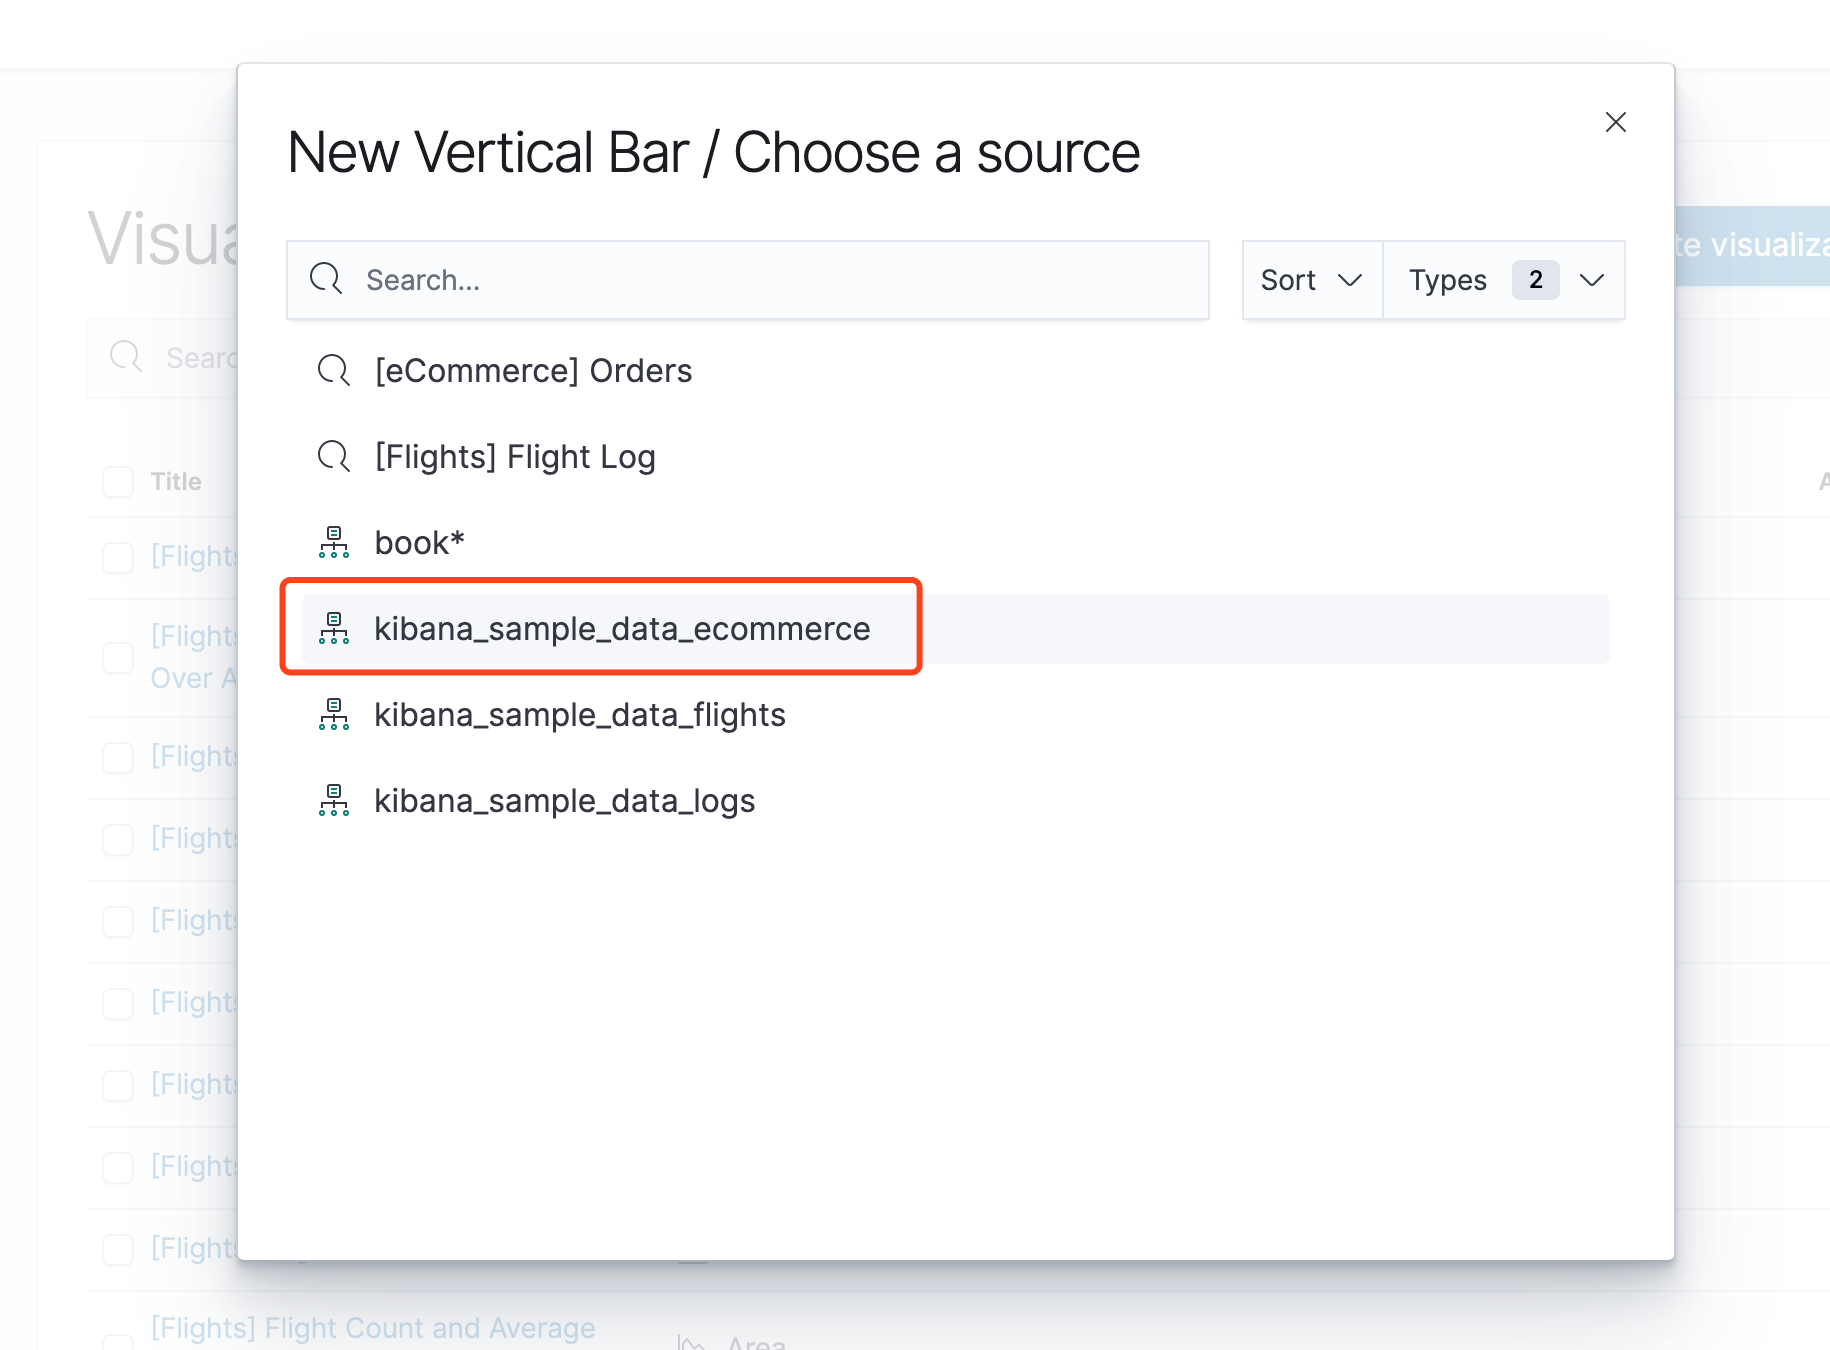
提示我们可以使用示例数据,也可以使用自己已有的数据,我把示例数据都下载了,单击侧面导航中的 Discover 进入 Kibana 的数据探索功能:
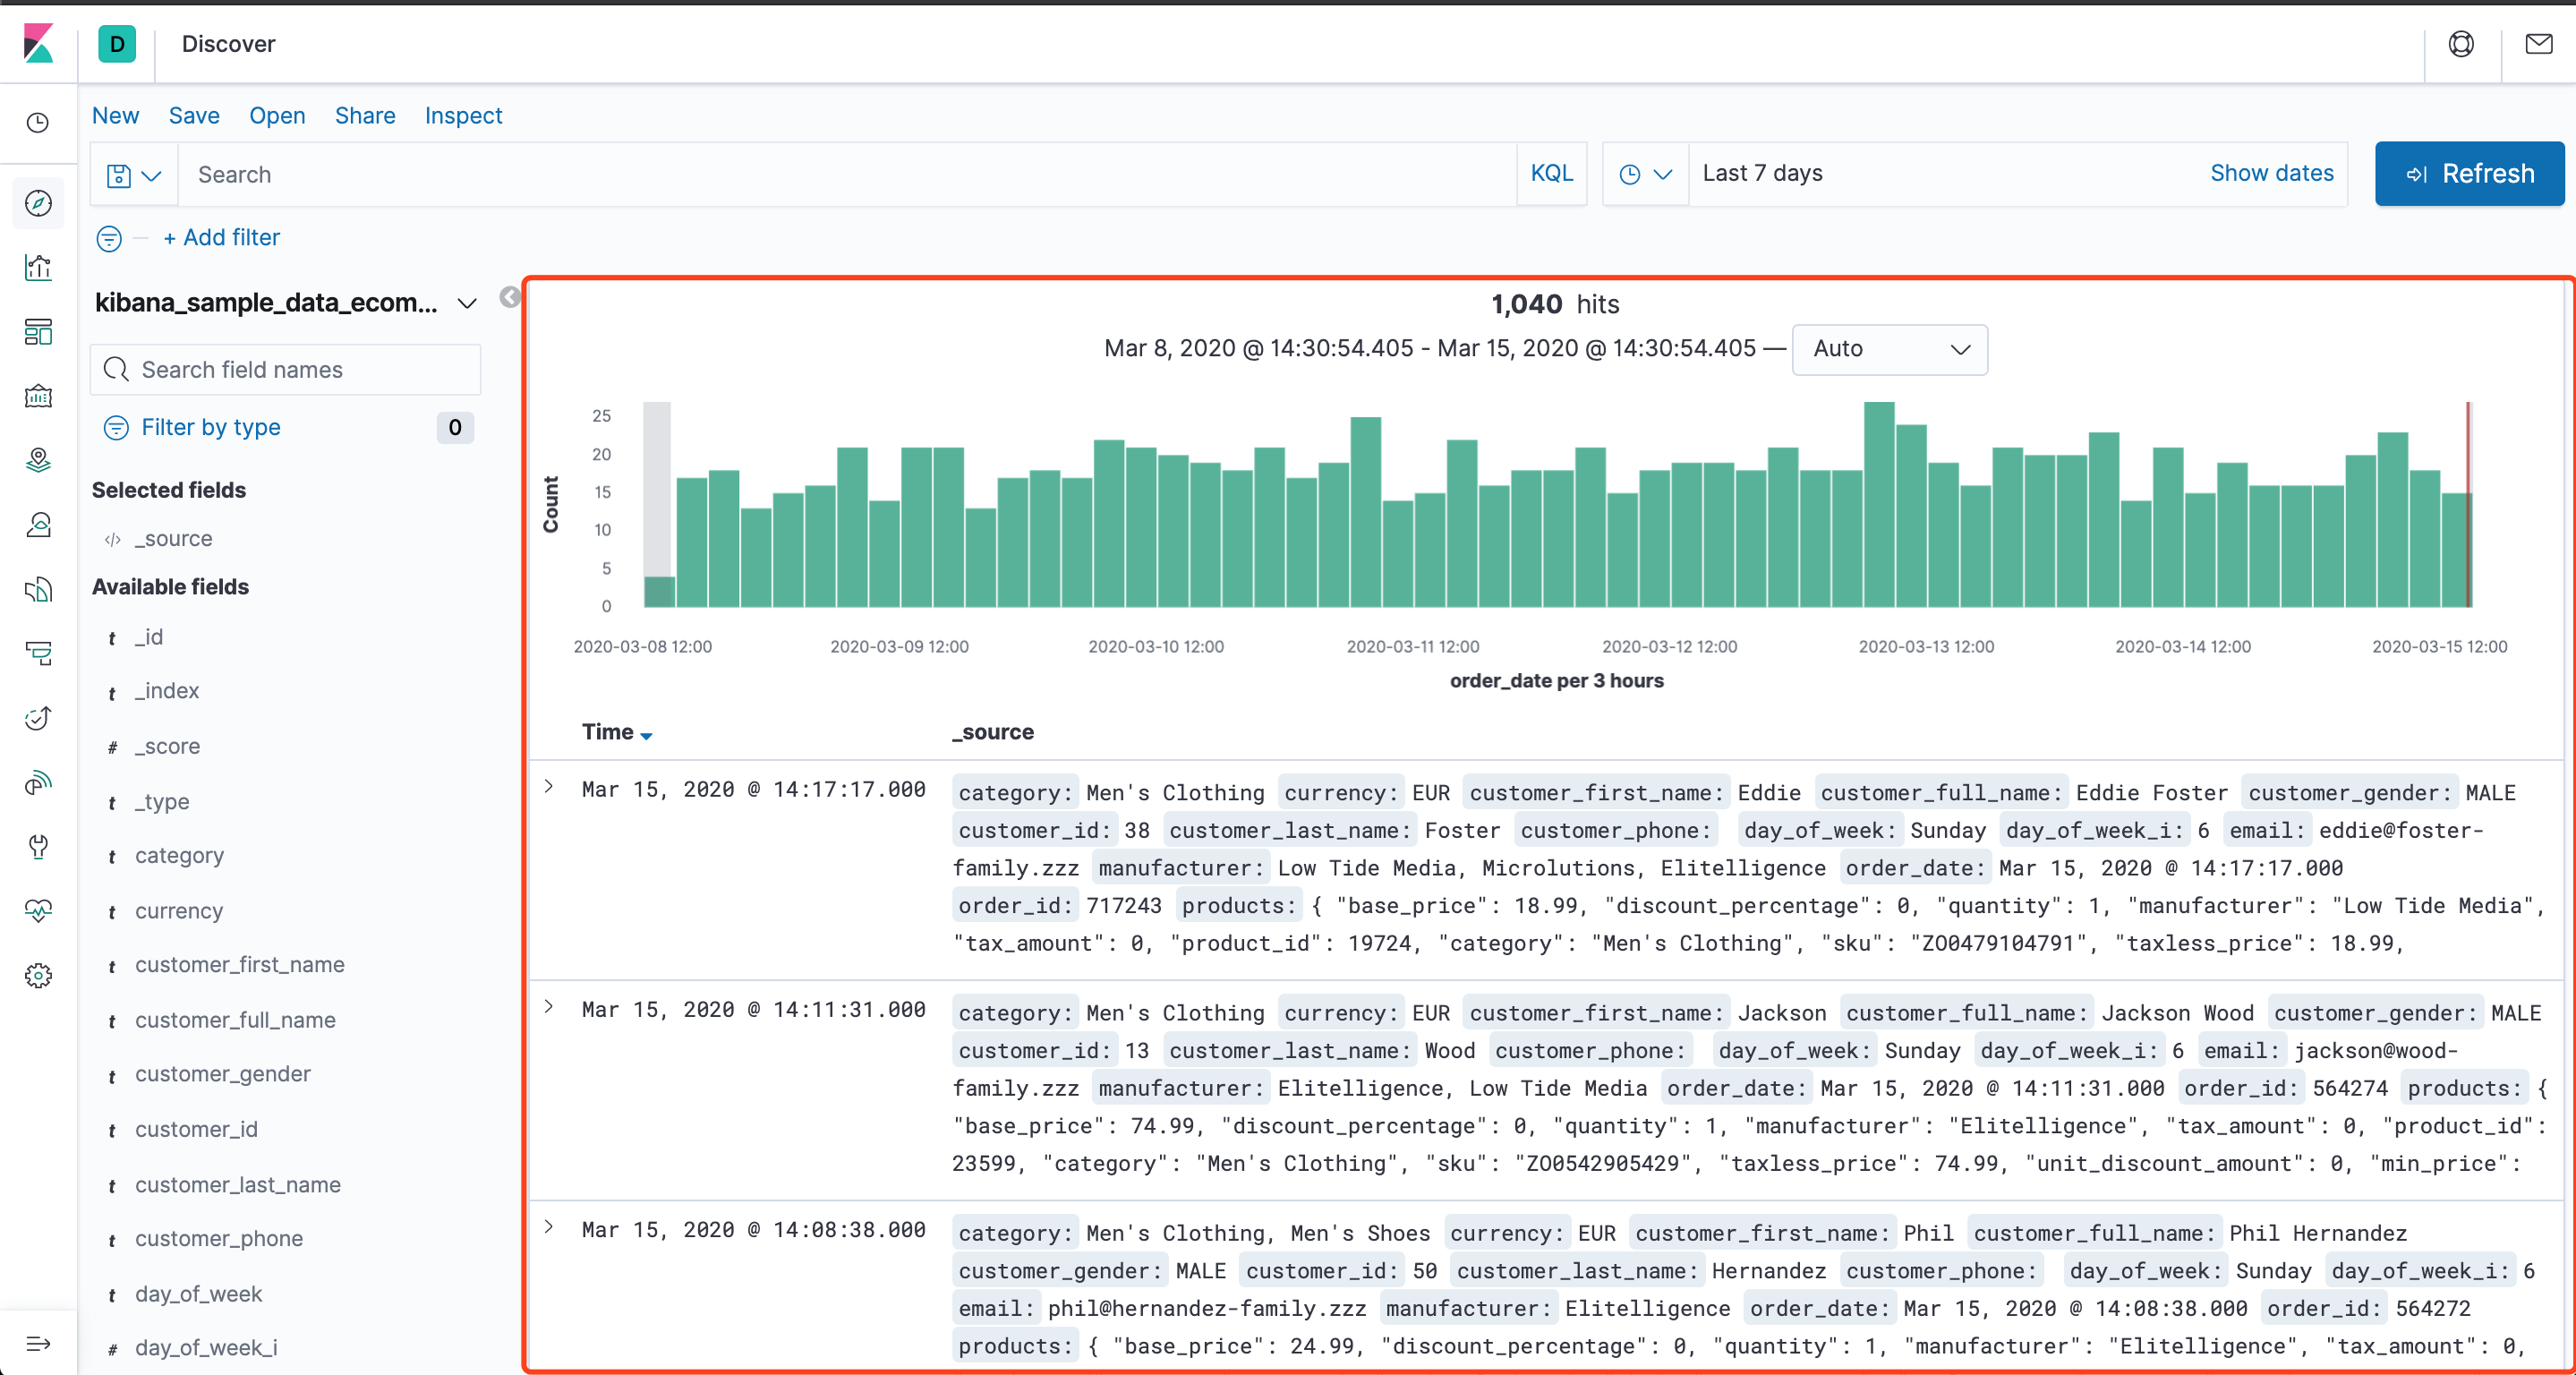
可以看到数据已经导入了,我们可以直接使用查询栏编写语句查询

三、如何加载自定义索引
接下来演示加载已经创建book索引
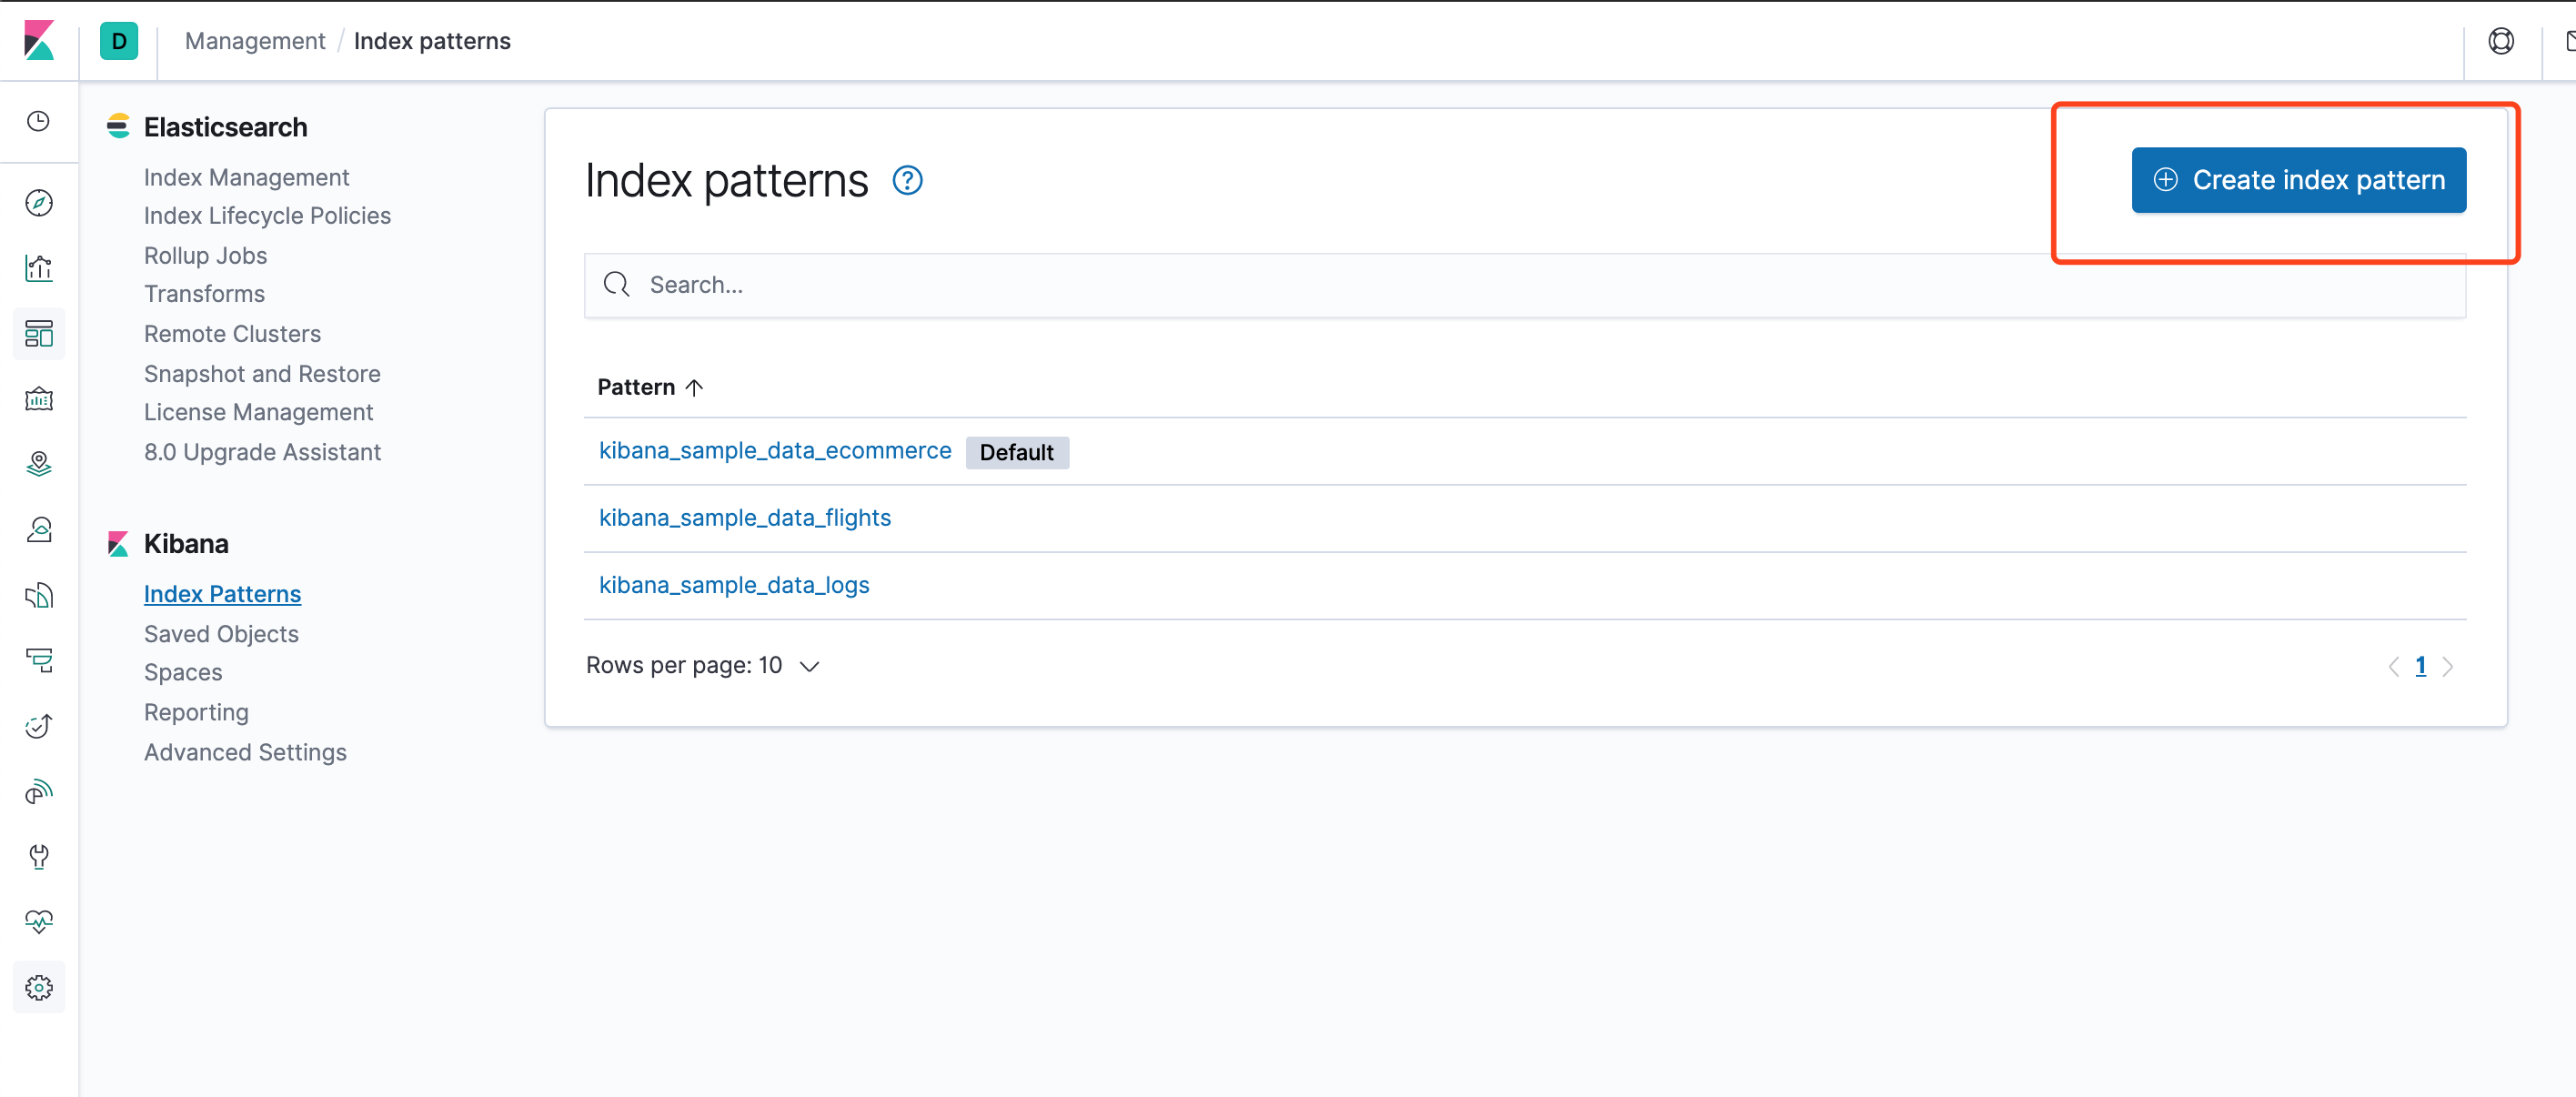
单击 Management 选项
然后单击 Index Patterns 选项。

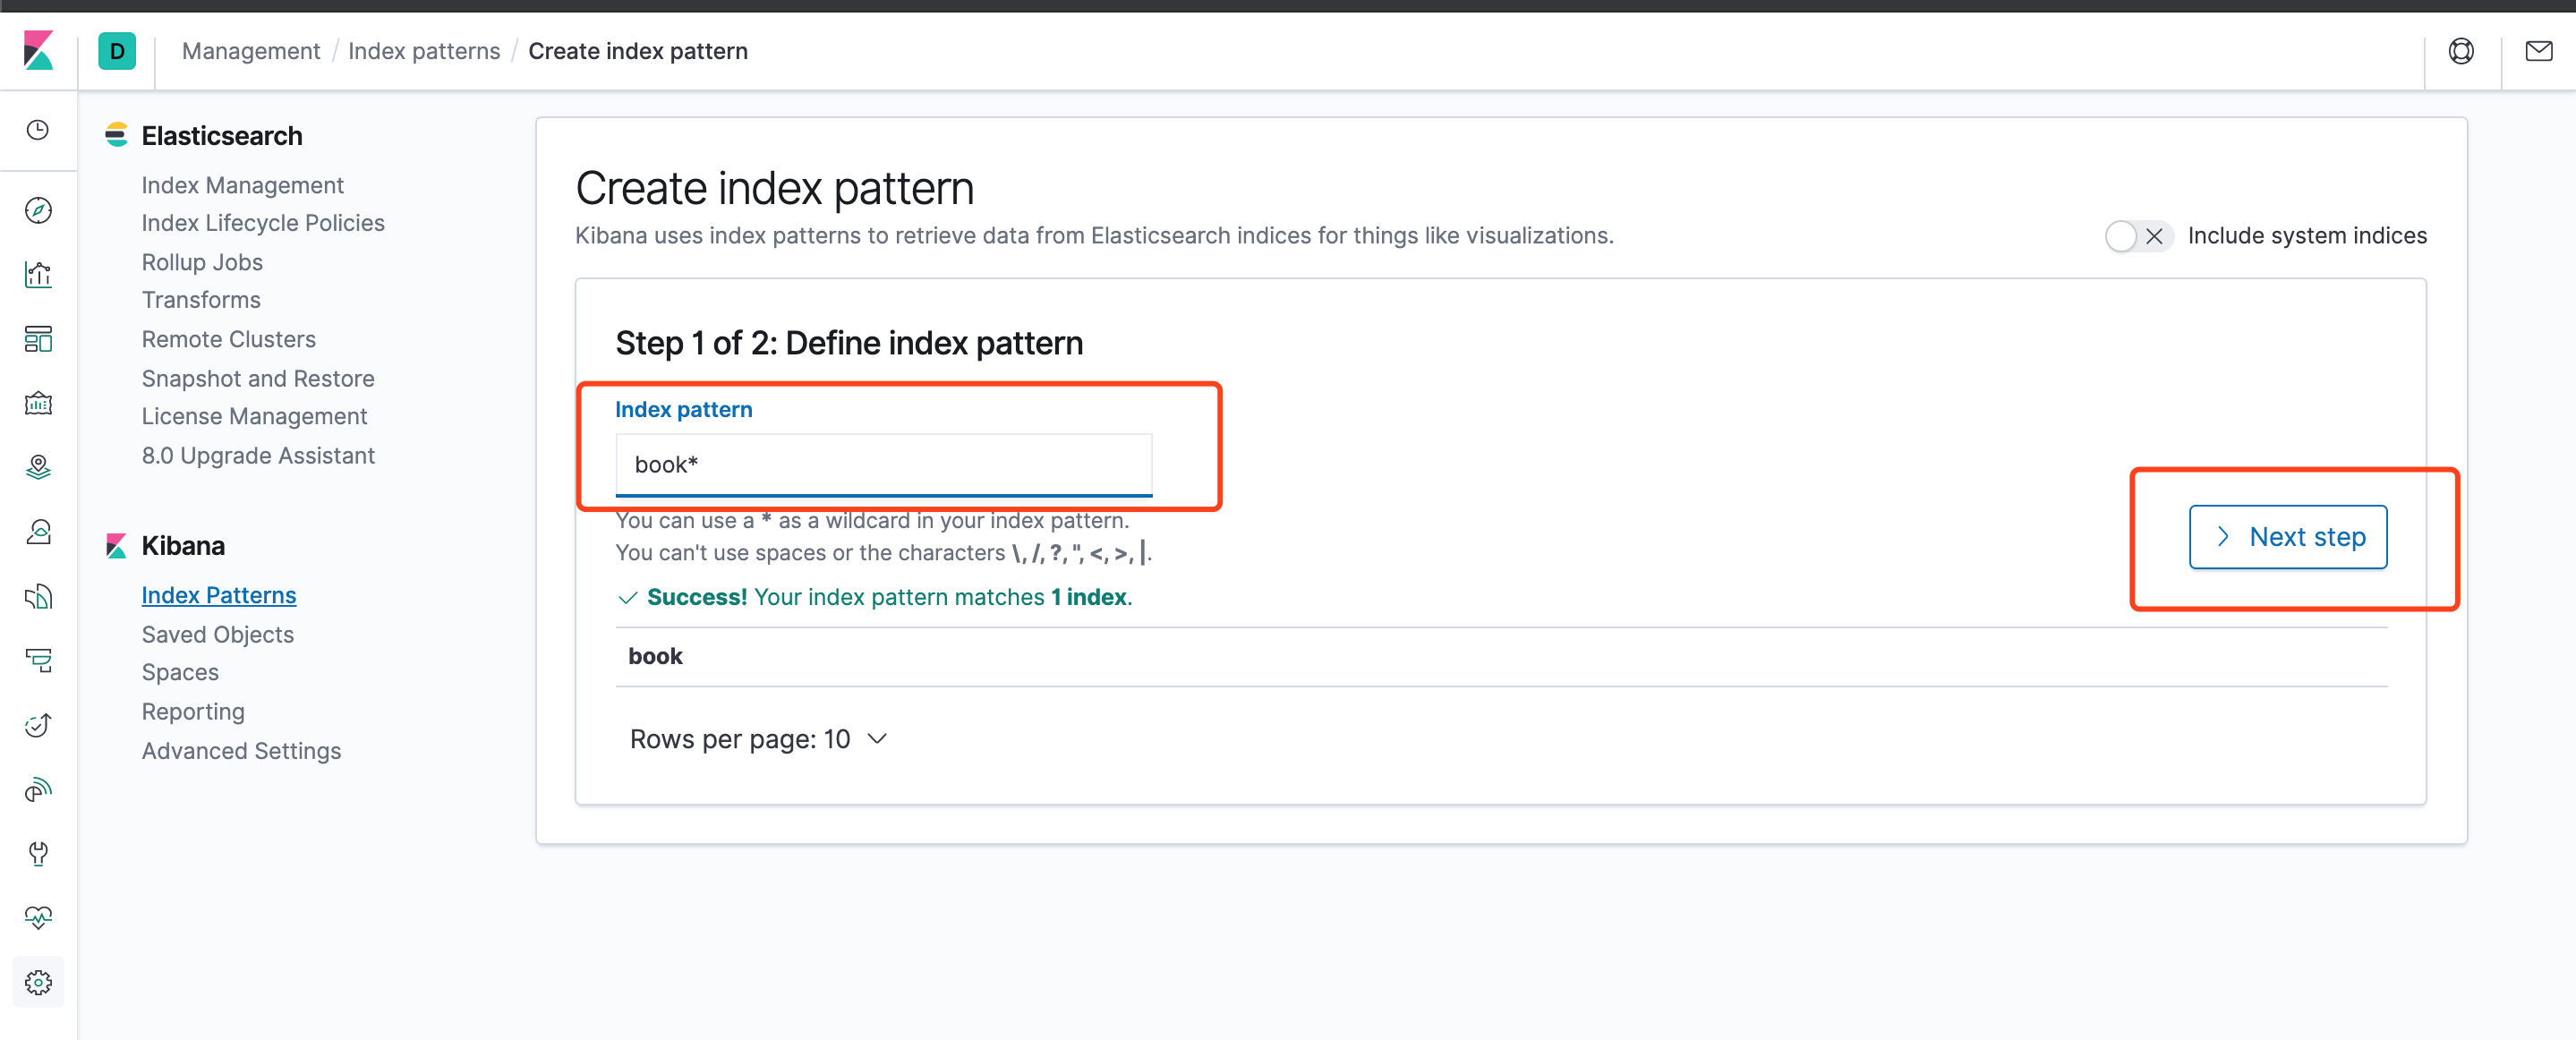
点击Create index pattern定义一个新的索引模式。
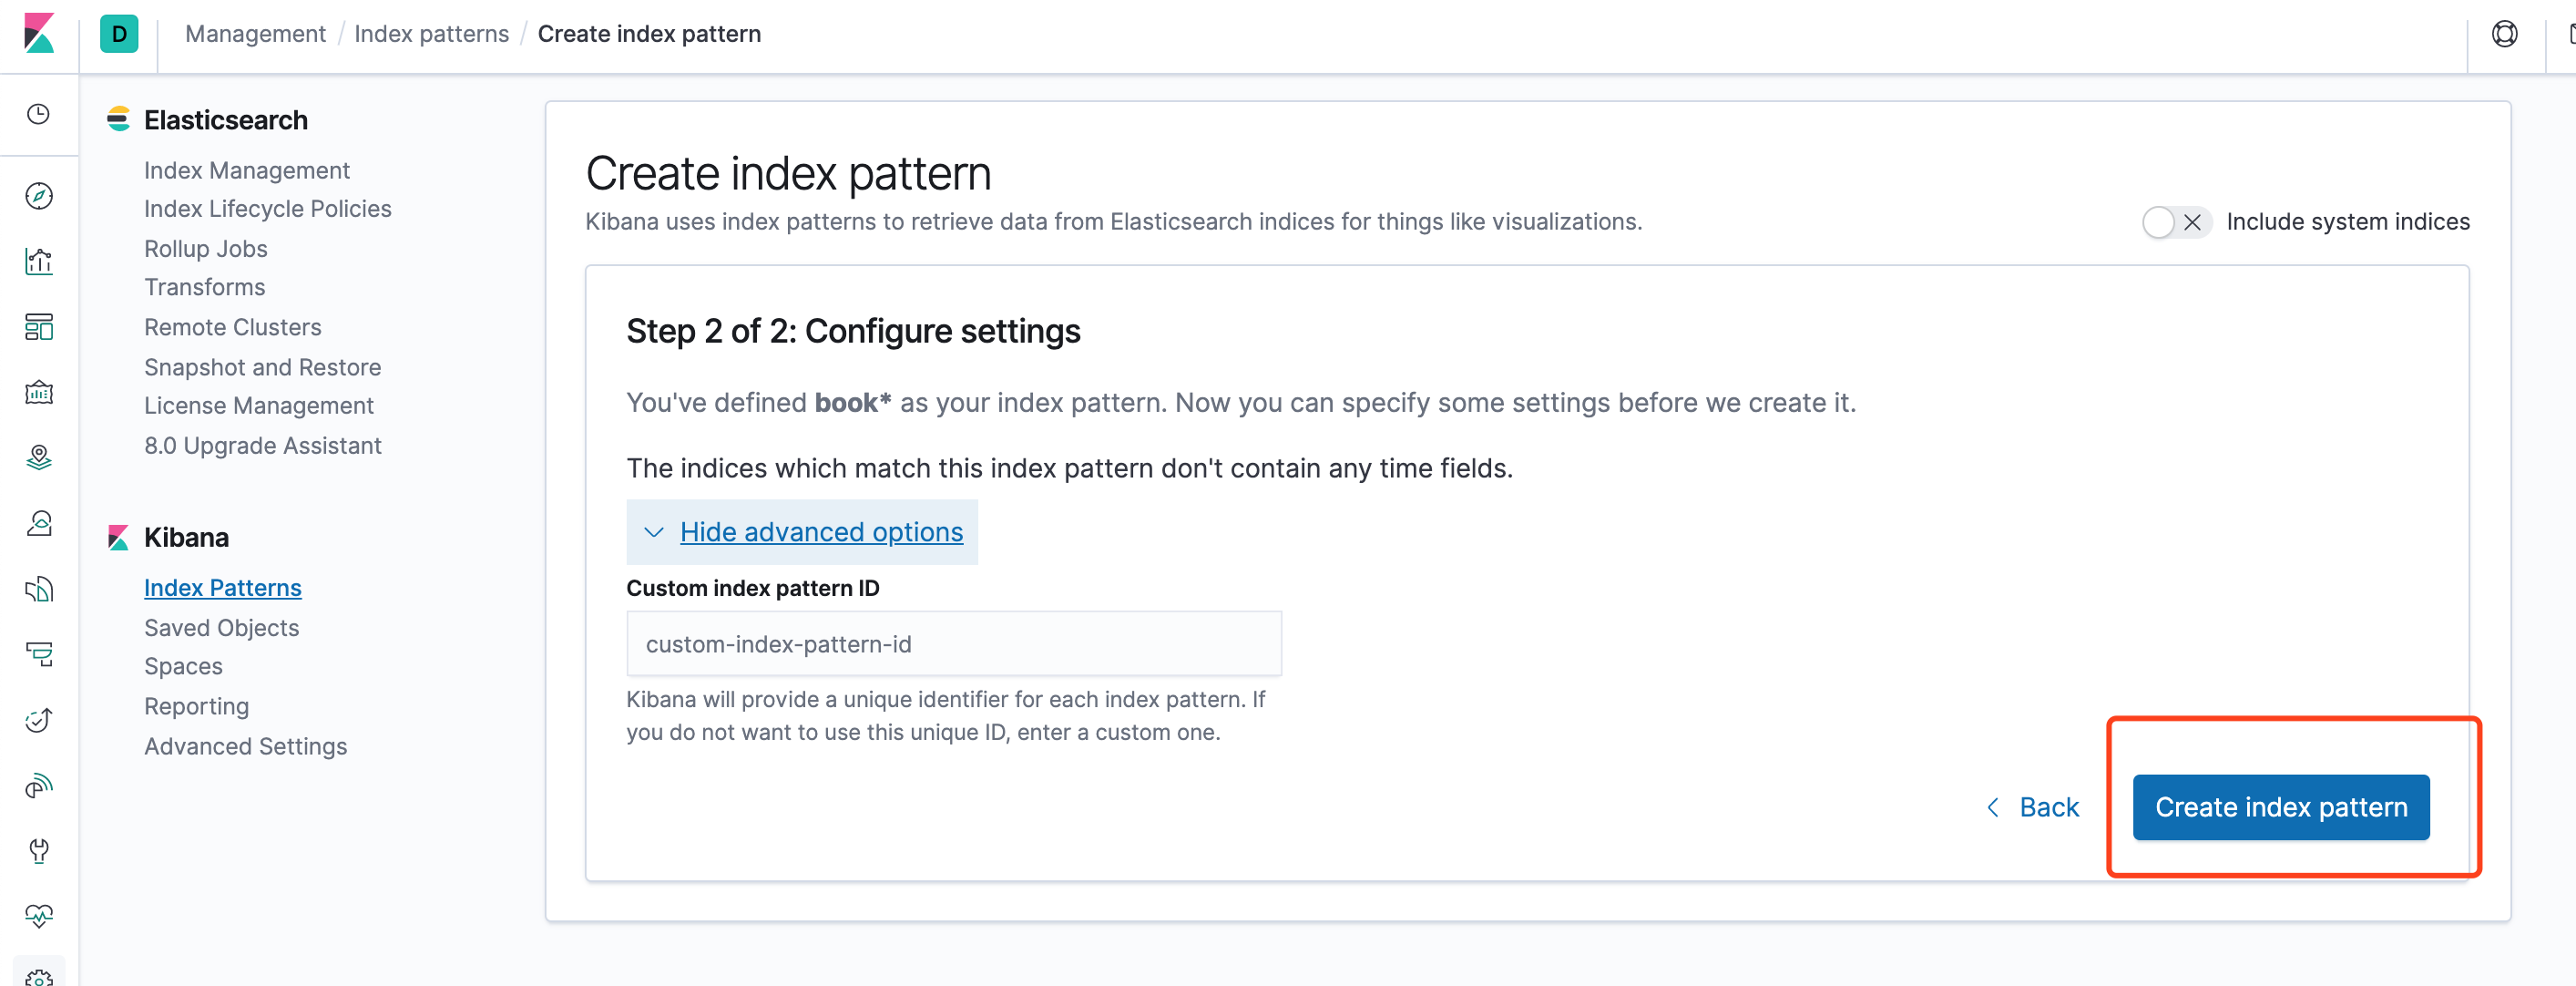
点击Next step
点击Create index pattern
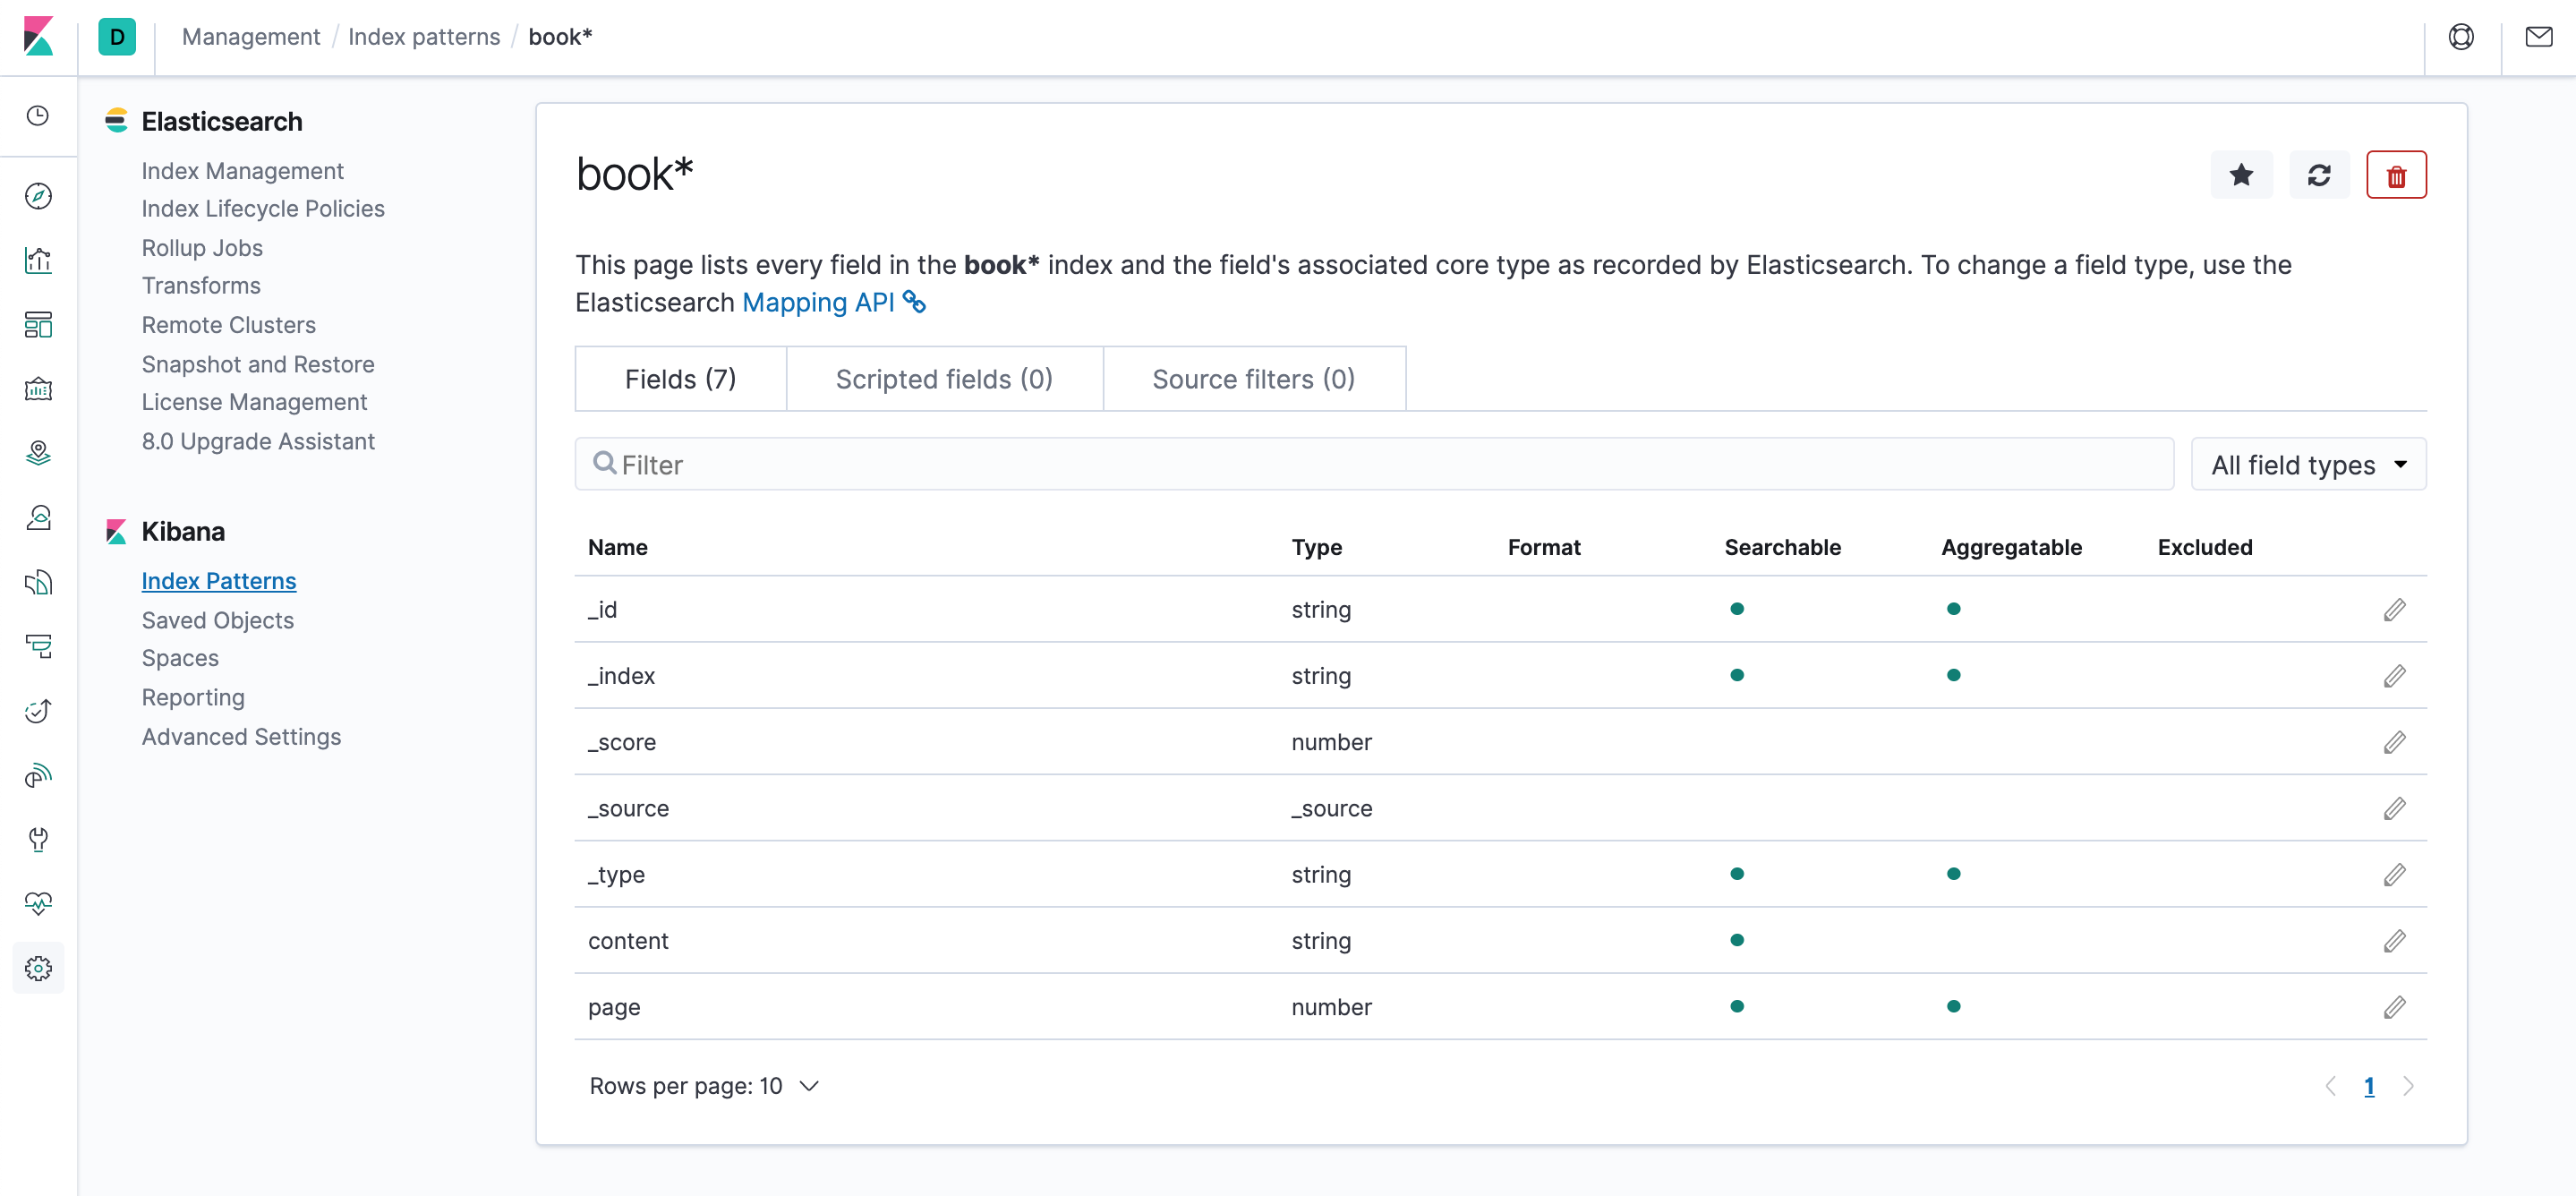
出来如下界面,列出了所有index中的字段
接下来,我们再来使用一下kibana查看已经导入的索引数据

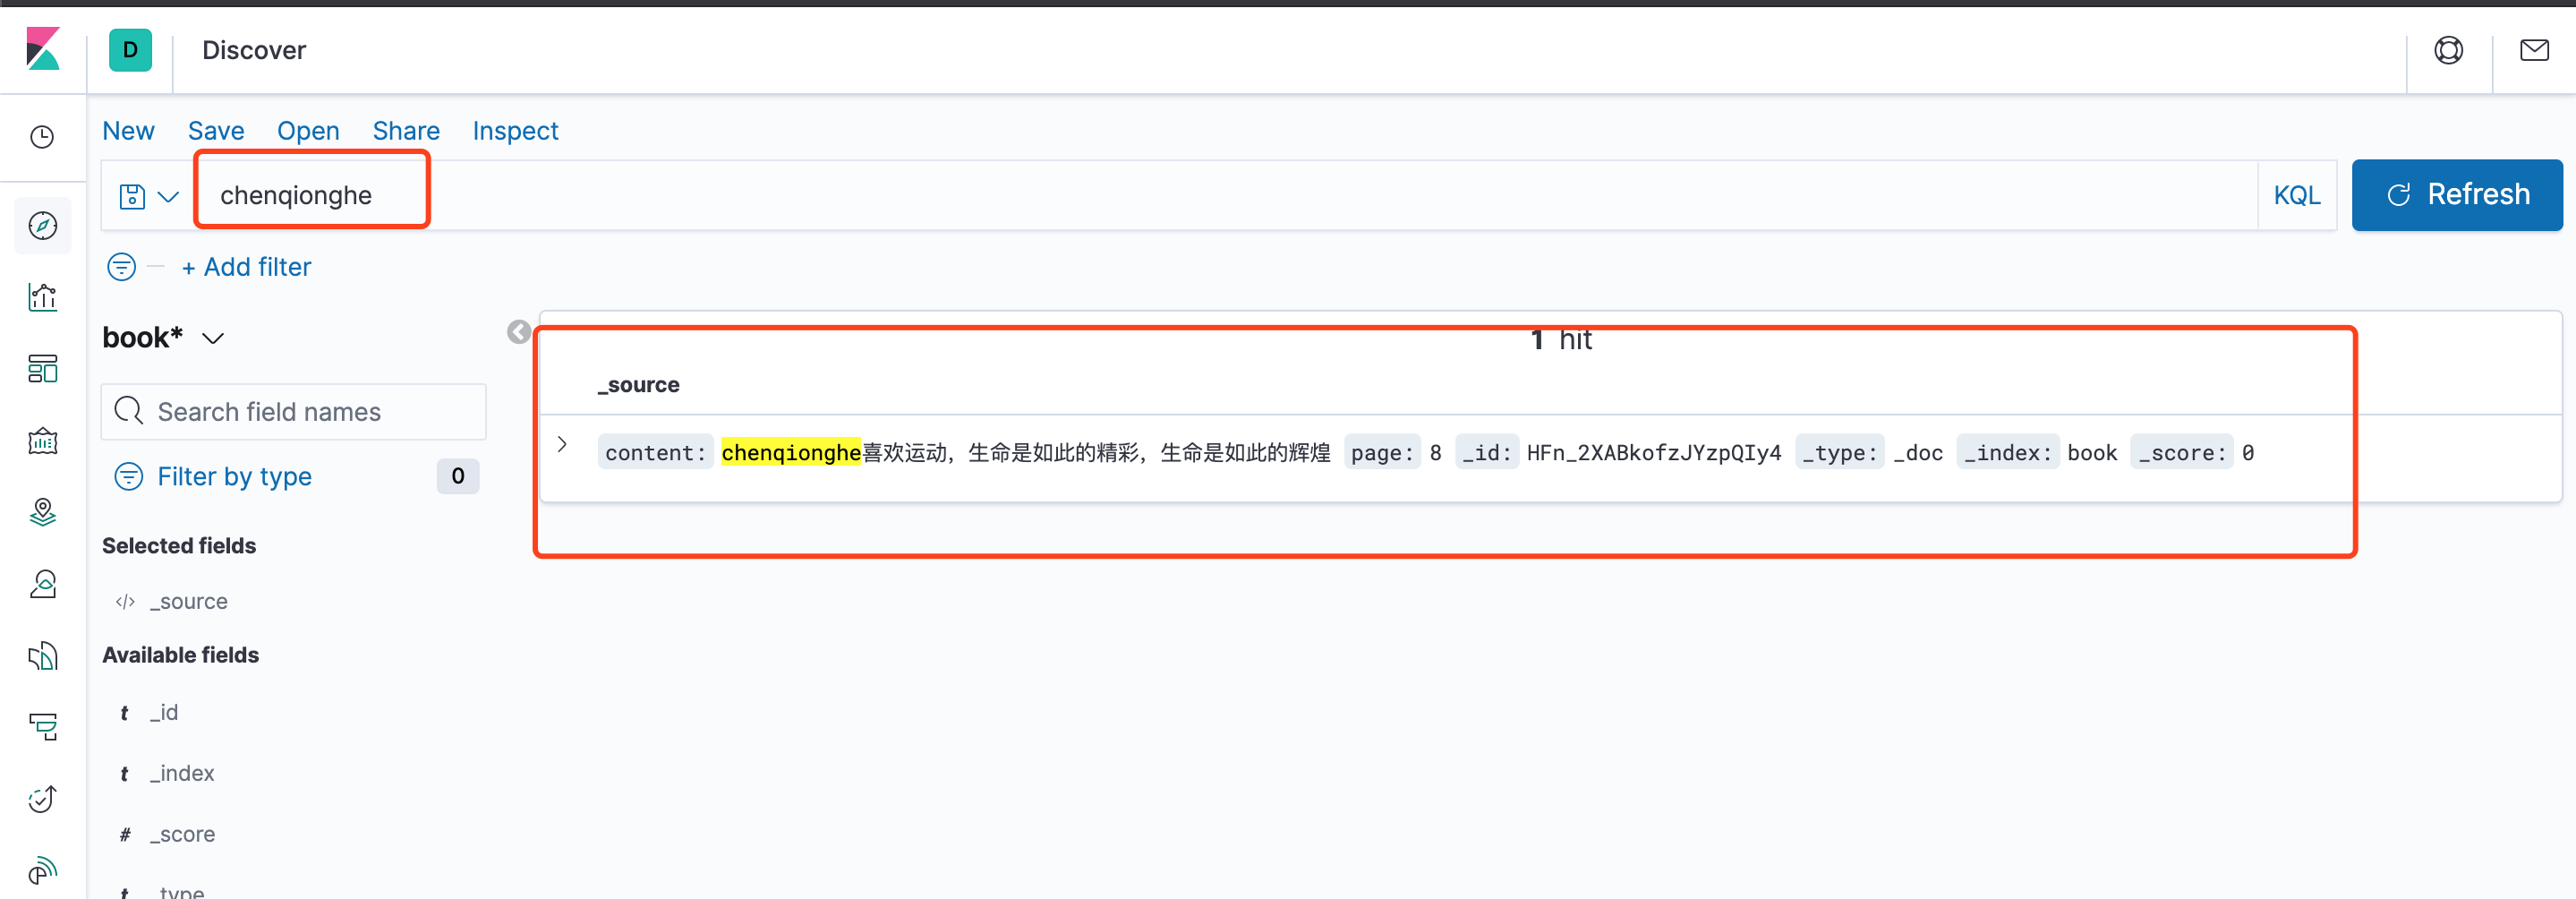
可以看到,已经能展示和检索出我们之前导入的数据,奥利给!
四、如何搜索数据

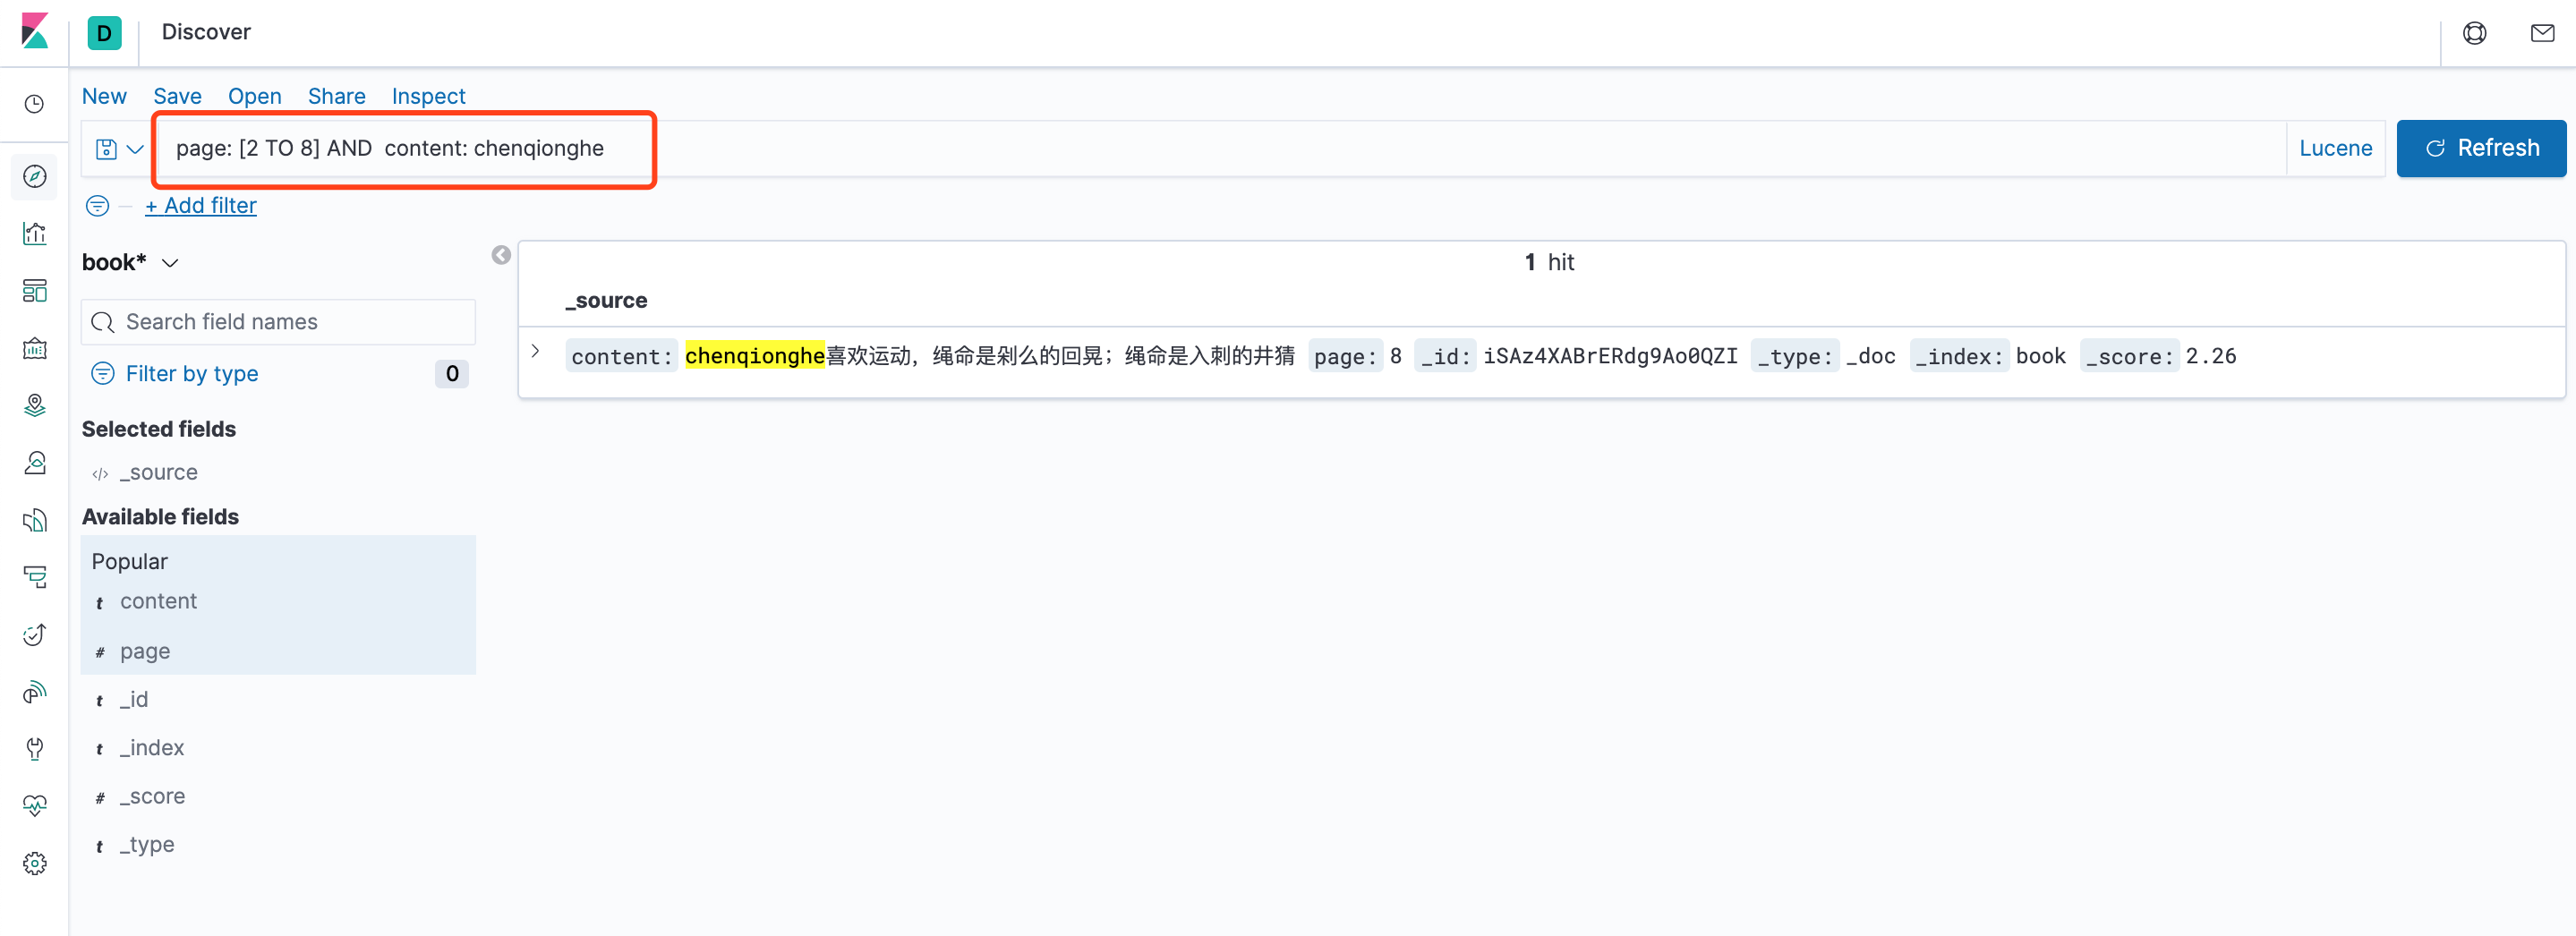
可以看到,我们能很方便地搜索栏使用Llucene查询,查询语法可以参考Lucene查询语法汇总
五、如何切换中文
在config/kibana.yml添加
i18n.locale: "zh-CN"
重新启动,即可生效
六、如何使用控制台
控制台插件提供一个用户界面来和 Elasticsearch 的 REST API 交互。控制台有两个主要部分: editor ,用来编写提交给 Elasticsearch 的请求; response 面板,用来展示请求结果的响应。在页面顶部的文本框中输入 Elasticsearch 服务器的地址。默认地址是:“localhost:9200”。
点击左侧栏的[Dev Tools],可以看到如下界面,可以很方便地执行命令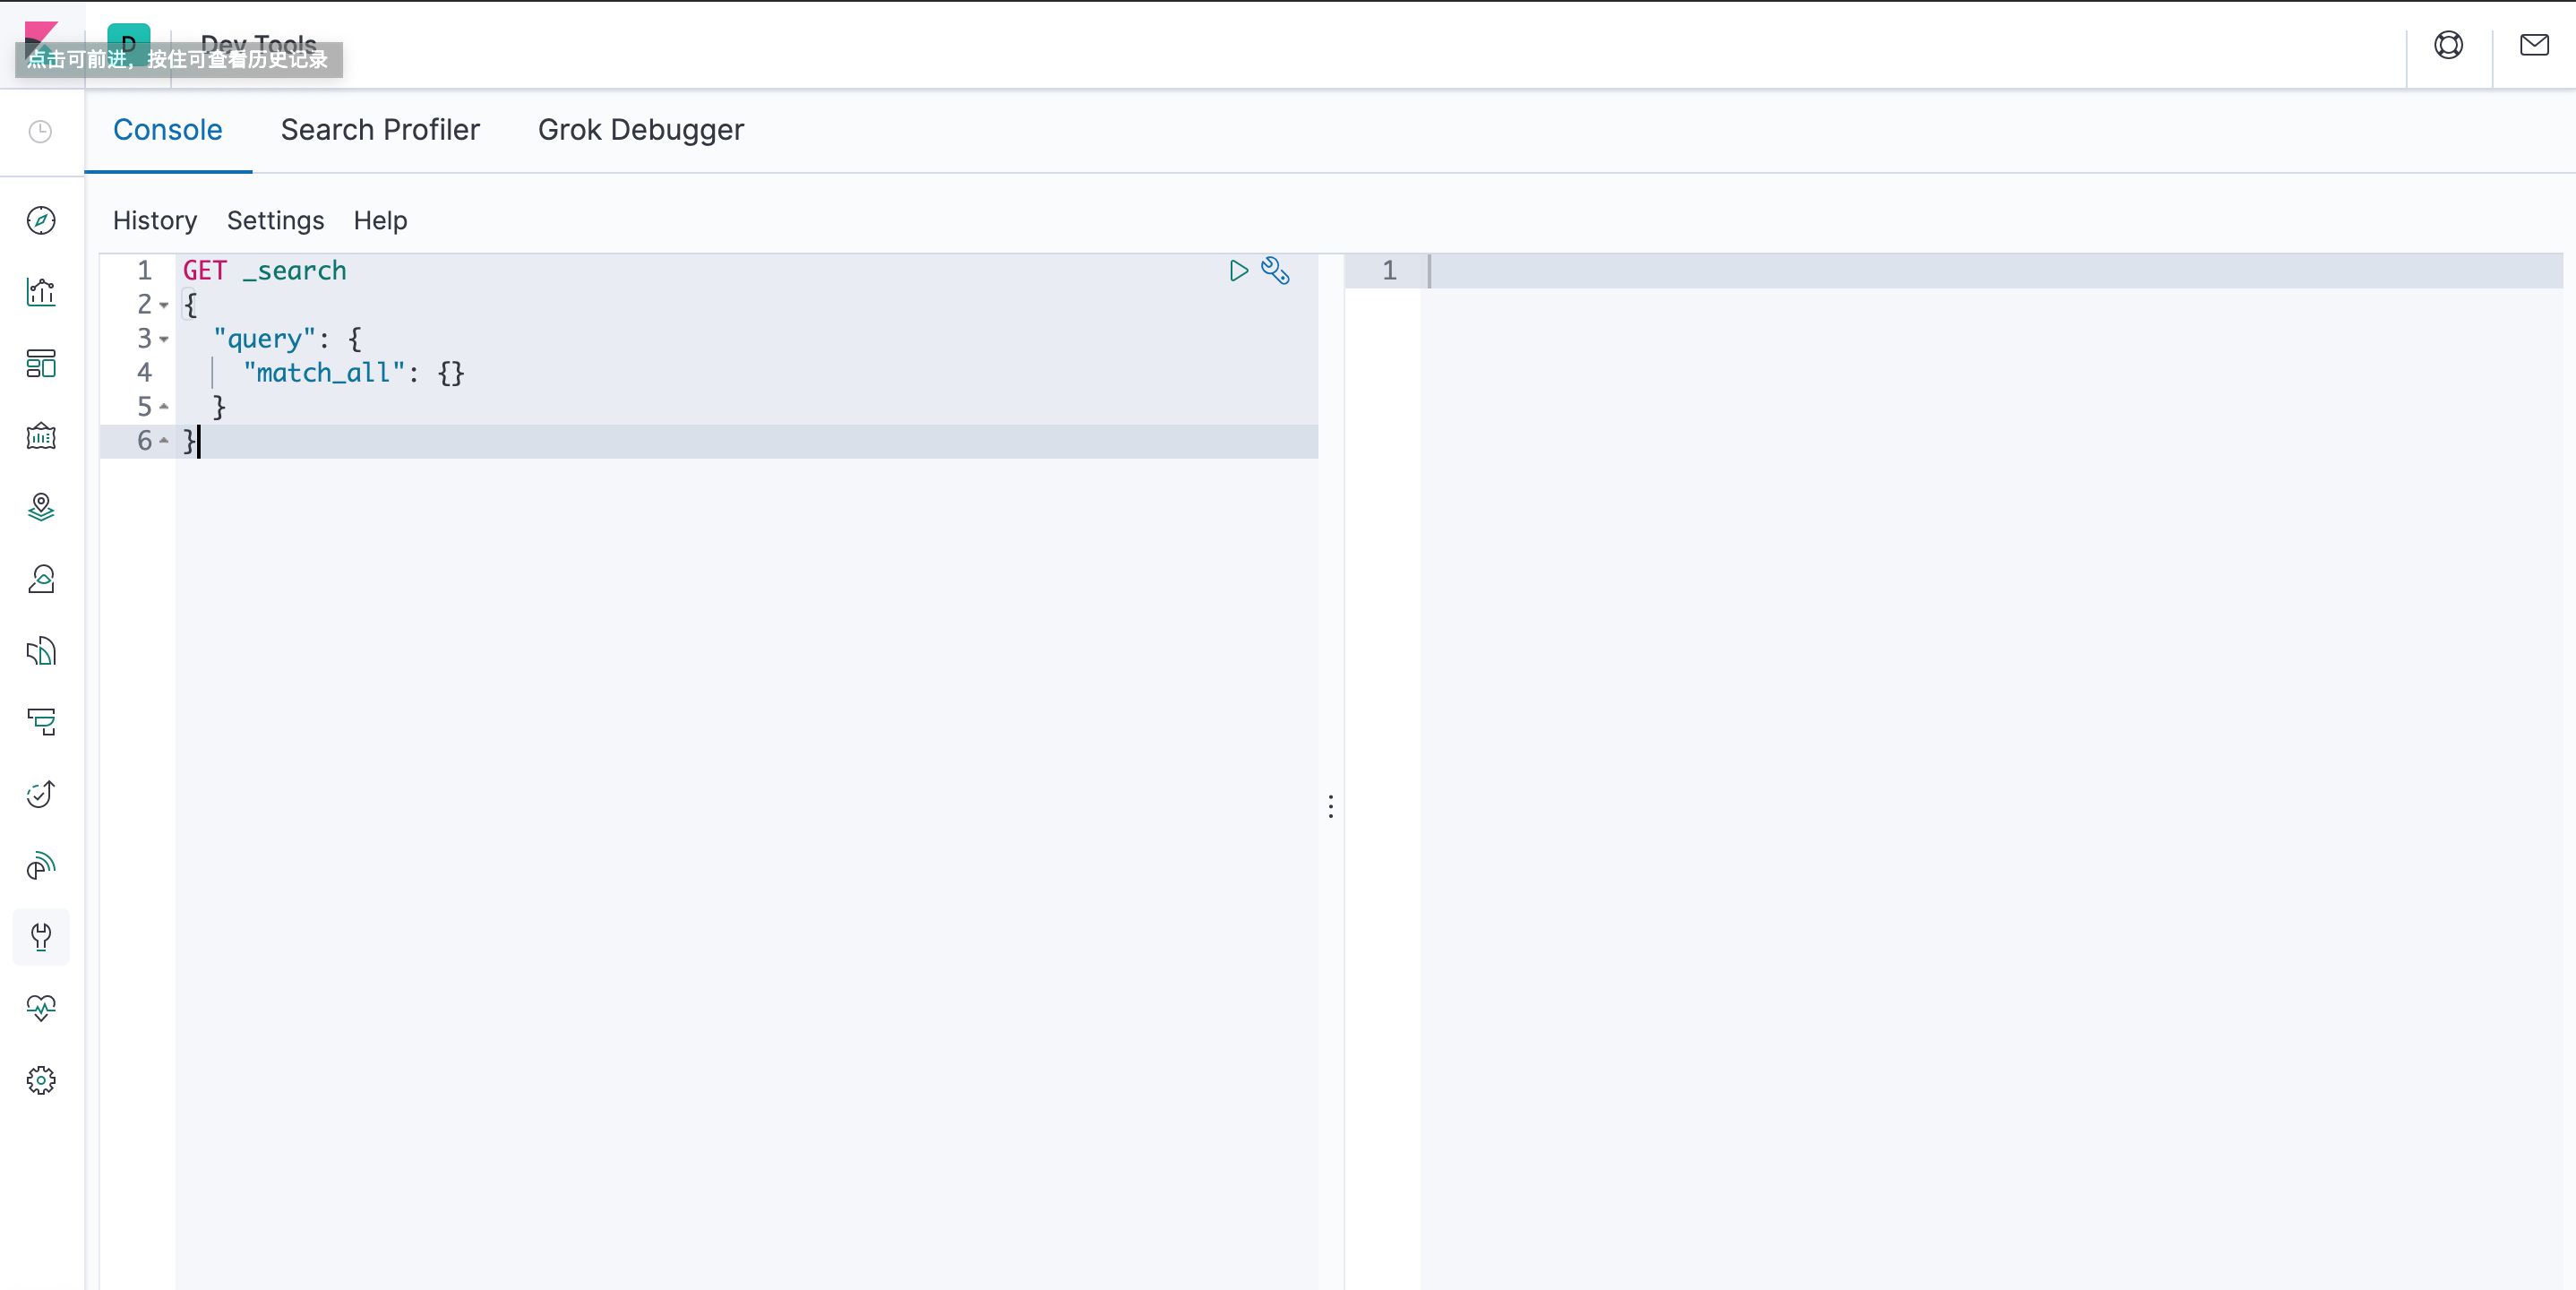
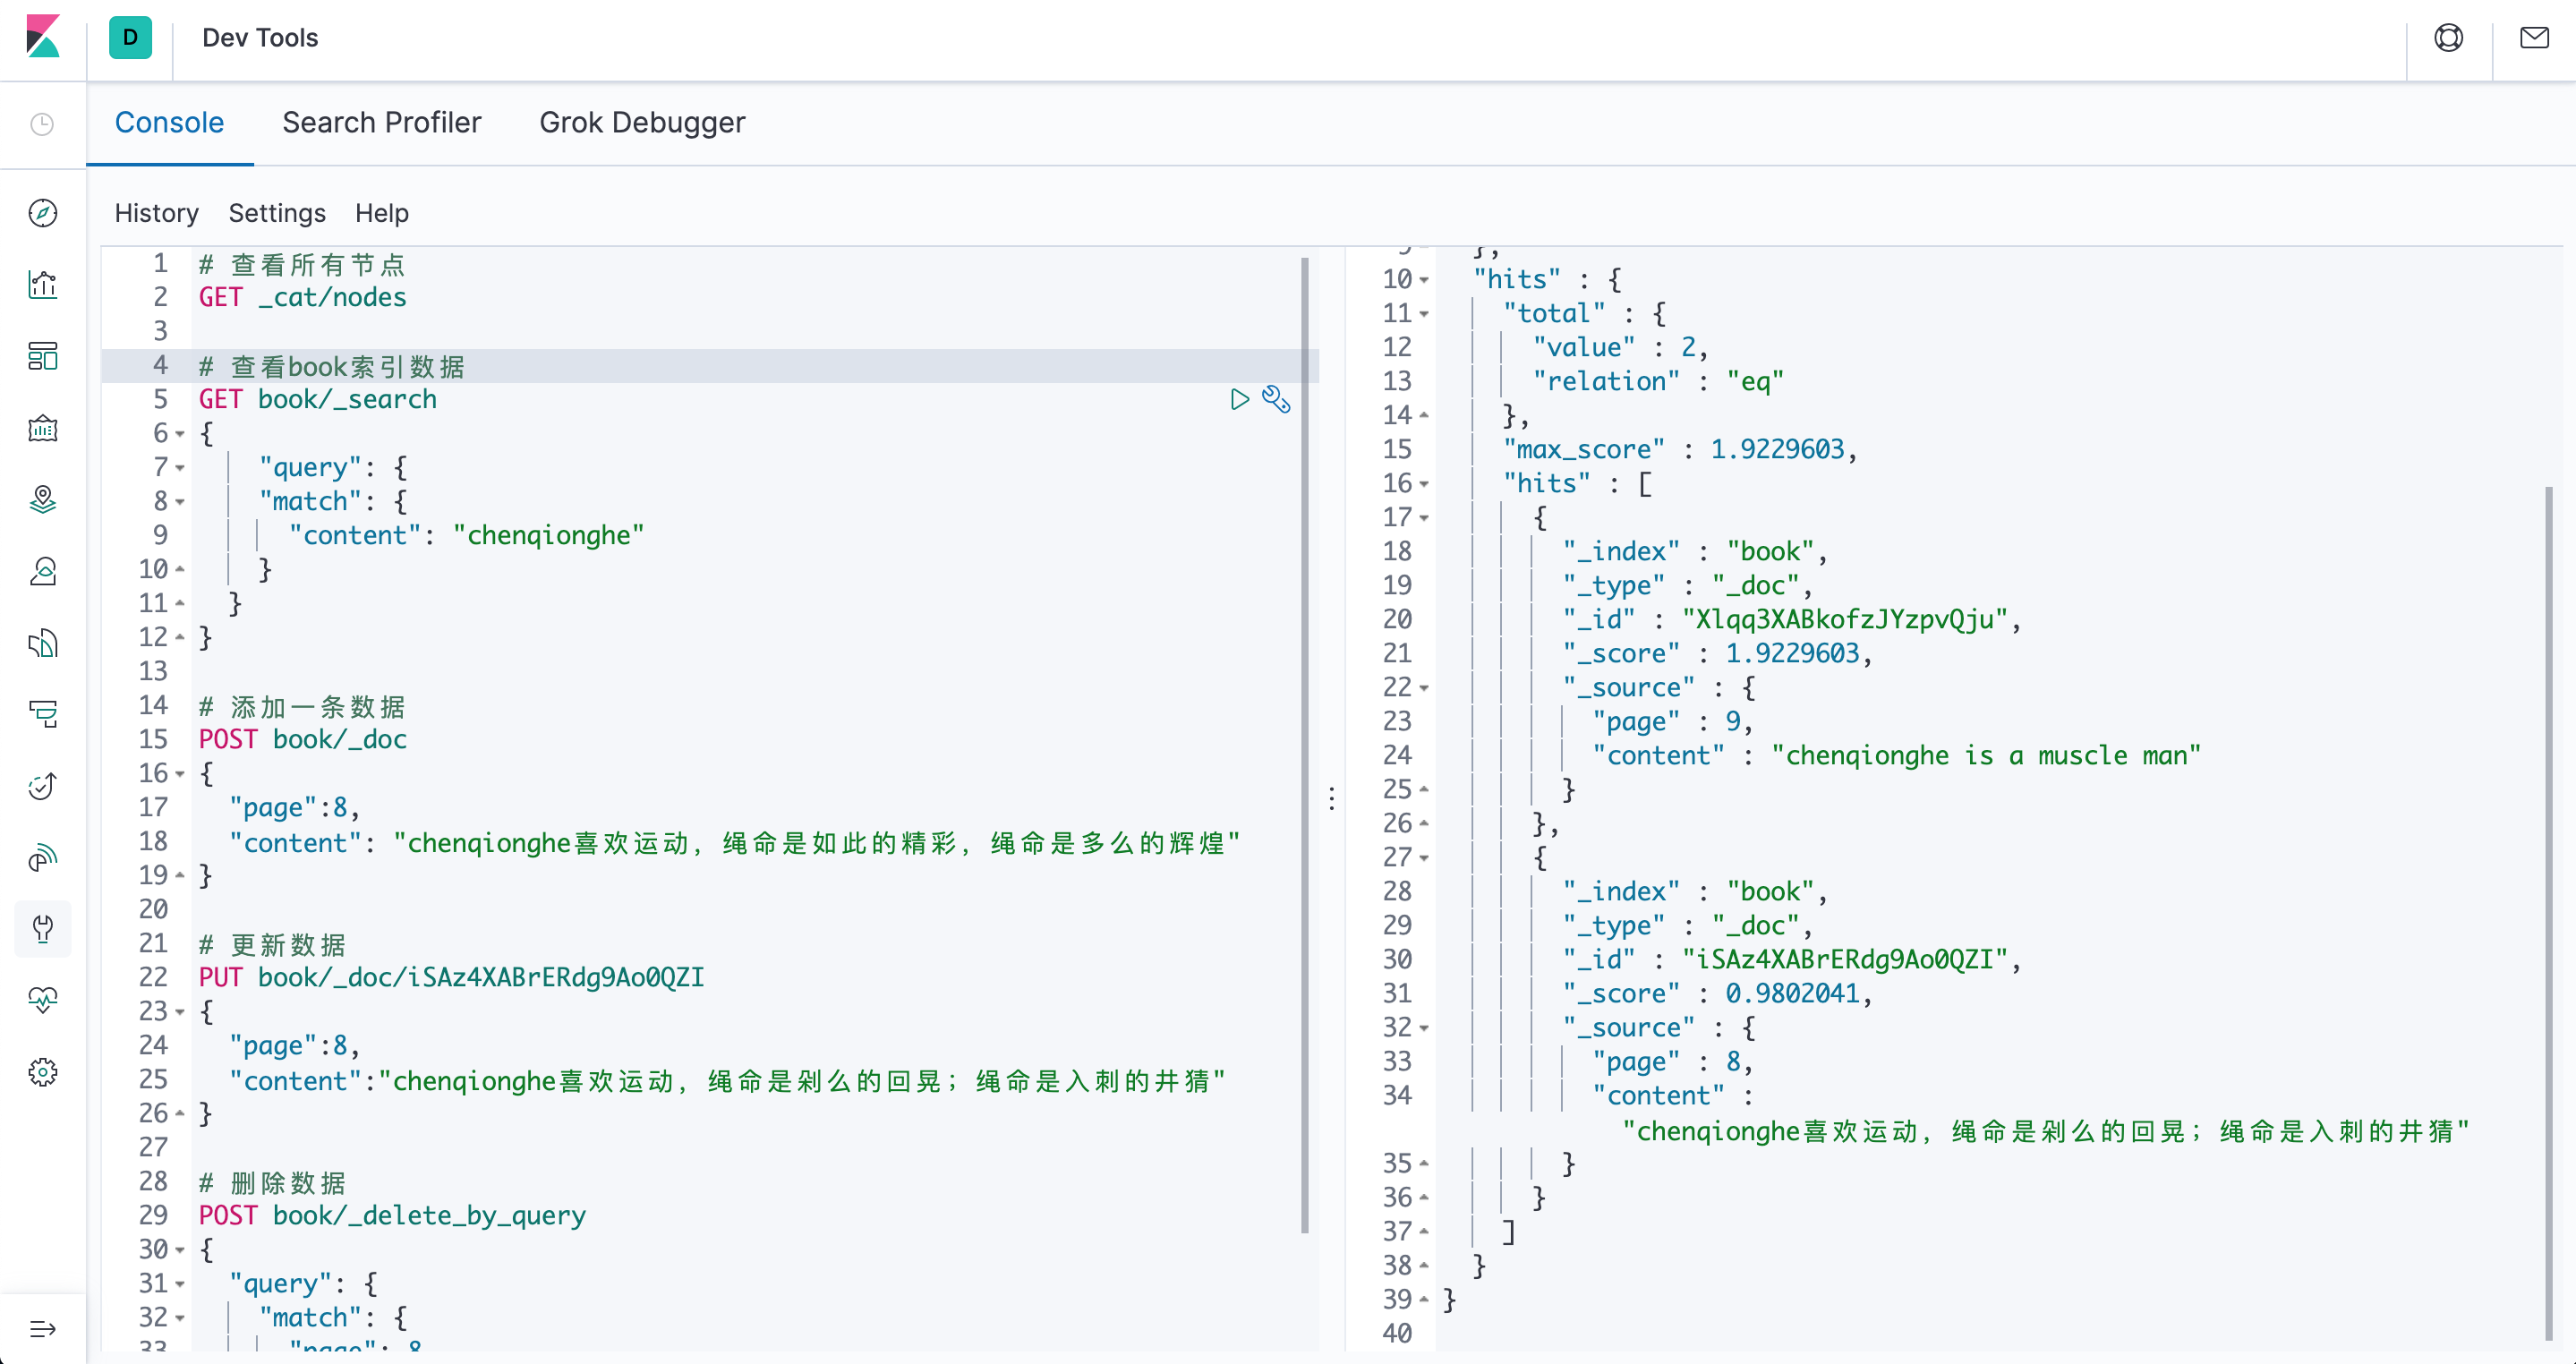
示例操作
# 查看所有节点
GET _cat/nodes
# 查看book索引数据
GET book/_search
{
"query": {
"match": {
"content": "chenqionghe"
}
}
}
# 添加一条数据
POST book/_doc
{
"page":8,
"content": "chenqionghe喜欢运动,绳命是如此的精彩,绳命是多么的辉煌"
}
# 更新数据
PUT book/_doc/iSAz4XABrERdg9Ao0QZI
{
"page":8,
"content":"chenqionghe喜欢运动,绳命是剁么的回晃;绳命是入刺的井猜"
}
# 删除数据
POST book/_delete_by_query
{
"query": {
"match": {
"page": 8
}
}
}
# 批量插入数据
POST book/_bulk
{ "index":{} }
{ "page":22 , "content": "Adversity, steeling will strengthen body.逆境磨练意志,锻炼增强体魄。"}
{ "index":{} }
{ "page":23 , "content": "Reading is to the mind, such as exercise is to the body.读书之于头脑,好比运动之于身体。"}
{ "index":{} }
{ "page":24 , "content": "Years make you old, anti-aging.岁月催人老,运动抗衰老。"}
{ "index":{} }
七、如何使用可视化
Kibana可视化控件基于 Elasticsearch 的查询。利用一系列的 Elasticsearch 查询聚合功能来提取和处理数据,再通过创建图表来呈现数据分布和趋势
点击Visualize菜单,进入可视化图表创建界面,Kibana自带有上10种图表,我们来创建一个自己的图表
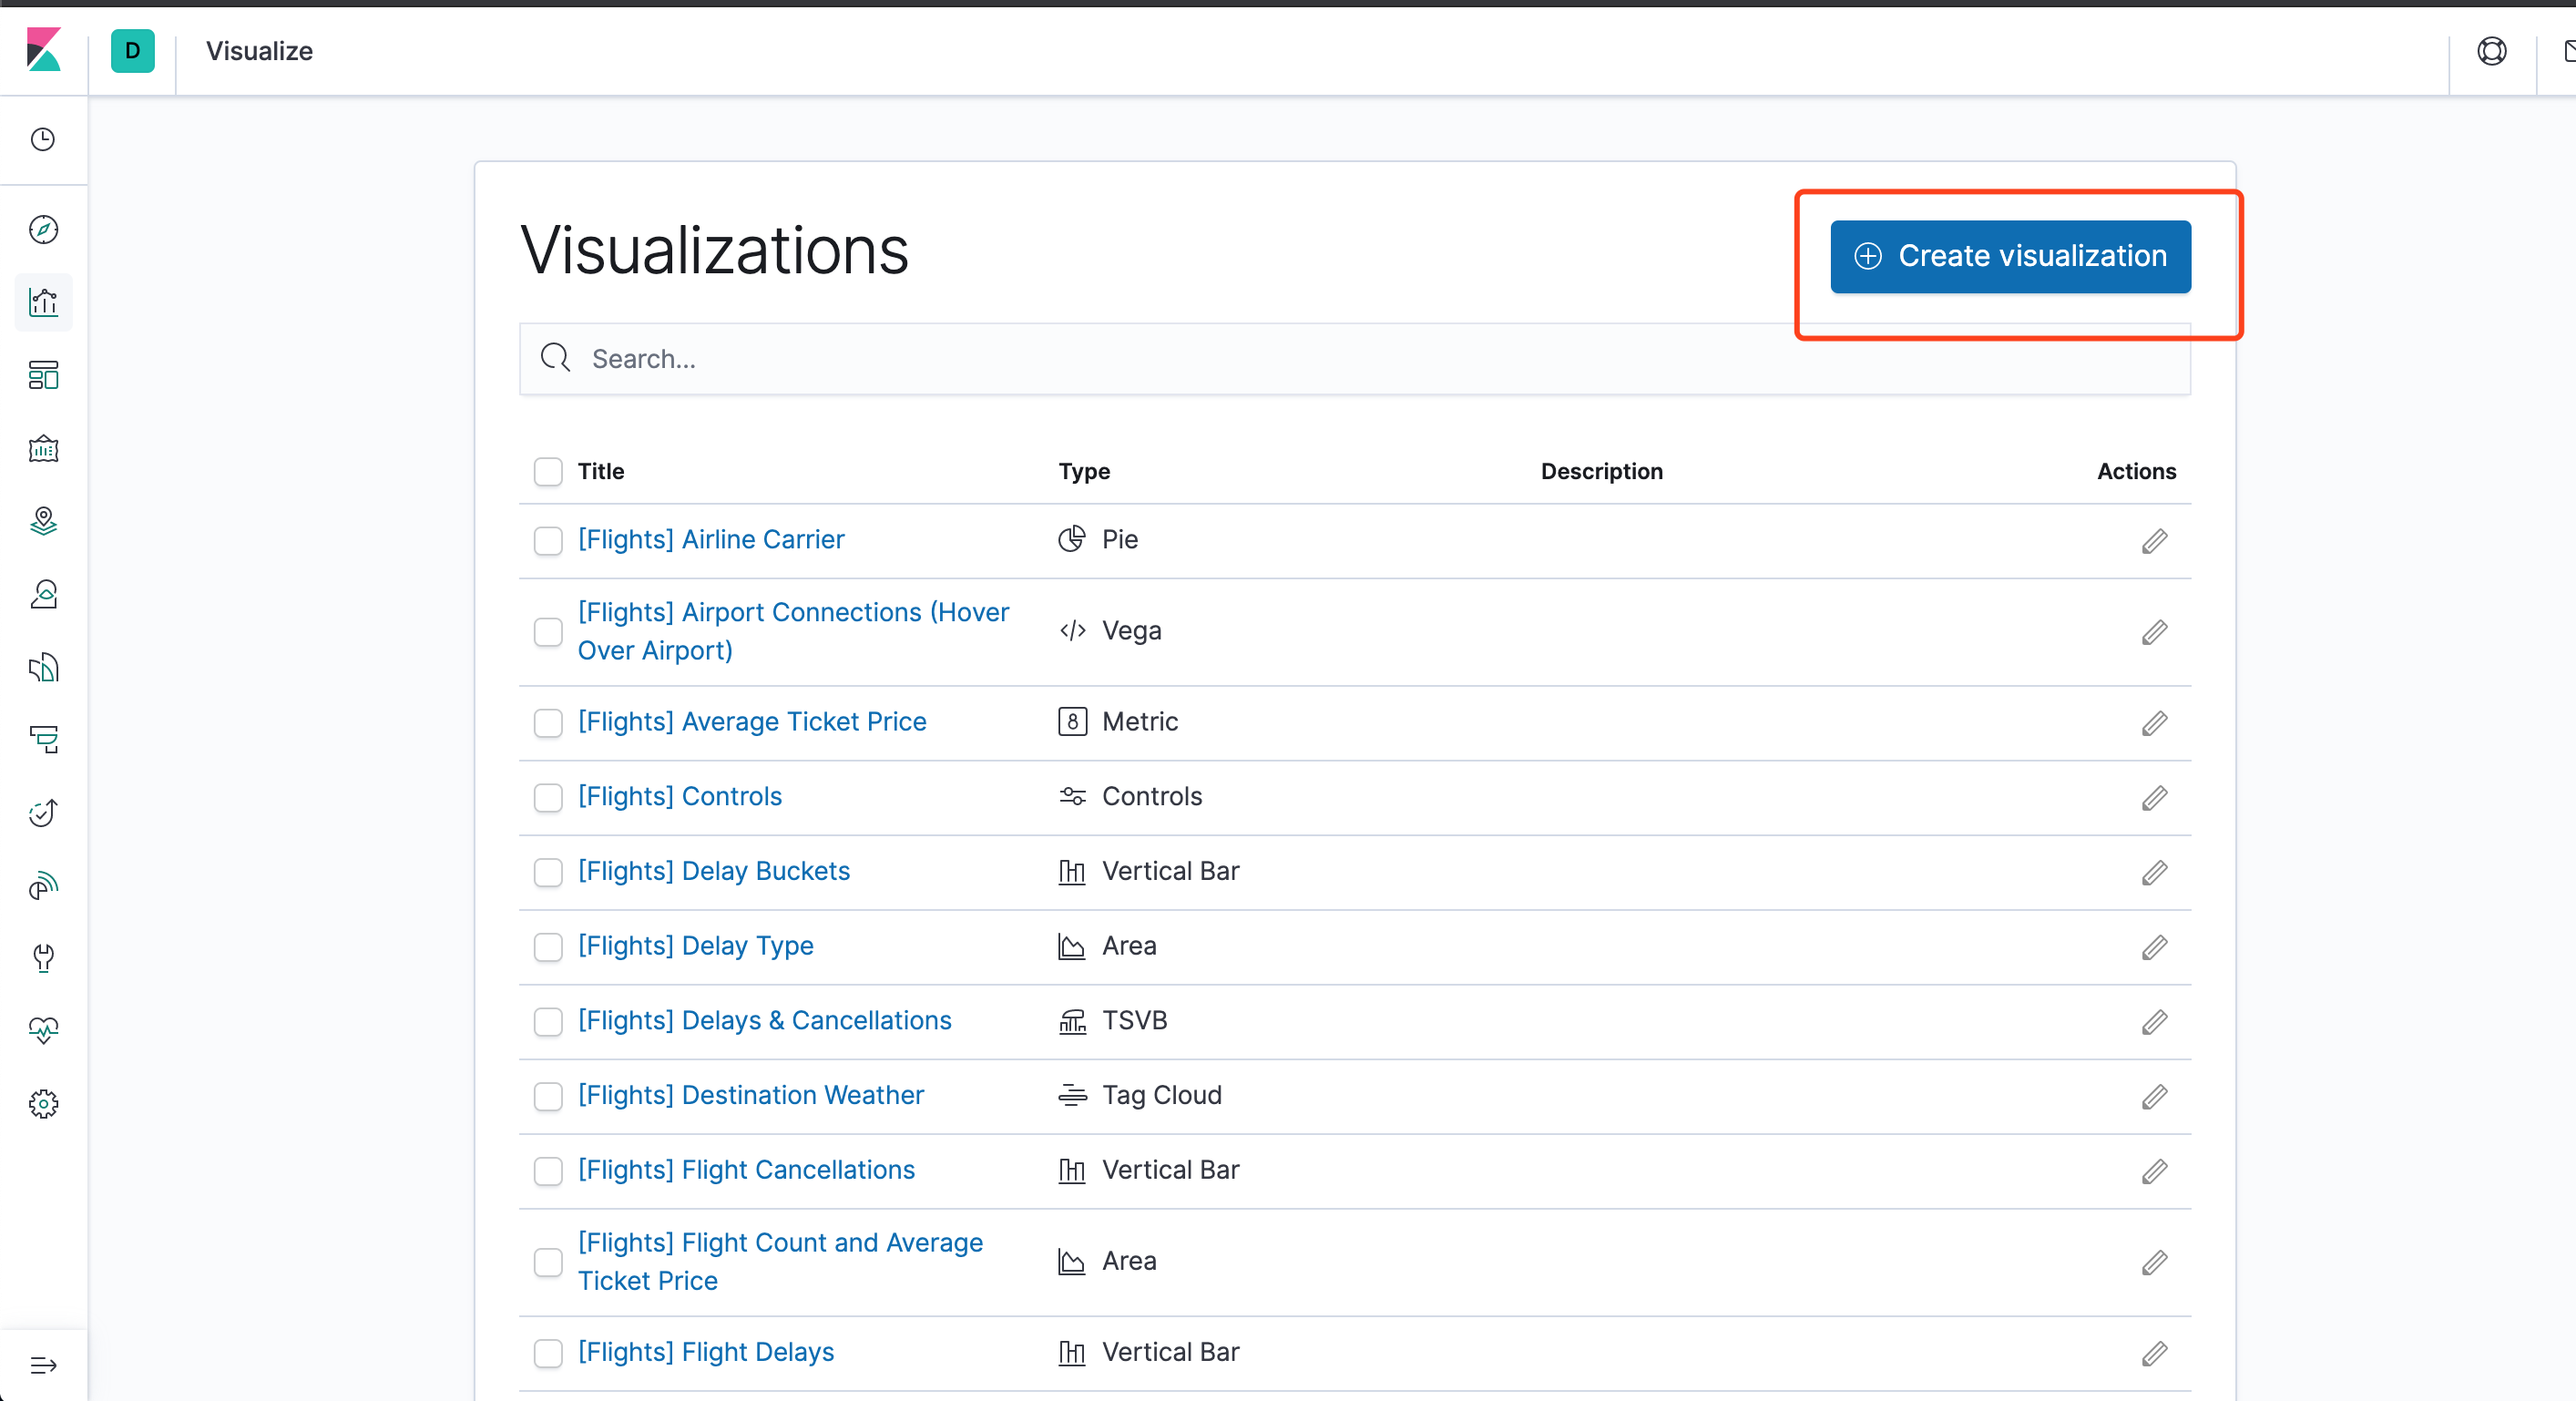
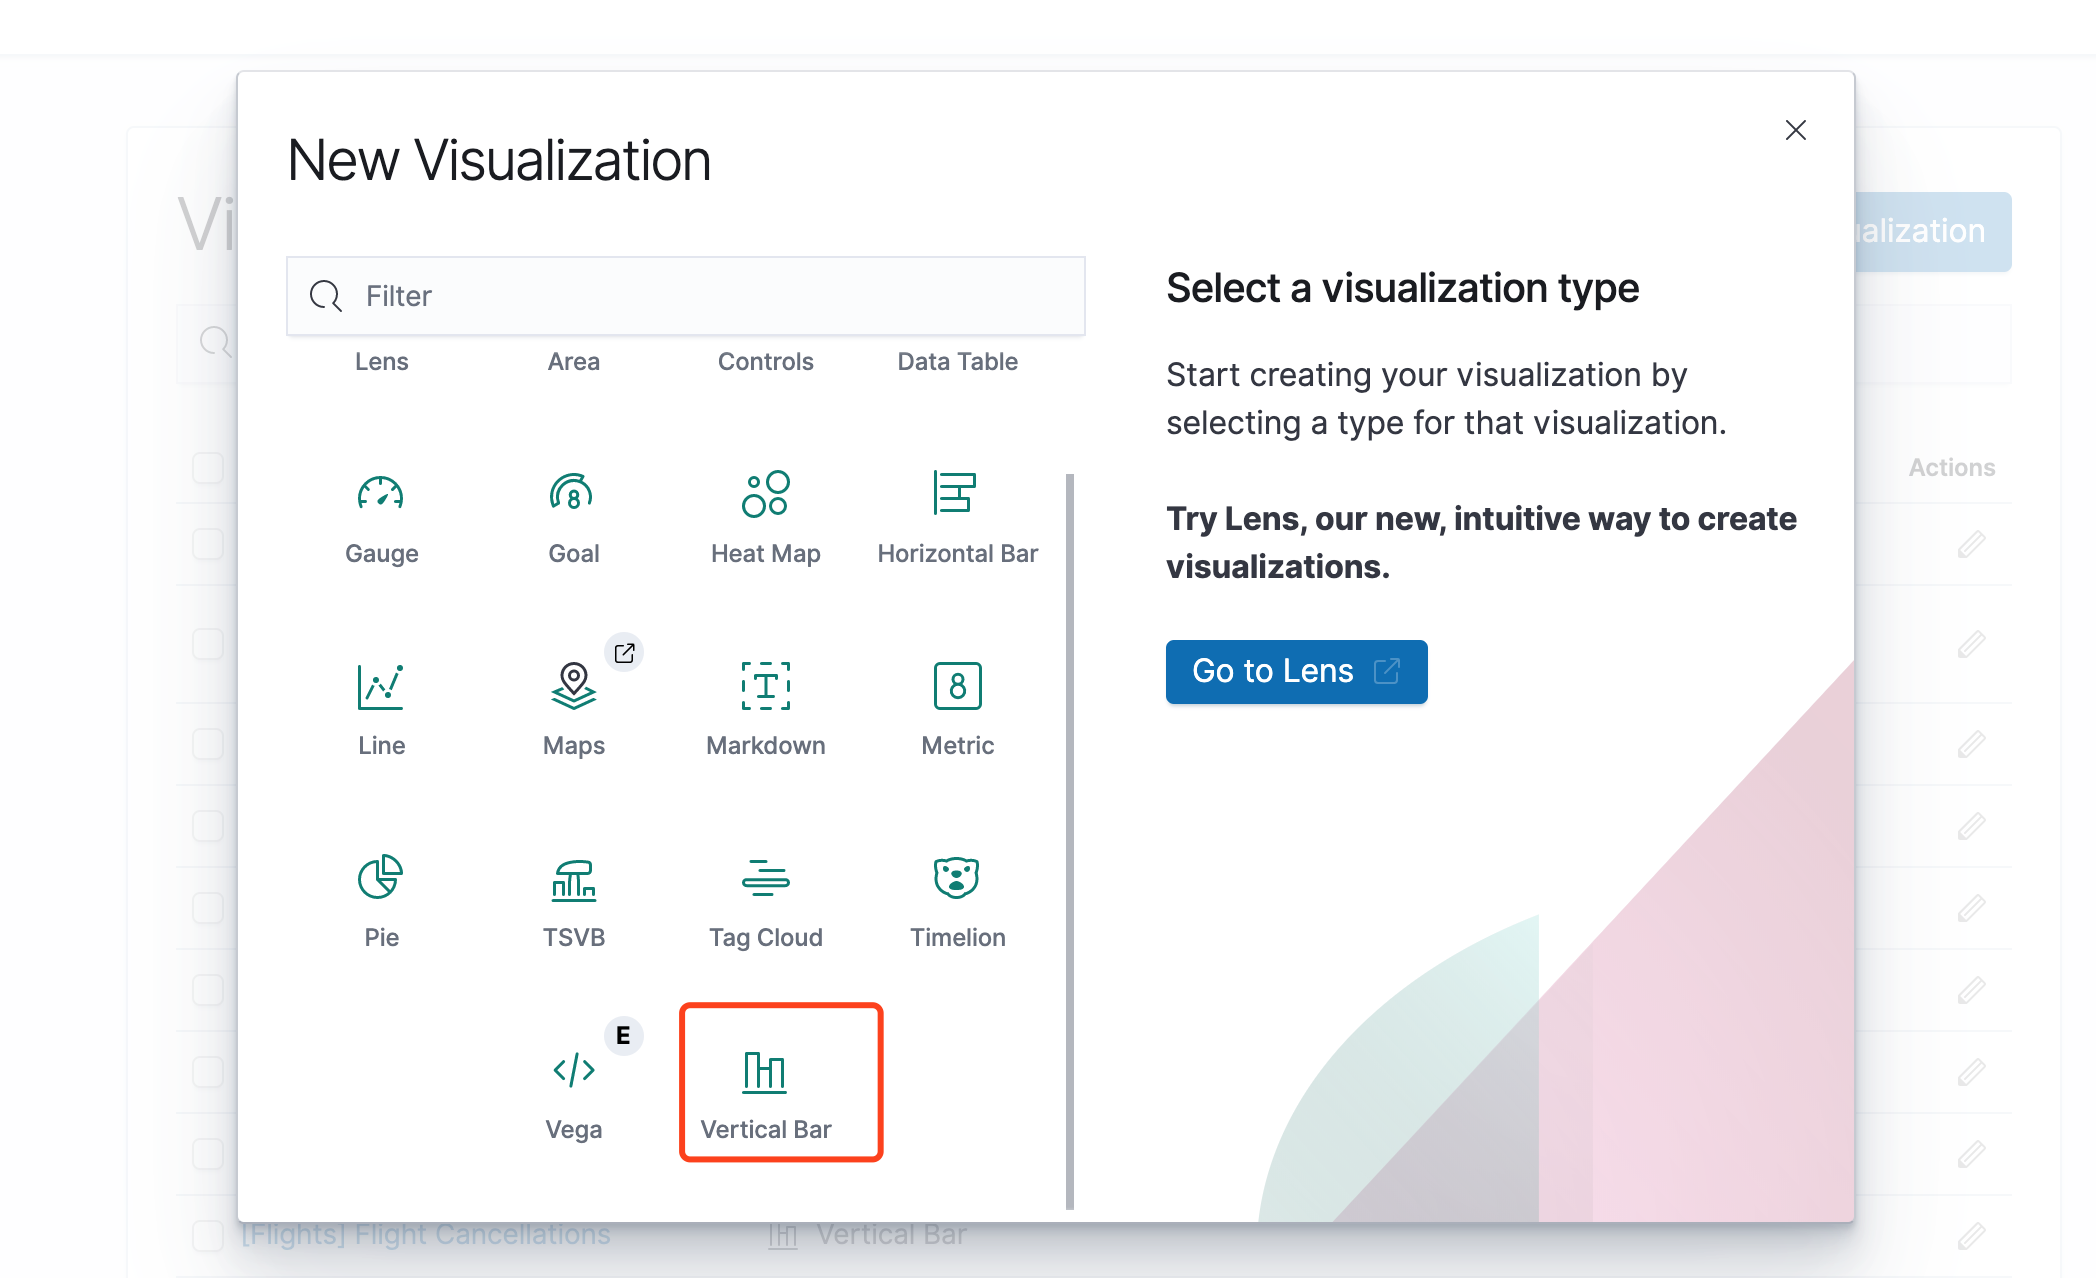
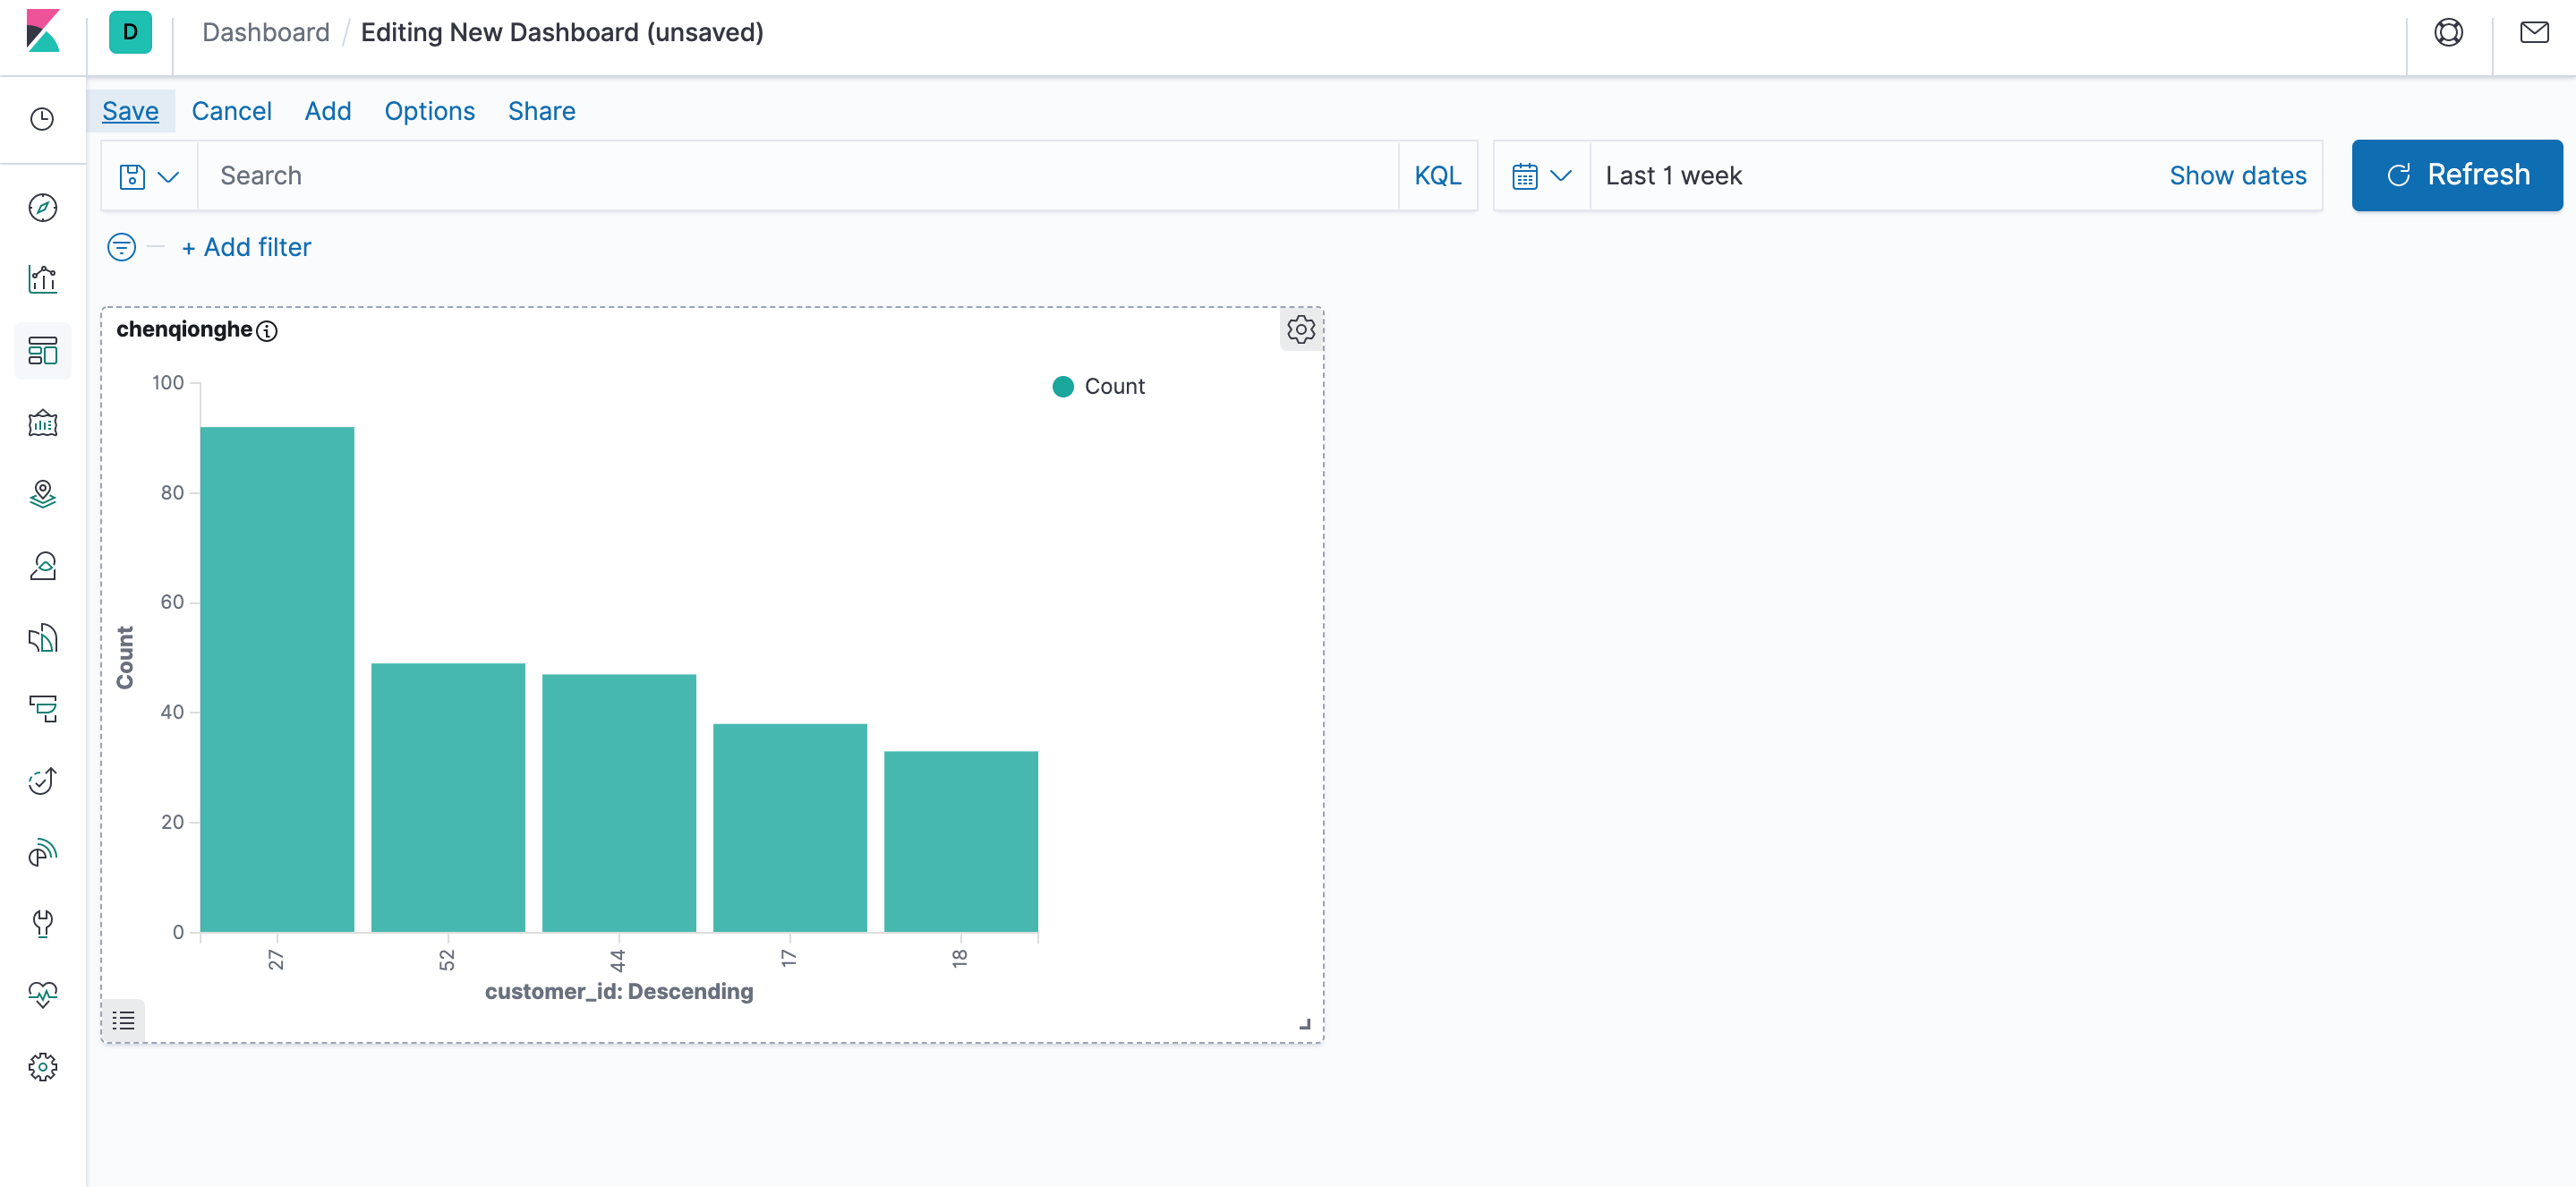
我们来添加一个直方图

可以看到,默认已经有一个Y轴了,统计的是数量,我们添加一个X轴,点击Buckets下的Add

如下,我选择了customer_id字段作为x轴
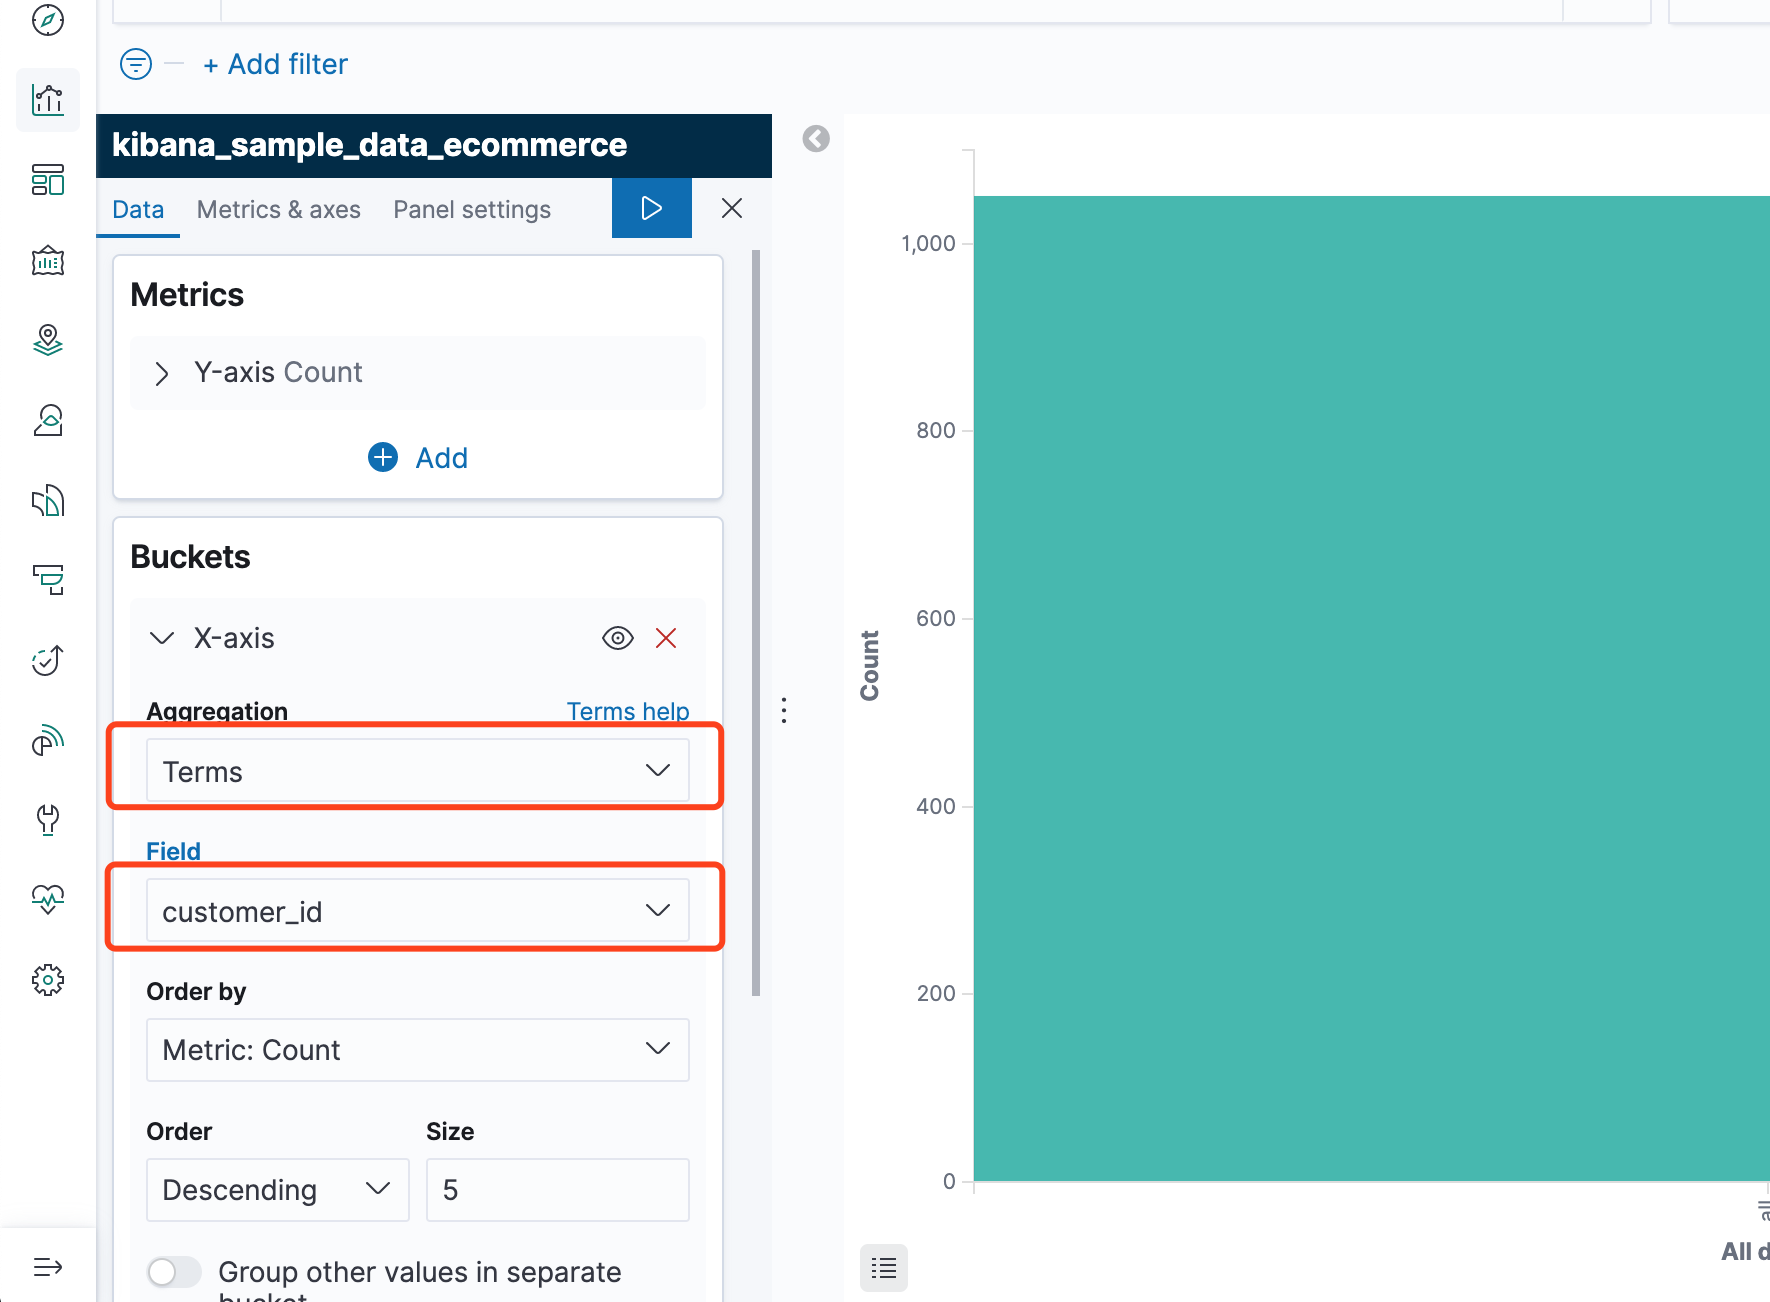
执行后如下

保存一下

八、如何使用仪表盘
Kibana 仪表板(Dashboard) 展示保存的可视化结果集合。
就是可以把上面定义好的图表展示
创建一个Dashboard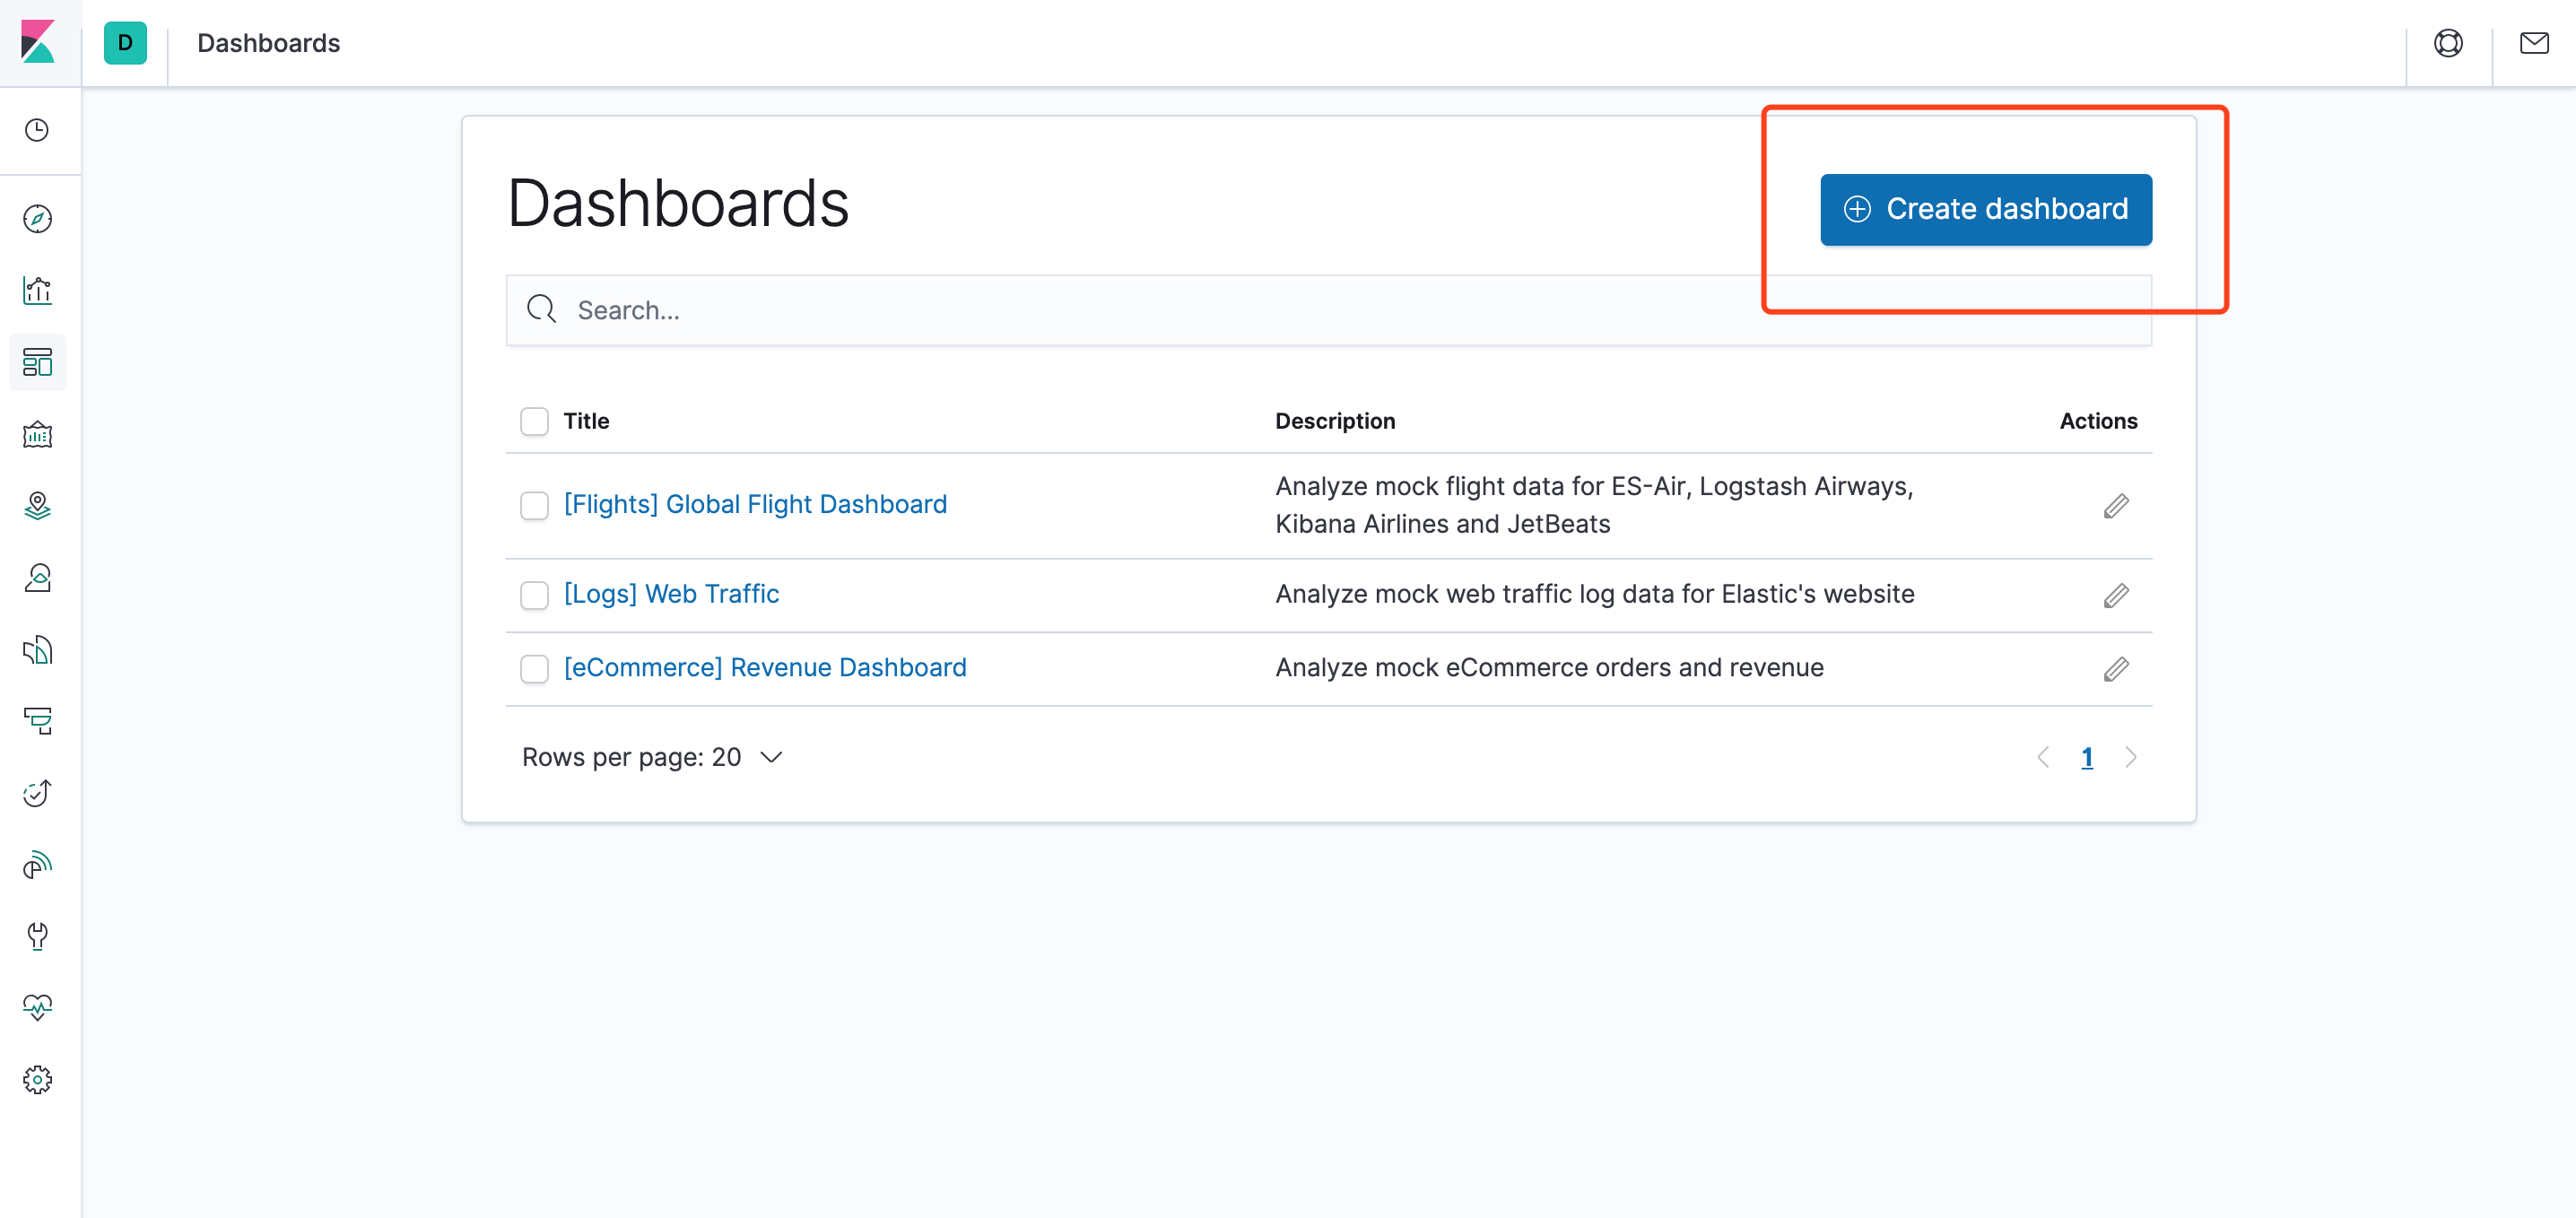
添加已经存在的图表

添加完后保存即可,我们可以定制出非常丰富的面板,如下

九、Elasticsearch常用命令
说明:案例中均为Java代码
# 查看索引ai设置
GET ai/_settings
# 删除索引ai
DELETE ai
# 简单创建索引ai
PUT /ai
# 创建映射索引ai
PUT ai
{
"settings": {
"number_of_shards": 3,
"number_of_replicas": 2
},
"mappings": {
"properties": {
"ID": {
"type": "text",
"index": false
},
"EXPRESSION_KEYWORD": {
"type": "text"
},
"EXPRESSION": {
"type": "binary"
},
"EXPRESSION_URL": {
"type": "text",
"index": false
},
"EXPRESSION_LENGTH": {
"type": "double",
"index": false
},
"EXPRESSION_SIZE": {
"type": "text",
"index": false
},
"EXPRESSION_LONG": {
"type": "double",
"index": false
},
"EXPRESSION_WIDE": {
"type": "double",
"index": false
},
"AUDIO": {
"type": "binary"
},
"AUDIO_FORMAT": {
"type": "text",
"index": false
},
"AUDIO_URL": {
"type": "text",
"index": false
},
"AUDIO_LENGTH": {
"type": "double",
"index": false
},
"FLAG": {
"type": "integer",
"index": false
}
}
}
}
# 插入/修改数据
[a003]代表数据ID,如果没有则会创建该数据
POST ai/_doc/a001
{
"ID": "a001",
"EXPRESSION_KEYWORD": "吃饭",
"EXPRESSION": "",
"EXPRESSION_URL": "http://192.168.0.160:9000/expression/44925012.gif",
"EXPRESSION_LENGTH": 69.7,
"EXPRESSION_SIZE": "240*240",
"EXPRESSION_LONG": 240,
"EXPRESSION_WIDE": 240,
"AUDIO": "",
"AUDIO_FORMAT": "",
"AUDIO_URL": "",
"AUDIO_LENGTH": "",
"FLAG": 1
}
POST ai/_doc/a002
{
"ID": "a002",
"EXPRESSION_KEYWORD": "吃饭",
"EXPRESSION": "",
"EXPRESSION_URL": "http://192.168.0.160:9000/expression/44925017.gif",
"EXPRESSION_LENGTH": 10.35,
"EXPRESSION_SIZE": "400*400",
"EXPRESSION_LONG": 400,
"EXPRESSION_WIDE": 400,
"AUDIO": "",
"AUDIO_FORMAT": "",
"AUDIO_URL": "",
"AUDIO_LENGTH": "",
"FLAG": 1
}
POST ai/_doc/a003
{
"ID": "a003",
"EXPRESSION_KEYWORD": "吃饭3",
"EXPRESSION": "",
"EXPRESSION_URL": "http://192.168.0.160:9000/expression/44925017.gif",
"EXPRESSION_LENGTH": 10.35,
"EXPRESSION_SIZE": "400*400",
"EXPRESSION_LONG": 400,
"EXPRESSION_WIDE": 400,
"AUDIO": "",
"AUDIO_FORMAT": "",
"AUDIO_URL": "",
"AUDIO_LENGTH": "",
"FLAG": 1
}
#批量插入数据
POST _bulk
{ "index" : { "_index" : "ai", "_id" : "1" } }
{ "EXPRESSION_KEYWORD" : "张三", "ID": "1"}
{ "index" : { "_index" : "ai", "_id" : "2" } }
{ "EXPRESSION_KEYWORD" : "李四", "ID": "2" }
{ "index" : { "_index" : "ai", "_id" : "3" } }
{ "EXPRESSION_KEYWORD" : "王五", "ID": "3" }
{ "index" : { "_index" : "ai", "_id" : "4" } }
{ "EXPRESSION_KEYWORD" : "陈六", "ID": "4" }
#删除数据,
[a003]表示主键id
DELETE /ai/_doc/a003
#查询所有数据
GET /ai/_search?q=*
GET /ai/_search?
#查询带参数数据
GET /ai/_search?q=*&q=3
#查询分页数据
GET /ai/_search?from=0&size=2&q=吃
#根据ID查询
GET /ai/_doc/a003


 1131
1131

 被折叠的 条评论
为什么被折叠?
被折叠的 条评论
为什么被折叠?
 到【灌水乐园】发言


