


 本文详细介绍了如何在Vue项目中安装和使用Echarts,包括全局、局部及按需引入的方式,并展示了柱状图、饼状图和折线图的配置与实现,还提及了响应式布局和自定义配置的方法。
本文主要简单介绍Echarts在Vue项目中的简单使用。
安装
npm install echarts
引入
1、全局引入
1-1、在main.js中全局引入
import * as Echarts from "echarts";
Vue.prototype.$echarts = echarts
1-2、实现一个简单的图像组件
<template>
<div style="width: 400px; height: 300px" ref="chart"></div>
</template>
<script>
export default {
data() {
return {
chart: null,
};
},
mounted() {
this.init();
},
methods: {
init() {
//2.初始化
this.chart = this.$echarts.init(this.$refs.chart);
//3.配置数据
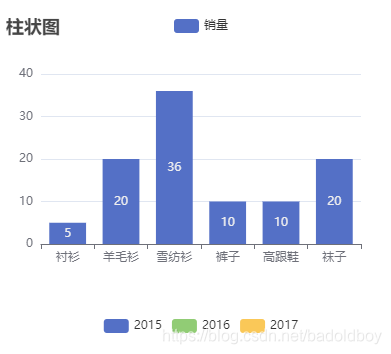
let option = {
title: {
text: "柱状图",
},
tooltip: {},
legend: {
data: ["销量"],
},
xAxis: {
data: ["衬衫", "羊毛衫", "雪纺衫", "裤子", "高跟鞋", "袜子"],
},
yAxis: {},
series: [
{
name: "销量",
type: "bar",
label: {
show: true, //是否在图上展示数据 // position:'top',//数据在柱状图顶部显示
textStyle: {
// color: "#000000", //数据颜色
},
formatter: "{c}", //显示百分比
},
data: [5, 20, 36, 10, 10, 20],
},
],
};
// 4.传入数据
this.chart.setOption(option);
},
},
};
</script>
<style>
</style>
效果
2、局部引入
2-1、在需要的页面引入
<template>
		<div style="width: 400px; height: 300px" ref="chart"></div>
</template>
<script>
import * as Echarts from "echarts";
	export default {
		data() {
			return {
			chart: null,
			};
		},
		 mounted() {
    this.init();
  },
  methods: {
    init() {
      //2.初始化
      this.chart = Echarts.init(this.$refs.chart);
      //3.配置数据
      let option = {
        title: {
          text: "柱状图",
        },
        tooltip: {},
        legend: {
          data: ["销量"],
        },
        xAxis: {
          data: ["衬衫", "羊毛衫", "雪纺衫", "裤子", "高跟鞋", "袜子"],
        },
        yAxis: {},
        series: [
          {
            name: "销量",
            type: "bar",
             label: {
                  show: true, //是否在图上展示数据 // position:'top',//数据在柱状图顶部显示
                  textStyle: {
                    // color: "#000000", //数据颜色
                  },
                  formatter: "{c}", //显示百分比
                },
            data: [5, 20, 36, 10, 10, 20],
          },

        ],
      };
      // 4.传入数据
      this.chart.setOption(option);
    },
  },
};
</script>
<style>

</style>
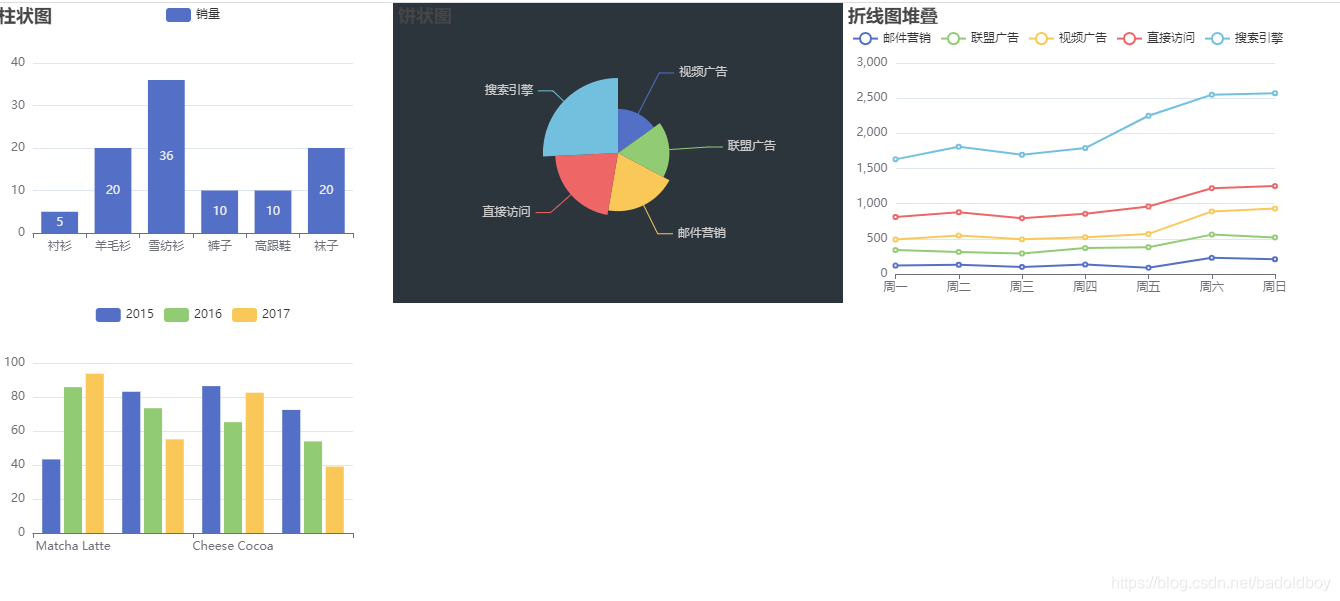
3、按需引入(在所需要的页面)
<template>
		<div style="display: flex">
              <div style="width: 400px; height: 300px" ref="chart"></div>
              <div style="width: 450px; height: 300px" ref="chart_1"></div>
              <div style="width: 450px; height: 300px" ref="chart_2"></div>
            </div>
            <div style="width: 400px; height: 300px" ref="chart_3"></div>
</template>
<script>
import * as echarts from "echarts/core"; // 引入 echarts 核心模块,核心模块提供了 echarts 使用必须要的接口。
import { BarChart, PieChart, LineChart } from "echarts/charts";// 引入柱状图图表,图表后缀都为Chart,也可以引入其他图表
import {
  TitleComponent,
  TooltipComponent,
  GridComponent,
  LegendComponent,
  DatasetComponent
} from "echarts/components"; // 引入提示框,标题,直角坐标系组件,组件后缀都为 Component
import { CanvasRenderer } from "echarts/renderers"; // 引入 Canvas 渲染器,注意引入 CanvasRenderer 或者 SVGRenderer 是必须的一步
echarts.use([
  TitleComponent,
  TooltipComponent,
  GridComponent,
  BarChart,
  PieChart,
  LineChart,
  CanvasRenderer,
   LegendComponent,
  DatasetComponent
]);// 注册必须的组件
// 接下来的使用就跟之前一样,初始化图表,设置配置项
export default {
  data() {
    return {

        chart: null,
    };
  },
  mounted() {
    this.init();
    window.addEventListener("resize", () => {
      this.chart.resize();
    }); //让图表实现响应式布局
  },
  methods: {
    init() {
      //2.初始化
      this.chart = echarts.init(this.$refs.chart);
      this.chart_1 = echarts.init(this.$refs.chart_1);
      this.chart_2 = echarts.init(this.$refs.chart_2);
      this.chart_3 = echarts.init(this.$refs.chart_3);
      //3.配置数据
      let option = {
        title: {
          text: "柱状图",
        },
        tooltip: {},
        legend: {
          data: ["销量"],
        },
        xAxis: {
          data: ["衬衫", "羊毛衫", "雪纺衫", "裤子", "高跟鞋", "袜子"],
        },
        yAxis: {},
        series: [
          {
            name: "销量",
            type: "bar",
             label: {
                  show: true, //是否在图上展示数据 // position:'top',//数据在柱状图顶部显示
                  textStyle: {
                    // color: "#000000", //数据颜色
                  },
                  formatter: "{c}", //显示百分比
                },
            data: [5, 20, 36, 10, 10, 20],
          },

        ],
      };

      let option1 = {
        backgroundColor: "#2c343c",
        title: {
          text: "饼状图",
        },

        series: [
          {
            name: "访问来源",
            roseType: true,
            type: "pie",
            radius: "50%",
            data: [
              { value: 235, name: "视频广告" },
              { value: 274, name: "联盟广告" },
              { value: 310, name: "邮件营销" },
              { value: 335, name: "直接访问" },
              { value: 400, name: "搜索引擎" },
            ],
          },
        ],
      };

      let option2 = {
        title: {
          text: "折线图堆叠",
        },
        tooltip: {
          trigger: "axis",
        },
        legend: {
          show: true,
          top: "8%",
          data: ["邮件营销", "联盟广告", "视频广告", "直接访问", "搜索引擎"],
        },
        grid: {
          left: "3%",
          right: "4%",
          bottom: "3%",
          containLabel: true,
        },
        // toolbox: {
        //   feature: {
        //     saveAsImage: {},
        //   },
        // },
        xAxis: {
          type: "category",
          boundaryGap: false,
          data: ["周一", "周二", "周三", "周四", "周五", "周六", "周日"],
        },
        yAxis: {
          type: "value",
        },
        series: [
          {
            name: "邮件营销",
            type: "line",
            stack: "总量",
            data: [120, 132, 101, 134, 90, 230, 210],
          },
          {
            name: "联盟广告",
            type: "line",
            stack: "总量",
            data: [220, 182, 191, 234, 290, 330, 310],
          },
          {
            name: "视频广告",
            type: "line",
            stack: "总量",
            data: [150, 232, 201, 154, 190, 330, 410],
          },
          {
            name: "直接访问",
            type: "line",
            stack: "总量",
            data: [320, 332, 301, 334, 390, 330, 320],
          },
          {
            name: "搜索引擎",
            type: "line",
            stack: "总量",
            data: [820, 932, 901, 934, 1290, 1330, 1320],
          },
        ],
      };
      let option3 = {
        legend: {},
        tooltip: {},
        dataset: {
        dimensions: ["product", "2015", "2016", "2017"],
          source: [
            { product: "Matcha Latte", 2015: 43.3, 2016: 85.8, 2017: 93.7 },
            { product: "Milk Tea", 2015: 83.1, 2016: 73.4, 2017: 55.1 },
            { product: "Cheese Cocoa", 2015: 86.4, 2016: 65.2, 2017: 82.5 },
            { product: "Walnut Brownie", 2015: 72.4, 2016: 53.9, 2017: 39.1 },
          ],
        },
        xAxis: { type: "category" },
        yAxis: {},
        series: [{ type: "bar" }, { type: "bar" }, { type: "bar" }],
      };
      // 4.传入数据
      this.chart.setOption(option);
      this.chart_1.setOption(option1);
      this.chart_2.setOption(option2);
      this.chart_3.setOption(option3);
    },
  },
};
</script>
demo效果
自定义配置
我们可以根据Echarts的配置项来自定义实现,UI设计稿 --> 配置项
可以根据下面的概念图对一些基础的配置有了解(更多的配置请查询官网)


 2090
2090


 到【灌水乐园】发言


