


exportgraphics (After Matlab 2022)
x = -10:0.5:10;
y = x.^2;
p = plot(x,y,"-o","MarkerFaceColor","red");
for i=1:41
    p.MarkerIndices = i;
    exportgraphics(gca,"parabola.gif","Append",true)
end
3D example:
z = peaks(25);
figure
mesh(z)
axis manual %fix axis limit

exportgraphics(gca,"matlab1.gif") %prevent appending to previous gif

[a,e] =view
for d = 10:10:360
    view(a+d,e)
    exportgraphics(gca,"matlab1.gif","Append",true)
end
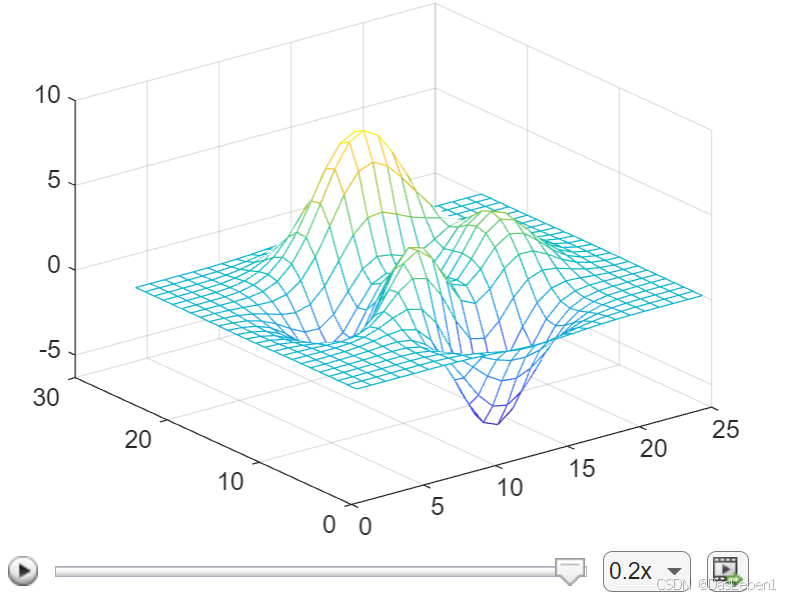
After running the above code, a gui will show up in t
 最低0.47元/天 解锁文章


 被折叠的 条评论
为什么被折叠?
被折叠的 条评论
为什么被折叠?
 到【灌水乐园】发言


