


 这篇博客展示了如何使用JavaScript库AmCharts.js实现一个交互式的饼图,通过varchartData数据展示了不同城市的数据分布,并详细介绍了如何配置图表标题、字段和样式。
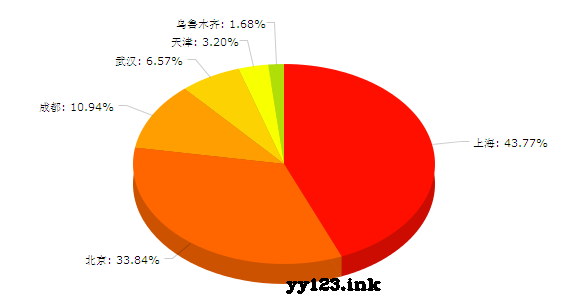
引用jsamcharts.js调用var chart;var legend;var chartData = [{ country: "上海", value: 260},{ country: "北京", value: 201},{ country: "成都", value: 65},{ country: "武汉", value: 39},{ country: "天津", value: 19},{ country: "乌鲁木齐", value: 10}];AmCharts.ready(function() { // 饼图 chart = new AmCharts.AmPieChart(); chart.dataProvider = chartData; chart.titleField = "country"; chart.valueField = "value"; chart.outlineColor = ""; chart.outlineAlpha = 0.8; chart.outlineThickness = 2; // 3D chart.depth3D = 20; chart.angle = 30; // 图形写入 chart.write("chartdiv");});
dd:


 6966
6966

 被折叠的 条评论
为什么被折叠?
被折叠的 条评论
为什么被折叠?
 到【灌水乐园】发言


