


 博客提及机器学习相关内容,给出了图与网络结构可视化示例代码,运行后可参考更多细节,参考网址为http://matplotlib.org/examples/index.html 。
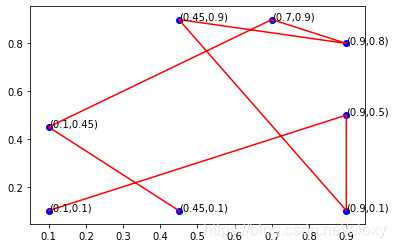
机器学习一书,-第一章-图与网络结构可视化示例代码:
# -*- coding: utf-8 -*-
#程序来自《机器学习》1.4.4 图与网络结构的可视化
from numpy import *
import matplotlib.pyplot as plt

dist = mat([[0.1,0.1],[0.9,0.5],[0.9,0.1],[0.45,0.9],[0.9,0.8],[0.7,0.9],[0.1,0.45],[0.45,0.1]])
m,n = shape(dist)

fig = plt.figure()
ax = fig.add_subplot(111)
ax.scatter(dist.T[0].tolist(),dist.T[1].tolist(),c='blue',marker='o')
for point in dist.tolist():
    plt.annotate("("+str(point[0])+","+str(point[1])+")",xy = (point[0],point[1]))
xlist =[];ylist=[]
for px,py in zip(dist.T.tolist()[0],dist.T.tolist()[1]):
    xlist.append([px])
    ylist.append([py])
ax.plot(xlist ,ylist ,'r')
plt.show()
运行后:
更多细节请参考http://matplotlib.org/examples/index.html


 2万+
2万+

 被折叠的 条评论
为什么被折叠?
被折叠的 条评论
为什么被折叠?
 到【灌水乐园】发言


