


最终效果图

这里只展示地图代码
1.安装echarts相关扩展
npm install echarts@5.4.3 echarts-gl
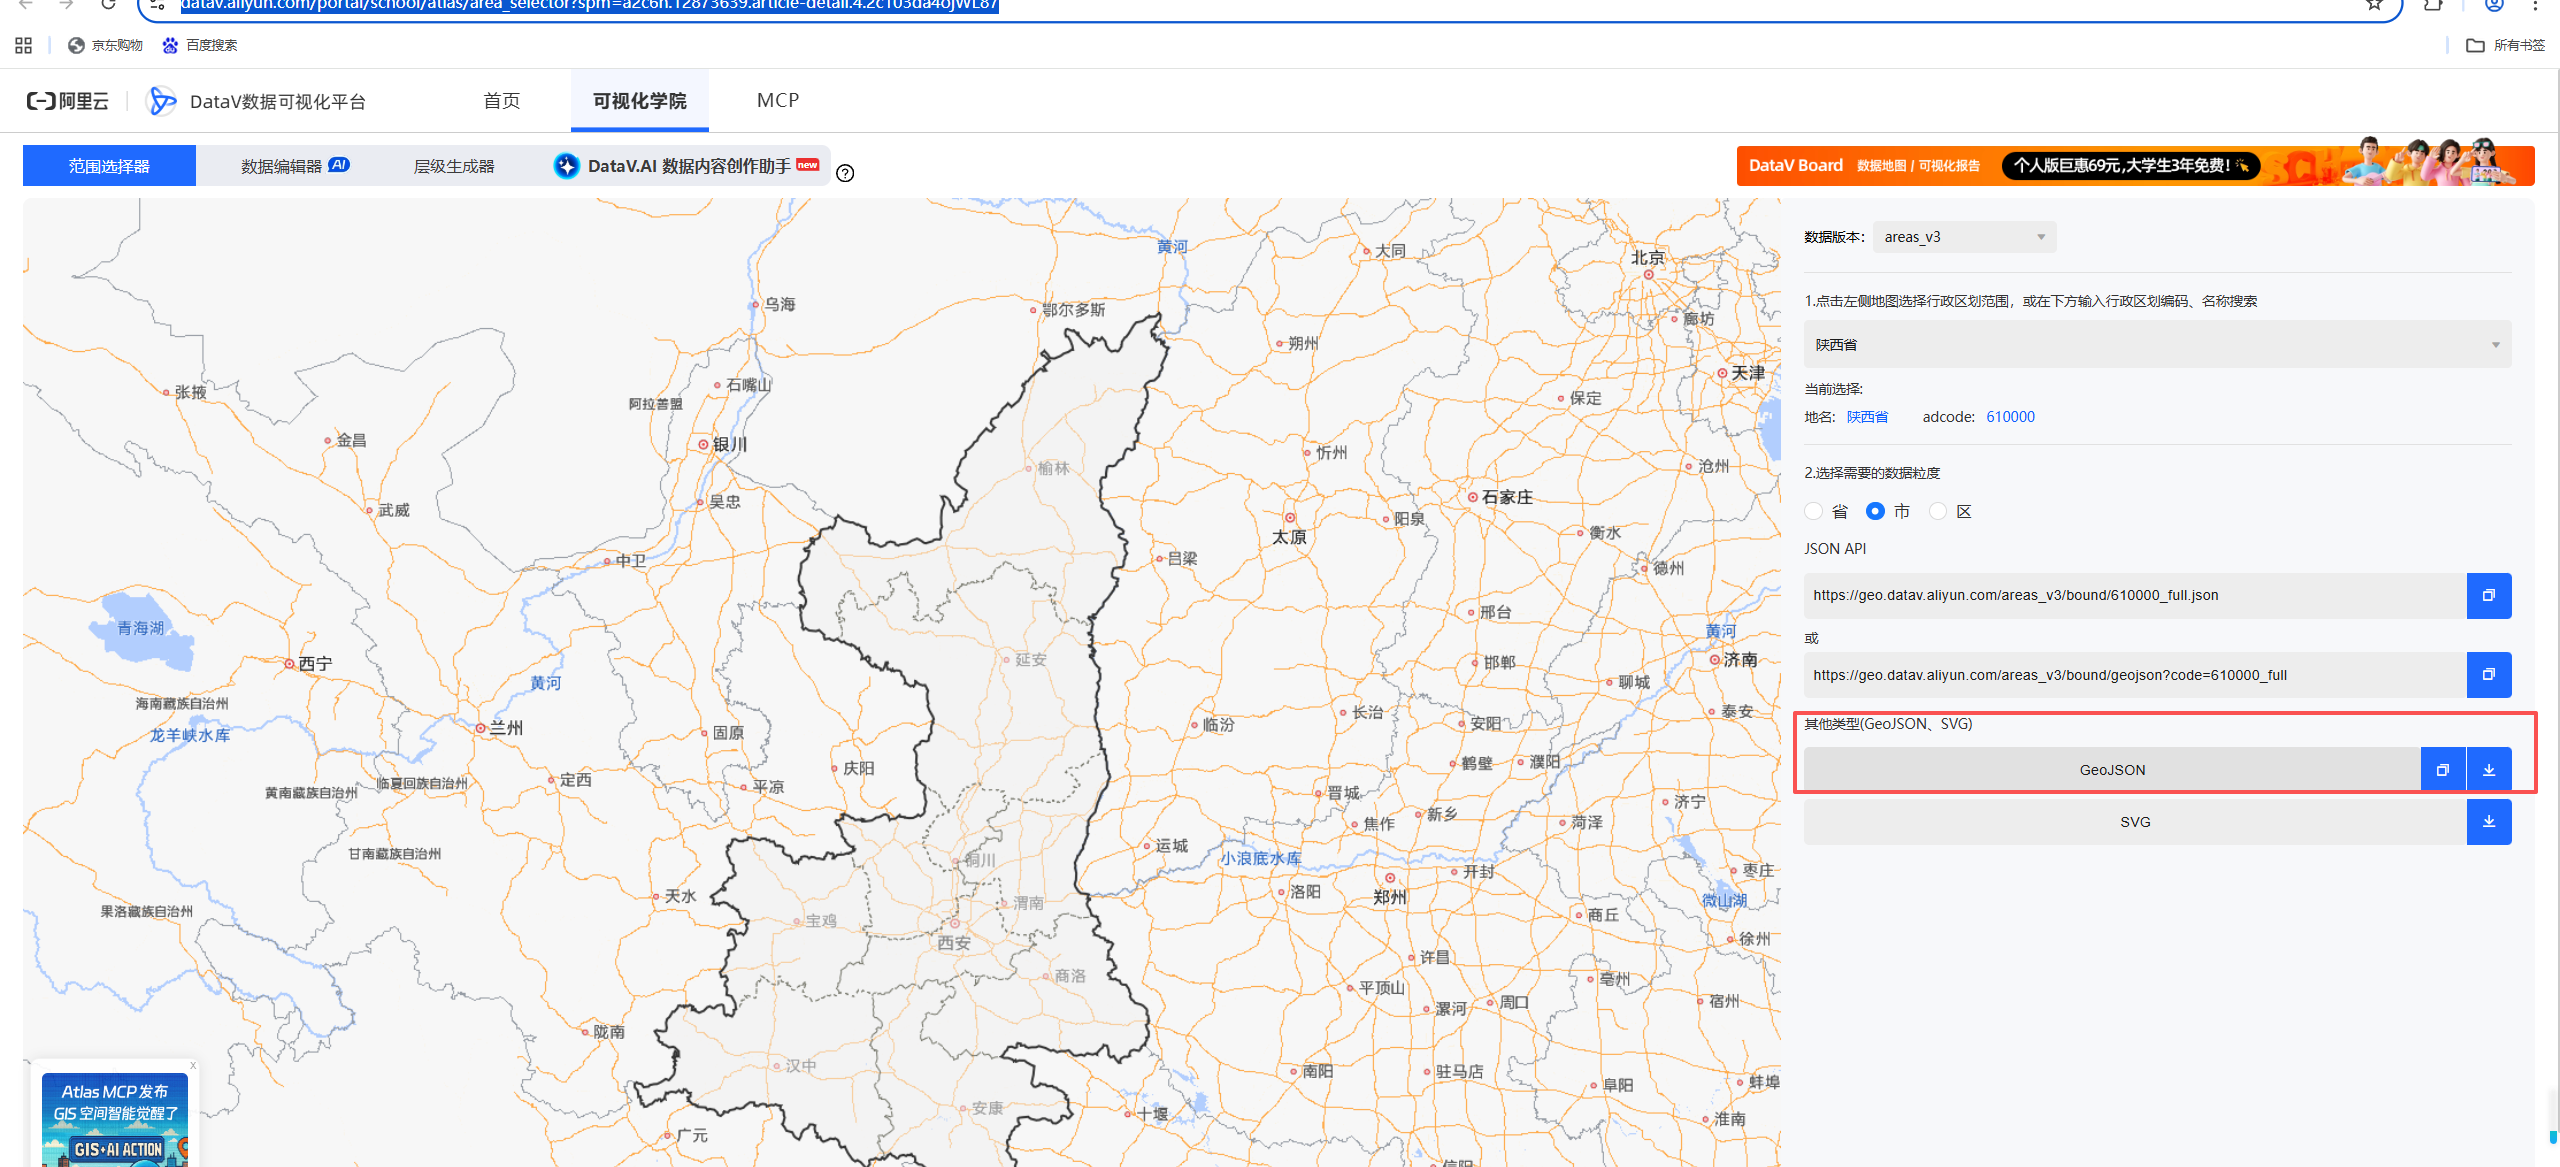
2.前往阿里云数据可视化平台下载地图相关json数据
https://datav.aliyun.com/portal/school/atlas/area_selector?spm=a2c6h.12873639.article-detail.4.2c103da4ojWL87
3.创建echartsUtils.ts(本项目用的是按需引入,存在多余组件)
import * as echarts from 'echarts/core';
import {
  CustomChart,
  FunnelChart,
  FunnelSeriesOption,
  BarChart,
  LineChart,
  GaugeChart,
  MapChart,
  PieChart,
  PieSeriesOption
} from 'echarts/charts';

import { Map3DChart, Bar3DChart, Scatter3DChart } from 'echarts-gl/charts';
// import { ShadowEffect, LightEffect } from 'echarts-gl/effects';

import {
  TitleComponent,
  TooltipComponent,
  GridComponent,
  // 数据集组件
  DatasetComponent,
  // 内置数据转换器组件 (filter, sort)
  TransformComponent,
  PolarComponent,

  LegendComponent,
  ToolboxComponent,
  GraphicComponent,
  DataZoomSliderComponent,
  DataZoomComponent,
  VisualMapComponent,
  GeoComponent,

} from 'echarts/components';

import { LabelLayout, UniversalTransition } from 'echarts/features';

import { CanvasRenderer } from 'echarts/renderers';


import type {
  // 系列类型的定义后缀都为 SeriesOption
  BarSeriesOption,
  LineSeriesOption
} from 'echarts/charts';

import type {
  // 组件类型的定义后缀都为 ComponentOption
  TitleComponentOption,
  TooltipComponentOption,
  GridComponentOption,
  DatasetComponentOption,
  PolarComponentOption,
  LegendComponentOption,
  ToolboxComponentOption,
} from 'echarts/components';

import type {
  ComposeOption,
} from 'echarts/core';

// 通过 ComposeOption 来组合出一个只有必须组件和图表的 Option 类型
type ECOption = ComposeOption<
  | BarSeriesOption
  | LineSeriesOption
  | TitleComponentOption
  | TooltipComponentOption
  | GridComponentOption
  | DatasetComponentOption
  | PolarComponentOption
  | LegendComponentOption
  | ToolboxComponentOption
  | PieSeriesOption
>;

// 注册必须的组件
echarts.use([
  TitleComponent,
  TooltipComponent,
  GridComponent,
  DatasetComponent,
  TransformComponent,
  BarChart,
  LineChart,
  LabelLayout,
  UniversalTransition,
  CanvasRenderer,
  GaugeChart,
  PolarComponent,
  LegendComponent,
  ToolboxComponent,
  FunnelChart,
  CustomChart,
  GraphicComponent,
  DataZoomSliderComponent,
  DataZoomComponent,
  VisualMapComponent,
  Map3DChart,
  MapChart,
  GeoComponent,
  Bar3DChart,
  Scatter3DChart,
  PieChart,
]);

export default echarts;
4.组件代码中使用
<template>
    <div style="width: 100%; height: 100%; overflow: hidden; background: #f2f2f2; position:relative;">
        <div class="chart" ref="chart"></div>
    </div>

    <div class="controls">
        <button class="btn" @click="showLabel" >点击显示与隐藏图中label</button>
    </div>
</template>
<script lang="ts" setup>
import { ref, computed, watch, onMounted, defineEmits, defineProps  } from 'vue'
import echarts from '@/utils/echartsUtils'
import shaanxiGeoJSON from '@/assets/jsondata/shannxi.json'

const chart = ref<HTMLElement | null>(null);
let chartInstance: echarts.ECharts | null = null;
let isRotating = false;
const showMapLabel = ref(false);
// 地图上显示的数据
const populationData = ref([
    { name: '西安市', value: 5123345, coord: [108.942210, 34.261532] },
    { name: '宝鸡市', value: 2223476, coord: [107.237539, 34.361915] },
    { name: '咸阳市', value: 423435, coord: [108.308837, 34.799870] },
    { name: '铜川市', value: 43400, coord: [108.945603, 35.206756] },
    { name: '渭南市', value: 5233427, coord: [109.803932, 34.999995] },
    { name: '延安市', value: 233326, coord: [109.489727, 36.650077] },
    { name: '榆林市', value: 3833245, coord: [109.734546, 38.299185] },
    { name: '汉中市', value: 383320, coord: [107.023323, 33.067480] },
    { name: '安康市', value: 123456, coord: [109.029022, 32.684714] },
    { name: '商洛市', value: 221337, coord: [109.940477, 33.870422] }
]);

const showLabel = () => {
    showMapLabel.value = !showMapLabel.value;
    iniEcharts();
}

const iniEcharts = () => {
    if (!chart.value) return;
    // 先销毁示例
    if (chartInstance) {
        chartInstance.dispose();
        chartInstance = null;
    }
    chartInstance = echarts.init(chart.value);
    // 注册地图
    echarts.registerMap('Shaanxi', shaanxiGeoJSON as any);
    const option = {
        tooltip: {
            trigger: 'item',
            formatter: function(params : any) {
                return `${params.name}<br/>: ${params.value || 0}人`;
            }
        },
        // 统计颜色
        visualMap: {
            show: false,
            min: 0,
            max: 1300,
            inRange: {
                color: ['#46c3db', '#ffa85c', '#ff6b6b']
            },
            textStyle: {
                color: '#fff'
            }
        },
        // 全局光照和环境设置
        globe: {
            baseTexture: null, // 不使用基础纹理
            environment: '#000', // 深色背景增强发光效果
            shading: 'realistic',

            light: {
                ambient: {
                    intensity: 0.8
                },
                main: {
                    intensity: 1.5,
                    shadow: true
                }
            }
        },
        geo3D: {
            map: 'Shaanxi',
            shading: 'realistic',
            itemStyle: { // 三维地理坐标系组件 中三维图形的视觉属性,包括颜色,透明度,描边等。
                color: '#1E5F90', // 地图板块的颜色 rgba(46,110,149, .7)
                opacity: .5, // 图形的不透明度 [ default: 1 ]
                borderWidth: 1, // (地图板块间的分隔线)图形描边的宽度。加上描边后可以更清晰的区分每个区域 [ default: 0 ]
                borderColor: '#79A9C8' // 图形描边的颜色。[ default: #333 ]
            },
            emphasis: {
                itemStyle: {
                    color: '#61a5e2' // 鼠标移动到的地图块颜色
                }
            },
            viewControl: {
                autoRotate: isRotating,
                distance: 215, // 视角距离,数值大拉远,反之近
                alpha: 40, // 数值小后仰,反之前仰
                beta: 8, // 数字小角度偏右,数字大角度偏左
            },
            light: {
                main: {
                    intensity: 1, // 光照强度
                    shadowQuality: 'high', // 阴影质量,取值为 'low', 'medium', 'high'
                    alpha: 25, // 光照的不透明度
                    beta: 10, // 光照的角度
                    shadow: true // 是否显示阴影
                },
                ambient: {
                    intensity: 0.3 // 环境光照强度
                }
            },
            regionHeight: 6 // 地图块高度
        },
        series: [
            {
                name: '3d地图',
                type: "bar3D",
                coordinateSystem: 'geo3D',
                barSize: 0,
                bevelSize: 0,
                data: populationData.value.map(item => {
                    return [item.coord[0], item.coord[1], item.value, item.name];
                }),
                label: {
                    show: showMapLabel.value,
                    formatter: function(params:any) {
                        return params.data[3] + ' ' + params.data[2];
                    },
                    position: "top",
                    textStyle: {
                        color: "#ffffff",
                        fontSize: 16,
                        backgroundColor: 'rgba(0,0,0,0.8)',
                        padding: [5, 5, 5, 5],
                        borderRadius: 5,
                        borderWidth: 1,
                        // borderColor: "#F40000"
                    }
                },


            },
        ]
    };
    chartInstance.setOption(option);
    // 响应窗口大小变化
    window.addEventListener('resize', () => {
        if (chartInstance) {
            chartInstance.resize();
        }
    });
}
// 旋转地图
const rotateMap = () => {
    isRotating = !isRotating;
    if (chartInstance) {
        const option = chartInstance.getOption() as any;
        option.geo3D[0].viewControl.autoRotate = isRotating;
        chartInstance.setOption(option);
    }
};
onMounted(() => {
    setTimeout(() => {
        iniEcharts();
    }, 600);
})
</script>
<style scoped>
.chart {
    width: 100%;
    height: 700px;
    margin-bottom: 20px;
    top: -130px;
    /**定义地图背景图片*/
    background-image:
        linear-gradient(rgba(0,0,0,0.5), rgba(0,0,0,0.5)),
        url('@/assets/3dmap.jpg');
    background-size: cover;
    background-position: center;
}
</style>
解决3d地图click、mouseover等事件失效问题
不使用geo3D,将样式等配置全部写入series,会存在部分属性失效问题
const iniEcharts = () => {
    if (!chart3d.value) return;
    // 先销毁示例
    if (chartInstance) {
        chartInstance.dispose();
        chartInstance = null;
    }
    chartInstance = echarts.init(chart3d.value);
    // 注册地图
    echarts.registerMap('Shaanxi', shaanxiGeoJSON as any);
    const option = {
        tooltip: {
            trigger: 'item',
            formatter: function(params : any) {
                return `${params.name}<br/>: ${params.value || 0}人`;
            }
        },
        // 统计颜色
        visualMap: {
            show: false,
            min: 0,
            max: 1300,
            inRange: {
                color: ['rgba(30,95,144, .5)', 'rgba(30,95,144, .5)', 'rgba(30,95,144, .5)']
            },
            // textStyle: {
            //     color: '#fff'
            // }
        },
        // 禁用 geo3D,使用 map3D 系列替代
        // geo3D: {
        //     show: false // 完全禁用 geo3D
        // },
        series: [
            {
                name: '3d地图',
                type: "map3D",
                map: 'Shaanxi', // 使用注册的地图名称

                // 从 geo3D 迁移的样式配置
                shading: 'realistic',
                silent: false,
                roam: true,

                itemStyle: {
                    // areaColor: '#000000',
                    opacity: 1,
                    borderWidth: 1,
                    borderColor: '#79A9C8'
                },
                emphasis: {
                    itemStyle: {
                        color: '#61a5e2'
                    }
                },
                viewControl: {
                    autoRotate: isRotating,
                    distance: 215,
                    alpha: 40,
                    beta: 8,
                },
                light: {
                    main: {
                        intensity: 1,
                        shadowQuality: 'high',
                        alpha: 25,
                        beta: 10,
                        shadow: true
                    },
                    ambient: {
                        intensity: 0.3
                    }
                },
                regionHeight: 6,

                // 数据配置 - 使用对象格式
                data: populationData.value.map(item => ({
                    name: item.name,
                    value: item.value, // 直接使用数值,不是数组
                    // 如果需要3D高度效果,可以使用 regionHeight 或单独设置
                    coord: item.coord,
                    data1: item.data1
                })),
                label: {
                    show: showMapLabel.value,
                    formatter: function(params: any) {
                        return `${params.name} ${params.data.data1 || ''}`;
                    },
                    position: "top",
                    textStyle: {
                        color: "#ffffff",
                        fontSize: 16,
                        backgroundColor: 'rgba(10,6,35,.5)',
                        padding: [5, 5, 5, 5],
                        borderRadius: 8,
                        borderWidth: 1,
                    }
                }
            }
            // 移除 bar3D 系列,避免冲突
        ]

    };
    chartInstance.setOption(option);

    chartInstance.on('mouseover', function (params: any) {
			console.log('划入:', params);
    });
    chartInstance.on('globalout', function (params: any) {
        console.log('globalout:', params);
    });


    // 响应窗口大小变化
    window.addEventListener('resize', () => {
        if (chartInstance) {
            chartInstance.resize();
        }
    });
}


 8864
8864

 被折叠的 条评论
为什么被折叠?
被折叠的 条评论
为什么被折叠?
 到【灌水乐园】发言


