


 本文介绍如何使用CocosCreator实现贝塞尔雷达图,包括组件配置、代码解析及动态展示效果。通过调整参数,可以定制不同的显示风格。
CocosCreator 创建贝塞尔雷达图
前言
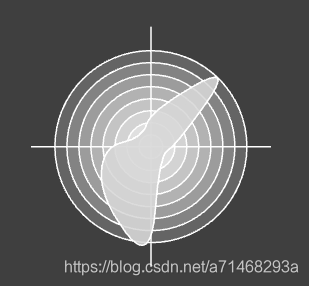
需求要求实时显示脑波变化数据,并且以一种高科技效果展示,甲方觉得普通折线雷达图不够好看,于是改为贝塞尔雷达图。
制作效果
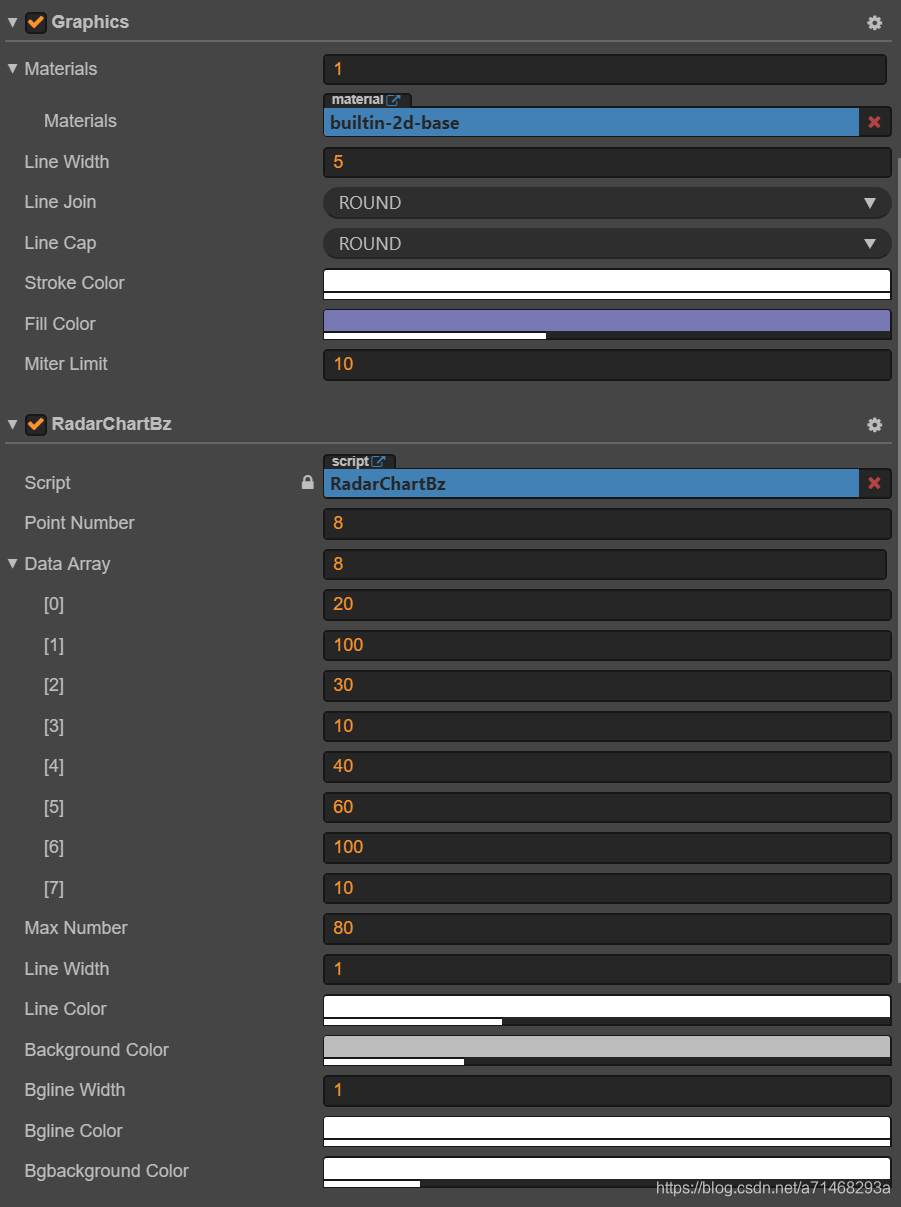
Component设置
源码
直接与Graphics组件挂载在一个空物体上即可。
Tips:代码region 手柄线条注释是用来显示贝塞尔曲线手柄的。
const {
    ccclass,
    property
} = cc._decorator;

@ccclass
export default class RadarChartBz extends cc.Component {

    @property({
        type: Number,
        tooltip: "数据个数"
    })
    pointNumber: number = 8;

    //数据数组
    @property({
        type: [Number],
        tooltip: "数据数组"
    })
    dataArray: number[] = [];


    @property({
        type: Number,
        tooltip: "最大边界"
    })
    maxNumber: number = 100;

    //#region 贝塞尔雷达图
    @property({
        type: Number,
        tooltip: "线宽度"
    })
    lineWidth: number = 1;
    @property({
        type: cc.Color,
        tooltip: "线颜色"
    })
    lineColor: cc.Color ;
    @property({
        type: cc.Color,
        tooltip: "内部颜色"
    })
    backgroundColor: cc.Color;
//#endregion

    //#region 底板
    @property({
        type: Number,
        tooltip: "线宽度"
    })
    bglineWidth: number = 1;
    @property({
        type: cc.Color,
        tooltip: "线颜色"
    })
    bglineColor: cc.Color;
    @property({
        type: cc.Color,
        tooltip: "内部颜色"
    })
    bgbackgroundColor: cc.Color;
//#endregion


    /**
     * 渲染组件
     *
     * @type {cc.Graphics}
     * @memberof doodlets
     */
    graphics: cc.Graphics = null;
    /**
     * 点数组
     *
     * @memberof doodlets
     */
    nodes = [];

    onLoad() {
        //拿到组件
        this.graphics = this.node.getComponent(cc.Graphics);
    }

    start() {
        //更新颜色周期
        //this.updateColorCycle();
        //创建贝塞尔点
        this.createBezierNodes();
    }


    update(dt) {
        this.updateNode();
        this.render();
    }

    //创建贝塞尔点
    /**
     *
     *
     * @memberof doodlets
     */
    createBezierNodes() {
        //创建8个顶点
        for (var quantity = 0, len = this.pointNumber; quantity < len; quantity++) {
            var theta = Math.PI * 2 * quantity / len;
            var x = 0;
            var y = 0;
            this.nodes.push({
                x: x,
                y: y,
                //在圆上随机
                angle: theta,
                //angle: Math.random() * Math.PI * 2,
                //弧度
                theta: theta
            });
        }
    }

    updateNode() {
        //装了8个点
        let nodes = this.nodes;

        for (let index = 0; index < nodes.length; index++) {
            let node = nodes[index];
            node.x = this.dataArray[index] * Math.cos(node.theta)/100*this.maxNumber;
            node.y = this.dataArray[index] * Math.sin(node.theta)/100*this.maxNumber;
        }
    }
    /**
     * 更新颜色周期
     *
     * @memberof doodlets
     */
    updateColorCycle() {
        // let color = this.lineColor;
        // color.r=150;
        // color.g=150;
        // color.b=150;
        // color.a = 255;
    }
    render() {
        this.graphics.clear();
        this.BackgroundRender();
        this.RadarRender();
    }
    RadarRender() {
        let nodes = this.nodes;
        let graphics = this.graphics;
        var currentIndex, nextIndex, xc, yc;

        graphics.strokeColor =  this.lineColor;
        graphics.strokeColor.setA(this.lineColor.a);
        graphics.fillColor = this.backgroundColor;
        graphics.fillColor.setA(this.backgroundColor.a);
        graphics.lineWidth = this.lineWidth;

        //下面有多少个点遍历多少次
        [].forEach.call(nodes, (node, index) => {

            //当前node
            currentIndex = nodes[nodes.length - 1];
            //第0个node
            nextIndex = nodes[0];

            xc = currentIndex.x + (nextIndex.x - currentIndex.x) * 0.5;
            yc = currentIndex.y + (nextIndex.y - currentIndex.y) * 0.5;

            graphics.moveTo(xc, yc);

            // Draw through N points
            for (var N = 0; N < nodes.length; N++) {

                currentIndex = nodes[N];
                nextIndex = N + 1 > nodes.length - 1 ? nodes[N - nodes.length + 1] : nodes[N + 1];

                xc = currentIndex.x + (nextIndex.x - currentIndex.x) * 0.5;
                yc = currentIndex.y + (nextIndex.y - currentIndex.y) * 0.5;

                graphics.quadraticCurveTo(currentIndex.x, currentIndex.y, xc, yc);
            }

            graphics.fill();
            graphics.stroke();

            //#region 手柄线条
            // graphics.lineWidth = 1;
            // graphics.lineCap = cc.Graphics.LineCap.ROUND;
            // graphics.lineJoin = cc.Graphics.LineJoin.ROUND;
            // graphics.strokeColor.fromHEX('#a9a9a9');
            // graphics.fillColor.fromHEX('#a9a9a9');
            // Draw through N points
            // for(var N = 0; N < nodes.length; N++) {

            //     // First anchor
            //     currentIndex = nodes[N];
            //     nextIndex = N + 1 > nodes.length - 1 ? nodes[N - nodes.length + 1] : nodes[N + 1];

            //     xc = currentIndex.x + (nextIndex.x - currentIndex.x) * 0.8;
            //     yc = currentIndex.y + (nextIndex.y - currentIndex.y) * 0.8;

            //     graphics.moveTo(xc, yc);

            //     // Second anchor
            //     currentIndex = nextIndex;
            //     nextIndex = N + 2 > nodes.length - 1 ? nodes[N - nodes.length + 2] : nodes[N + 2];

            //     xc = currentIndex.x + (nextIndex.x - currentIndex.x) * 0.2;
            //     yc = currentIndex.y + (nextIndex.y - currentIndex.y) * 0.2;

            //     graphics.lineTo(xc, yc);
            //     graphics.stroke();

            //     // First anchor
            //     currentIndex = nodes[N];
            //     nextIndex = N + 1 > nodes.length - 1 ? nodes[N - nodes.length + 1] : nodes[N + 1];

            //     xc = currentIndex.x + (nextIndex.x - currentIndex.x) * 0.8;
            //     yc = currentIndex.y + (nextIndex.y - currentIndex.y) * 0.8;

            //     graphics.circle(xc, yc, 2);
            //     graphics.fill();

            //     // Second anchor
            //     currentIndex = nextIndex;
            //     nextIndex = N + 2 > nodes.length - 1 ? nodes[N - nodes.length + 2] : nodes[N + 2];

            //     xc = currentIndex.x + (nextIndex.x - currentIndex.x) * 0.2;
            //     yc = currentIndex.y + (nextIndex.y - currentIndex.y) * 0.2;

            //     graphics.circle(xc, yc, 2);
            //     graphics.fill();

            // }
            //#endregion
        });
    }

    BackgroundRender(){
        let graphics = this.graphics;

        graphics.strokeColor = this.bglineColor;
        graphics.strokeColor.setA(this.bglineColor.a);
        graphics.fillColor = this.bgbackgroundColor;
        graphics.fillColor.setA(this.bgbackgroundColor.a) ;
        graphics.lineWidth = this.bglineWidth;

        //竖线
        graphics.moveTo(0, this.maxNumber);
        graphics.lineTo(0,-this.maxNumber);

        //横线
        graphics.moveTo(this.maxNumber, 0);
        graphics.lineTo(-this.maxNumber,0);

        //中间圆圈
        graphics.circle(0,0,this.maxNumber*0.8);
        graphics.circle(0,0,this.maxNumber*0.7);
        graphics.circle(0,0,this.maxNumber*0.6);
        graphics.circle(0,0,this.maxNumber*0.5);
        graphics.circle(0,0,this.maxNumber*0.4);
        graphics.circle(0,0,this.maxNumber*0.3);
        graphics.circle(0,0,this.maxNumber*0.2);
        graphics.circle(0,0,this.maxNumber*0.1);

        graphics.fill();
        graphics.stroke();
    }
}


 1392
1392

 被折叠的 条评论
为什么被折叠?
被折叠的 条评论
为什么被折叠?
 到【灌水乐园】发言


