C++ debugger package is missing or incompatible - do you want to fix it?

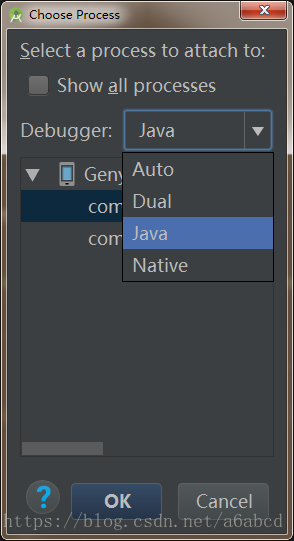
博客提及完成某些步骤后,需要进行切换操作,但未明确具体步骤和切换内容。
### Troubleshooting JTAG Chain Issues Using JTAG Chain Debugger When encountering an **"Unable to scan JTAG chain"** error during hardware debugging, it is crucial to systematically diagnose and resolve the issue using tools like the **JTAG Chain Debugger**. The process involves both hardware and software checks to ensure that the JTAG interface is functioning correctly. One of the primary methods for diagnosing a broken JTAG scan path is by using the `dbgjtag` utility with the `-S brokenpath` option. This command instructs the program to perform a detailed check of the JTAG scan chain for any breaks or inconsistencies. For instance, the following command can be executed in the command line interface: ```bash C:\CCStudio_v3.3\cc\bin>dbgjtag -f brddat\ccbrd0.dat -rv -S brokenpath ``` This command runs the debugger in verbose mode (`-rv`) and checks for any issues in the JTAG chain path[^1]. ### Common Causes of JTAG Chain Errors 1. **Hardware Connectivity Issues**: Loose or damaged cables, faulty connectors, or improper connections between the debugger and the target board can prevent successful communication with the JTAG chain. Ensure all physical connections are secure and inspect cables for damage. 2. **Power Supply Problems**: The target board must be powered correctly. If the board is not receiving adequate power, the JTAG chain may fail to initialize properly. Verify that the power supply is stable and within the required voltage range. 3. **Incorrect Board Configuration**: The board data file (e.g., `ccbrd0.dat`) used with the `dbgjtag` utility must match the specific hardware setup. Using an incorrect or outdated configuration file can lead to misidentification of devices in the JTAG chain[^1]. 4. **Driver and Software Issues**: If the system fails to detect the JTAG interface, it could be due to missing or outdated drivers. For example, the error message "could not find ARM" typically indicates a problem with the JTAG connection, which may be resolved by reinstalling or updating the JTAG drivers. Vivado and other development environments often include automatic driver installation, but manual installation may sometimes be necessary[^2]. 5. **Device-Specific Problems**: Sometimes, the issue lies within the FPGA or microcontroller itself. If the JTAG TAP (Test Access Port) controller is not responding, it could indicate a hardware fault or incorrect configuration of the device’s JTAG pins. Use boundary scan tools to verify the integrity of the JTAG chain and the individual devices connected to it. ### Using JTAG Chain Debugger Tools Tools like the **JTAG Chain Debugger** provide a structured approach to identifying where the chain is failing. These tools typically perform the following actions: - **Enumerate the JTAG Chain**: The debugger attempts to read the IDCODE of each device in the JTAG chain. If a device is not responding, it indicates a potential break in the chain at that point. - **Check for Signal Integrity**: High-speed JTAG interfaces are sensitive to signal integrity issues such as noise, crosstalk, or improper termination. Oscilloscope measurements or logic analyzers can help assess the quality of the TCK, TMS, TDI, and TDO signals. - **Verify Clock Frequency**: The JTAG clock frequency must be within the operational limits of all devices in the chain. Excessive clock speeds can cause timing violations and result in scan chain failures. ### Summary of Actions To troubleshoot the "Unable to scan JTAG chain" error, follow these steps: 1. Check all physical connections and ensure the JTAG cable is securely connected to both the host and the target board. 2. Confirm that the target board is receiving the correct power supply. 3. Use the `dbgjtag -S brokenpath` command to detect any breaks in the JTAG chain[^1]. 4. Ensure that the correct board configuration file is being used. 5. Reinstall or update the JTAG drivers if the system fails to recognize the debugger or the connected device[^2]. 6. Use boundary scan tools to test individual devices in the chain and verify their JTAG functionality. By following these steps and utilizing the capabilities of the JTAG Chain Debugger, it is possible to identify and resolve most JTAG chain issues encountered during hardware debugging.
评论
添加红包

请填写红包祝福语或标题

红包个数最小为10个

红包金额最低5元

当前余额3.43前往充值 >
需支付:10.00
成就一亿技术人!
领取后你会自动成为博主和红包主的粉丝 规则
hope_wisdom
发出的红包
实付
使用余额支付
点击重新获取
扫码支付
钱包余额 0

抵扣说明:

1.余额是钱包充值的虚拟货币,按照1:1的比例进行支付金额的抵扣。
2.余额无法直接购买下载,可以购买VIP、付费专栏及课程。

余额充值