


YOLO3D: End-to-end real-time 3D Oriented Object Bounding Box Detection from LiDAR Point Cloud
论文地址传送门
这篇论文将Yolo应用到 3D 物体检测,在KITTI 数据集下利用Titan X GPU达到了40Fp的性能。
本文的主要贡献有以下几点:
1- Extending YOLO V2[3] to include orientation of the OBB as a direct regression task.
2- Extending YOLO V2[3] to include the height and 3D OBB center coordinates (x,y,z) as a direct regression task.
3- Real-time performance evaluation and experimentation with Titan X GPU, on the challenging KITTI benchmark, with recommendations of the best grid-map resolution, and operating IoU threshold that balances speed and accuracy.
Point Cloud Representation
首先将点阵云投射到2D 鸟瞰网格图中,总共创建了两张图,一张图中的每个cell(pixel)的值为相关点的最高值;另一张图的每个cell(pixel)的值为点的密度,每个网格cell中的点越多值越大。密度的计算方式跟MV3D paper一样:
Yaw Angle Regression
预测框的方向角取值范围为-π到π,归一化为-1到1,并利用均方差计算损失函数:
3D Bounding Box Regression
这一部分更Yolo_V2一样,只是扩展到了三维。唯一要注意的是 高度Z的值只映射到一个网格中,而不是像xy一样映射到所有网格,这是由于物体的高度相差不大,可变度非常小。
Anchors Calculation
Yolo_v2中利用K均值聚类得到了很多大小不一的Anchors,基于这样的先验知识能够覆盖到数据可能出现的所有范围的框,这样可以利用不同大小的框检测到不同大小的物体。然后汽车的大小相对来说比较固定,所以本文实现没有利用K均值聚类产生大小不同的先验框,而是计算3D boxs的均值作为先验框的大小。
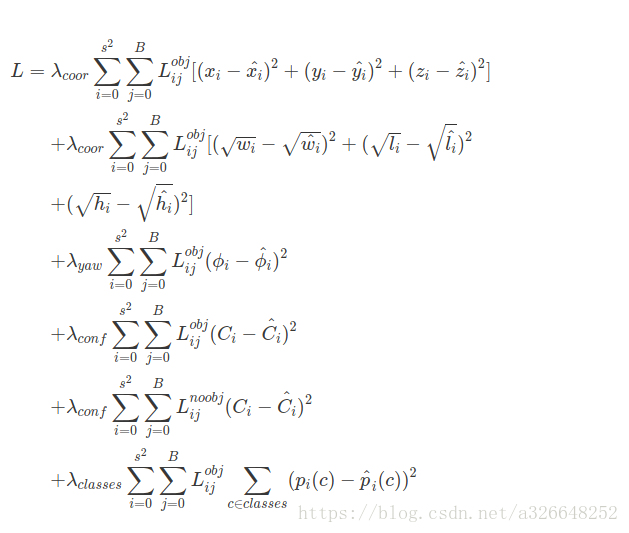
Combined Loss for 3D OBB
总体的Loss加了几个维度,其他处理一样。
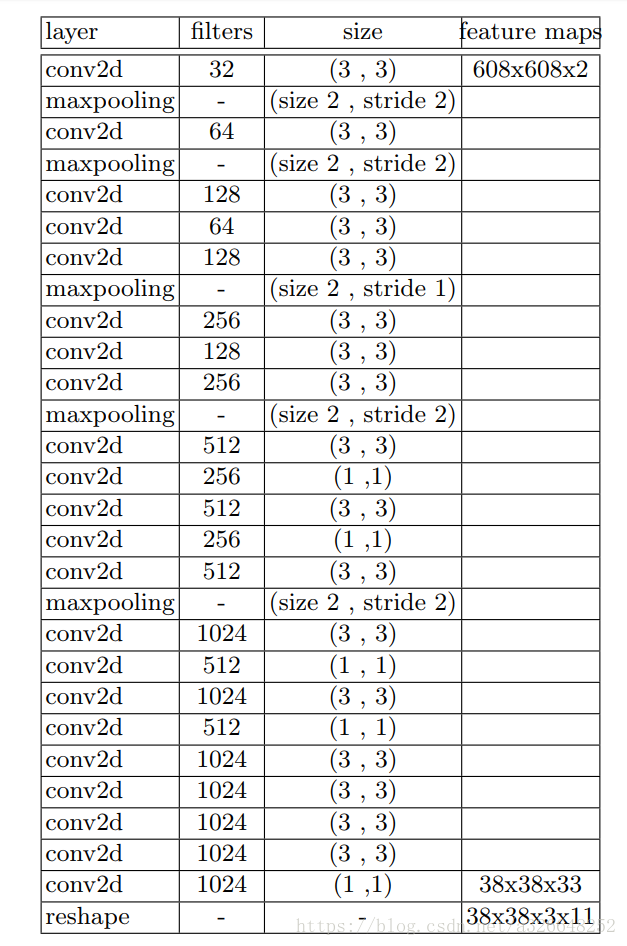
Network Architecture and Hyper Parameters
相比于yolo_v2网络结构的一些改动:
-
We modified one max-pooling layer to change the down-sampling from 32 to 16 so we can have a larger grid at the end; this has a contribution in detecting small objects like pedestrians and cyclists.
-
We removed the skip connection from the model as we found it resulting in less accurate results.
-
We added terms in the loss function for yaw, z center coordinate, and height regressions to facilitate the 3D oriented bounding box detection.
-
Our input consists of 2 channels, one representing the maximum height, and the other one representing the density of points in the point cloud, computed as shown in Eq. (1)
KITTI Results and Error Analysis
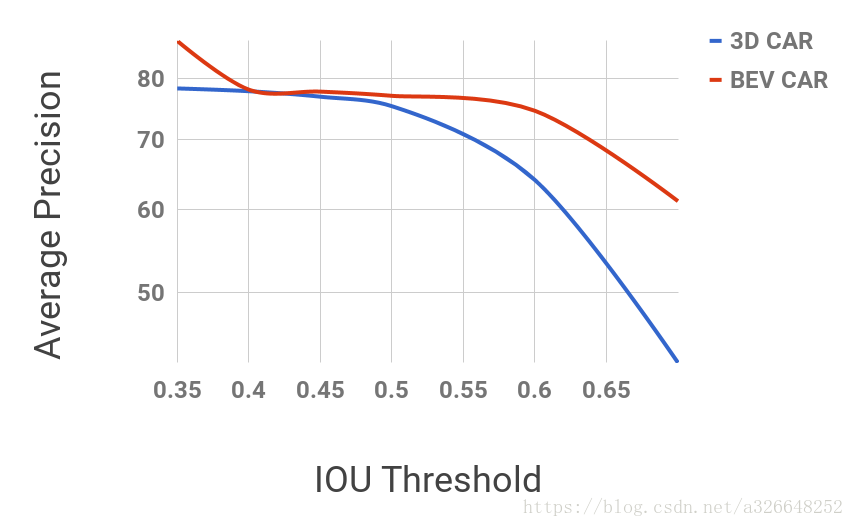
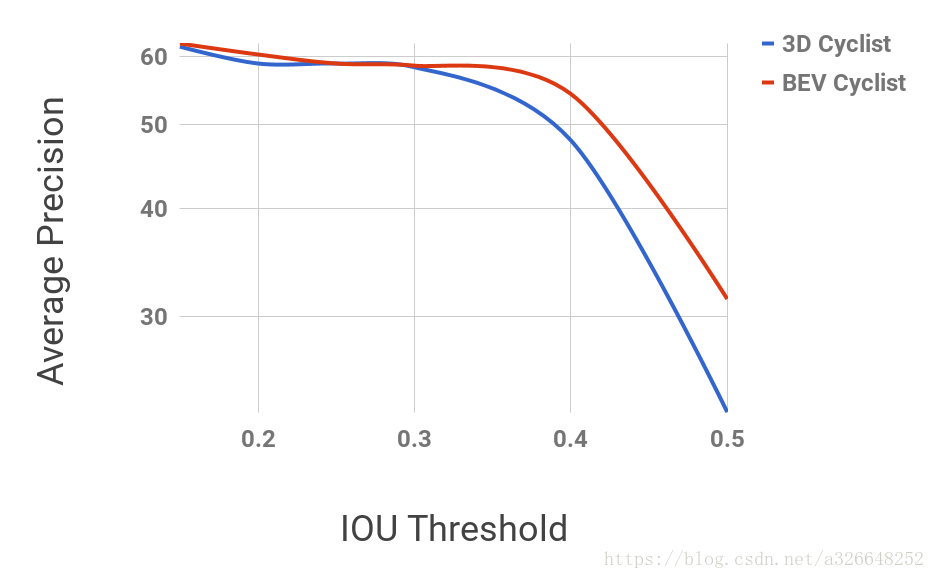
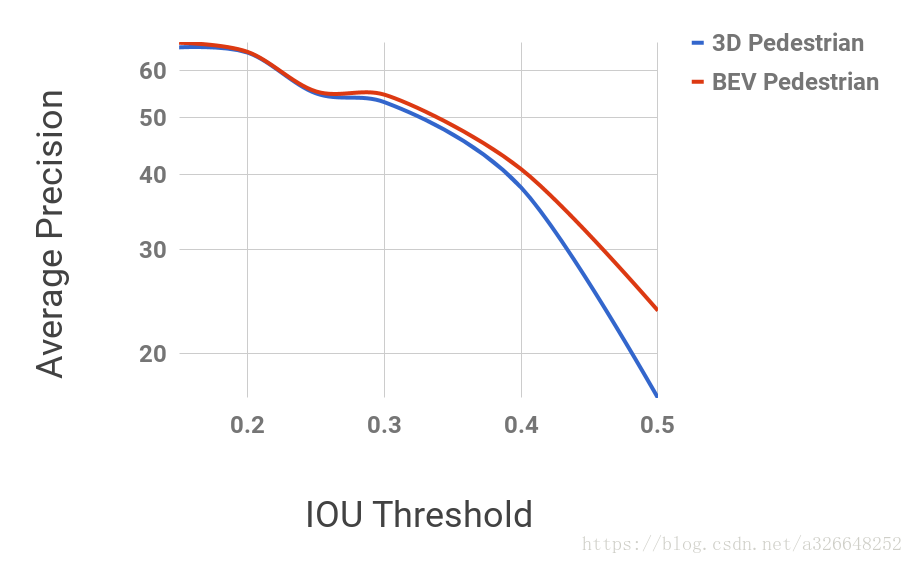
对于Car,当IOU阈值在0.5时表现得很好,当大于0.5之后,随着IOU阈值的增加,性能显着下降,这表明我们很难让盒子与对象完美对齐,这是Yolo模型普遍存在的问题。
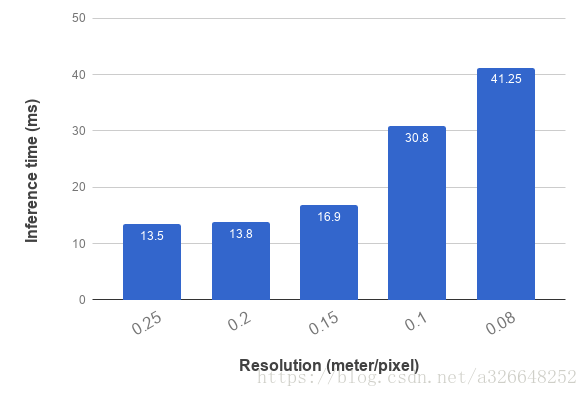
随着图像分辨率的增加,预测推理时间显著增加,如0.15m/piexl增加的0.1/piexl推理时间增加了大约一倍。


 3418
3418

 被折叠的 条评论
为什么被折叠?
被折叠的 条评论
为什么被折叠?
 到【灌水乐园】发言


