


1. 多表联合
在excel中近似匹配
vlookup("要匹配项",匹配项,第几列)
这样是近似查询,如果匹配不到值会自动的匹配相近的值 就像这样 精确匹配
精确匹配
vlookup("要匹配项",匹配项,第几列,false)如果匹配不到就用0 替代
=IFNA(VLOOKUP(Students!A2:A21,Scores!A2:B21,2,FALSE),0)
pandas 代码
如果ID匹配失败 则则直接丢弃
import pandas as pd

students = pd.read_excel("source/15Student_Score.xlsx", sheet_name="Students")
scores = pd.read_excel("source/15Student_Score.xlsx", sheet_name="Scores")

# 联表查询
table = students.merge(scores,on="ID")
print(table)
保存左侧所有字段
table = students.merge(scores, how="left", on="ID")匹配不到的值置为0
# 联表查询
table = students.merge(scores, how="left", on="ID").fillna(0)
table['Score'] = table['Score'].astype(int)
print(table)
如果指定了ID 那么on就非写不可
import pandas as pd

students = pd.read_excel("source/15Student_Score.xlsx", sheet_name="Students",index_col="ID")
scores = pd.read_excel("source/15Student_Score.xlsx", sheet_name="Scores",index_col="ID")

# 联表查询
# table = students.merge(scores, how="left", on="ID").fillna(0)
table = students.merge(scores, how="left",left_on=students.index,right_on=scores.index).fillna(0)
table['Score'] = table['Score'].astype(int)
print(table)
join 模式
# 可以不写 on= "ID"
table = students.join(scores, how="left").fillna(0)
2. 数据校验
excel 中的数据校验
 然后再在excel中输入 不匹配的值就会报错
但是已有的数据还是不知道 那么怎么办
点击数据验证——> 圈出无效数据 即可
python中的excel校验
import pandas as pd


# def score_validation(row):
#     try:
#         assert 0 <= row.Score <= 100
#     except:
#         print(f"#{row.ID}\tstudent{row.Name} has an invalid score{row.Score}")
def score_validation(row):
    if not 0 <= row.Score <= 100:
        print(f"#{row.ID}\tstudent{row.Name} has an invalid score{row.Score}")


students = pd.read_excel("source/16Students.xlsx")

students.apply(score_validation, axis=1)
3. 把列数据拆分成两列
excel中
如何拆分 一列数据 python中
import pandas as pd

employees = pd.read_excel("source/17Employees.xlsx")

# expand=True 分割成两列
df = employees['Full Name'].str.split('', expand=True)

employees['First Name'] = df[0]
employees['Last Name'] = df[1]

print(employees)其他方法Python学习笔记:pandas.Series.str.split分列 - 走看看
4. 求和求平均 统计导引
excel 中
求和: =SUM(C2,D2,E2) 或者 =SUM(C2:E2)
求平均: =SUM(C2,D2,E2)/3 或者 =AVERAGE(C2:E2)

python pandas中
import pandas as pd

students = pd.read_excel("source/19Students.xlsx",index_col="ID")

# 拿到三次成绩的子集
temp = students[['Test_1', 'Test_2', 'Test_3']]

# result = temp.sum()
# print(result) # 拿到的是一列的总和  不是某一行的总和

#  axis = 1 指定横轴
row_sum = temp.sum(axis=1)
row_mean = temp.mean(axis=1)

students['Total'] = row_sum
students['Average'] = row_mean

col_mean = students[['Test_1', 'Test_2', 'Test_3', "Total", "Average"]].mean()
col_mean['Name'] = "Summary"

students = students.append(col_mean, ignore_index=True)

print(students)
5.定位 消除重复数据
excel中:
数据-> 删除重复值
 Python中:
import pandas as pd

students = pd.read_excel("source/19Students_Duplicates.xlsx")
#  删除重复值 keep = "first" 代表保留第一次出现的值 还可以是last 代表保留的是最后一次出现的值
students.drop_duplicates(subset="Name", inplace=True,keep="first")
# students.drop_duplicates(subset=["Name"])
print(students)
在pandas可以轻松定位到 重复数据的位置
import pandas as pd

students = pd.read_excel("source/19Students_Duplicates.xlsx")
dupe = students.duplicated(subset=["Name"])
print(dupe.any())  # 是否有重复数据

# dupe = dupe[dupe == True]
dupe = dupe[dupe]
print(dupe.index)  # Int64Index([20, 21, 22, 23, 24], dtype='int64')

# 定位重复数据
print(students.iloc[dupe.index])
6. 旋转数据表(行&转换)
excel中:
选中要转换的单元格——>剪切——> 粘贴——>转置
python中
import pandas as pd

# 显示不全所作的操作
pd.options.display.max_columns = 999
# 把月份当成Month
videos = pd.read_excel("source/20Videos.xlsx", index_col='Month')
# 转置
table = videos.transpose()
print(table)
7. 读取csv,Tsv,Txt中的数据
Excel中
数据—> 获取外部数据—>自文本
导入csv后
然后依次选择即可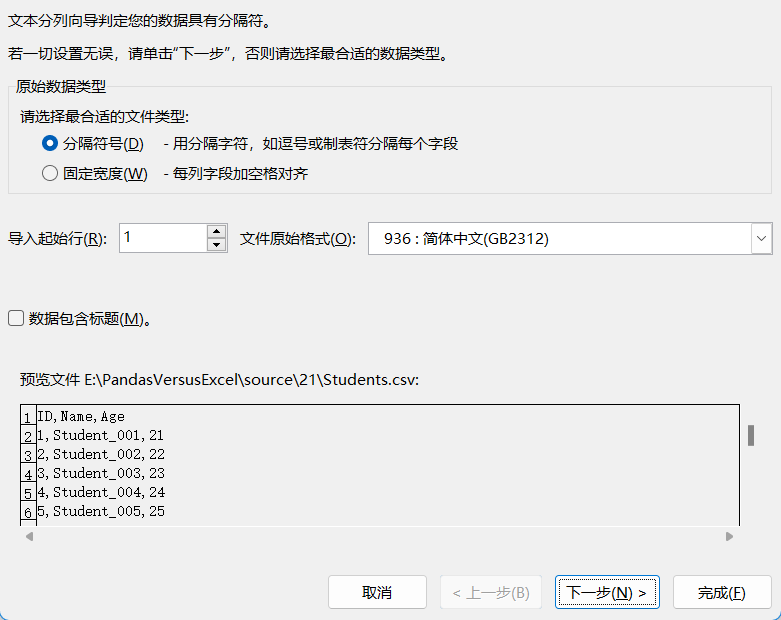
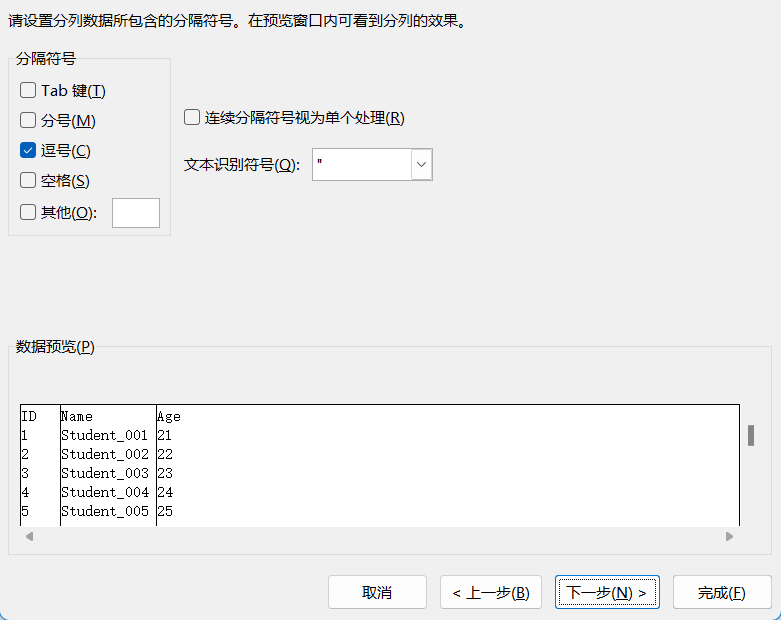
如果选中的格式没有 Python中:
import pandas as pd

# 读取csv
students1 = pd.read_csv("source/21/Students.csv", index_col="ID")
print(students1)

# 读取TSV sep 表示以制表符分割
students2 = pd.read_csv("source/21/Students.tsv", index_col="ID", sep="\t")
print(students2)

# 读取tex
students3 = pd.read_csv("source/21/Students.txt", index_col="ID", sep="|")
print(students3)
8. 透视表 分组 聚合
excel中
数据——> 插入——> 数据透析表
生成这样的一张表
python中
# -*- coding: utf-8 -*-
# @Time    : 2022/8/20 17:56
# @Author  : lzc
# @Email   : hybpjx@163.com
# @File    : 22 数据透析表 分组 聚合.py
# @Software: PyCharm
import pandas as pd
import numpy as np

# 显示不全所作的操作
pd.options.display.max_columns = 999

orders = pd.read_excel("source/22Orders.xlsx")
# print(orders.Date.dtype) # datetime64[ns]

orders['Year'] = pd.DatetimeIndex(orders['Date']).year

"""
# 数据透析表 第一种方式
pt1 = orders.pivot_table(index="Category", columns="Year", values="Total",aggfunc=np.sum)
print(pt1)
"""

# 数据透析表 第二种方式 DataFrame手动画图
groups = orders.groupby(['Category', 'Year'])
s = groups['Total'].sum()
c = groups['ID'].count()

pt2 = pd.DataFrame(
    {
        "Sum": s,
        "Count": c
    }
)

print(pt2)
9. 线性回归 数据分析
按照数据分析 告诉之后局势的发展Excel中
添加散点图——> 选择趋势图——>选择线性 Python中画出柱状图
import matplotlib.pyplot as plt
import pandas as pd
# 科学计算范畴的库
from scipy.stats import linregress

sales = pd.read_excel("source/23Sales.xlsx", dtype={"Month": str})
print(sales)


# x轴 是sales.index y轴是sales.Revenue
plt.bar(sales.index, sales.Revenue)


plt.title("Sales")
# 重新铺了一遍x轴
plt.xticks(sales.index, sales.Month, rotation=90)
# 紧凑布局
plt.tight_layout()
plt.show()
接下俩画出趋势图
import matplotlib.pyplot as plt
import pandas as pd
# 科学计算范畴的库
from scipy.stats import linregress

sales = pd.read_excel("source/23Sales.xlsx", dtype={"Month": str})

slope, intercept, r, p, std_err = linregress(sales.index, sales.Revenue)

exp = sales.index * slope + intercept

# x轴 是sales.index y轴是sales.Revenue
# plt.bar(sales.index, sales.Revenue)
print(slope * 35 + intercept)

plt.scatter(sales.index, sales.Revenue)
plt.plot(sales.index, exp, color="orange")

plt.title(f"y={slope}*x+{intercept}")
# 重新铺了一遍x轴
plt.xticks(sales.index, sales.Month, rotation=90)
# 紧凑布局
plt.tight_layout()
plt.show()
10. 条件格式
10.1 上
要求: 要看下大家的学习情况。使用颜色标记颜色
寻找每次考试的第一名
excel中


选成绩最高的一览

Python中
pycharm 目前不支持 颜色格式的表格
代码为
import pandas as pd

def low_score_red(s):
    color = "red" if s<60 else "black"
    return f"color:{color}"

students = pd.read_excel(r"E:\PandasVersusExcel\source\24Students.xlsx")
# 无差别的识别在显示区域
students.style.applymap(low_score_red,subset=["Test_1","Test_2","Test_3"])
显示第一名
import pandas as pd


def low_score_red(s):
    color = "red" if s < 60 else "black"
    return f"color:{color}"

def highest_score_green(col):
    return ["background-color:lime" if s == col.max() else "background-color:white" for s in col]


students=pd.read_excel(r"E:\PandasVersusExcel\source\24Students.xlsx")
# 无差别的识别在显示区域
students.style.applymap(low_score_red, subset=["Test_1", "Test_2", "Test_3"]).apply(highest_score_green,subset=["Test_1", "Test_2","Test_3"])
10.2 下
使用背景颜色的深浅
**excel中 **使用背景颜色的深浅来表示大小
开始——>条件格式——> 色阶
使用数据条来显示大小
开始——>条件格式——>数据条 Python中
使用背景颜色的深浅来表示大小
import pandas as pd
import seaborn as sns

students = pd.read_excel(r"E:\PandasVersusExcel\source\24Students.xlsx",index_col="ID")
# 背景颜色

color_map = sns.light_palette("green",as_cmap=True)

students.style.background_gradient(color_map,subset=["Test_1", "Test_2","Test_3"])
使用数据条来显示大小
import pandas as pd
import seaborn as sns

students = pd.read_excel(r"E:\PandasVersusExcel\source\24Students.xlsx",index_col="ID")
# 背景颜色

color_map = sns.light_palette("green",as_cmap=True)

students.style.bar(color="green",subset=["Test_1", "Test_2","Test_3"])
11. 行操作
**excel中的拼接 追加 插入 删除 修改某一行的值 **
import pandas as pd

page_001 = pd.read_excel("source/25Students.xlsx", sheet_name="Page_001")
page_002 = pd.read_excel("source/25Students.xlsx", sheet_name="Page_002")
# print(page_001)
# print(page_002)


# # 拼接两张sheet
students = page_001.append(page_002).reset_index(drop=True)  # 即将废弃的方法
# students = pd.concat([page_001, page_002], ignore_index=True)


# # 追加一行
stu = pd.Series({
    "ID": 41,
    "Name": "zic",
    "Score": 99
}, )
#  会生成一个新的
students = students.append(stu, ignore_index=True)
# students.loc[len(students.index)] = ["41", "zic", 99]


# # update 修改表中已有的值
"""
# 这是修改数据
students.at[39, "Name"] = "billy"
students.at[39, "Score"] = "20"
"""

# 直接替换
stu = pd.Series({
    "ID": 40,
    "Name": "Blink",
    "Score": 91
}, )
students.iloc[39] = stu

# # 插入一行 # 在20 和21 中间插入一行
stu = pd.Series({
    "ID": 101,
    "Name": "Dani",
    "Score": 90
}, )
part1 = students[:20]
part2 = students[20:]
students = part1.append(stu, ignore_index=True).append(part2).reset_index(drop=True)

##  删除一行 从0 - 9 删除
"""
# students.drop(index=[0, 1, 2], inplace=True)
# students.drop(index=range(0,10),inplace=True)
students.drop(index=students[0:10].index, inplace=True)
"""

# # 删除空置
for i in range(1, 15):
    students["Name"].at[i] = ""

missing = students.loc[students.Name == ""]

students.drop(index=missing.index, inplace=True)
students=students.reset_index(drop=True)
print(students)
12. 列操作
**excel中的横向拼接 追加 插入 删除 修改某一行的值 **
# -*- coding: utf-8 -*-
# @Time    : 2022/8/21 15:36
# @Author  : lzc
# @Email   : hybpjx@163.com
# @File    : 26列操作.py
# @Software: PyCharm
import numpy as np
import pandas as pd

page_001 = pd.read_excel("source/26Students.xlsx", sheet_name="Page_001")
page_002 = pd.read_excel("source/26Students.xlsx", sheet_name="Page_002")

# 行插入
# students = pd.concat([page_001, page_002]).reset_index(drop=True)

# 列操作 只需要x轴 改成1 从左到右(很少见)
# students = pd.concat([page_001, page_002],axis=1)


# 追加列
students = pd.concat([page_001, page_002]).reset_index(drop=True)
# students['Age'] = np.repeat(25, len(students))
students['Age'] = np.arange(0, len(students))

# 删除列
students.drop(columns=['Age', 'Score'], inplace=True)

# 插入列
students.insert(1, column="Foo", value=np.repeat("foo", len(students)))

# 修改列名
students.rename(columns={
    "Foo": "FOO",
    "Name": "NAME",

}, inplace=True)

# 去掉所有的空值操作 某些ID是空置

students.ID = students.ID.astype(float)
for i in range(5, 14):
    # 把 5-14 置空
    students.ID.at[i] = np.nan

# 直接删除带有NA的全部删除了
students.dropna(inplace=True)

print(students)
13. 链接mysql 数据库
excel中数据——>自其他链接

ODBC的链接
import pandas as pd
import pyodbc
import sqlalchemy

connection = pyodbc.connect('DRIVER={SQL Server}; SERVER=(local); DATABASE=AdventureWorks;USER=sa;PASSWORD=123456')
engine = sqlalchemy.create_engine('mssql+pyodbc://sa:123456@(local)/AdventureWorks?driver=SQL+Server')
query = 'SELECT FirstName, LastName FROM Person.Person'
df1 = pd.read_sql(query, connection)

df2 = pd.read_sql(query, engine)
print(df1)
print(df2)
14. 复杂计算列
求长方形的 外接圆的面积:
分析: 长方形外接圆的直径就是长方形的对角线,而半径就是长方形对角线的一半,带入ΠR2
Excel中
=POWER(SQRT(POWER(B2,2)+POWER(C2,2))/2,2)*PI()

Python中
# -*- coding: utf-8 -*-
# @Time    : 2022/8/21 16:32
# @Author  : lzc
# @Email   : hybpjx@163.com
# @File    : 28复杂计算列.py
# @Software: PyCharm
import numpy as np
import pandas as pd


def get_circumcircle_area(length, height):
    # 求得半径
    r = (np.sqrt(length ** 2 + height ** 2)) / 2
    # 求得圆的面积
    c = r ** 2 * np.pi
    return c


def wrapper(row):
    return get_circumcircle_area(row.Length, row.Height)


rectangles = pd.read_excel("source/28Rectangles.xlsx", index_col="ID")
# axis 扫描的时候是一行一行扫描,
# rectangles['CA'] = rectangles.apply(wrapper, axis=1)
rectangles['CA'] = rectangles.apply(lambda row: get_circumcircle_area(row.Length, row.Height), axis=1)
print(rectangles)


 628
628

 被折叠的 条评论
为什么被折叠?
被折叠的 条评论
为什么被折叠?
 到【灌水乐园】发言


