"""
Created on Tue Nov 16 20:38:41 2021
@author: Machi
"""
import numpy as np
import matplotlib.pyplot as plt
%config InlineBackend.figure_format = 'retina'
np.random.seed(190801)
mu = 200
sigma = 25
n_bins = 50
x = np.random.normal(mu, sigma, size=100)
fig, ax = plt.subplots(figsize=(8, 4))
n, bins, patches = ax.hist(x, n_bins, density=True, histtype='step',
cumulative=True, label='Empirical')
y = ((1 / (np.sqrt(2 * np.pi) * sigma)) *
np.exp(-0.5 * (1 / sigma * (bins - mu))**2))
y = y.cumsum()
y /= y[-1]
ax.plot(bins, y, 'k--', linewidth=1.5, label='Theoretical')
ax.hist(x, bins=bins, density=True, histtype='step', cumulative=-1,
label='Reversed emp.')
ax.grid(True)
ax.legend(loc='right')
ax.set_title('Cumulative step histograms')
ax.set_xlabel('Annual rainfall (mm)')
ax.set_ylabel('Likelihood of occurrence')
plt.show()
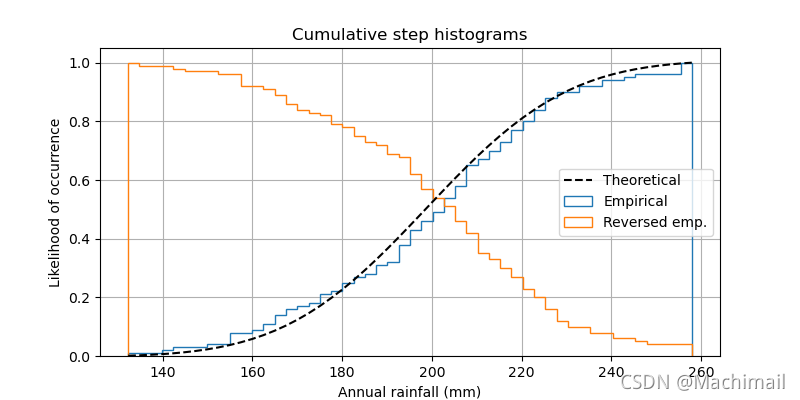


 本文介绍如何利用Python编程语言,结合统计方法,绘制累积分布直方图。通过实例详细解析步骤,包括数据处理、直方图绘制及累计分布计算,帮助读者掌握这一实用技能。


 1218
1218

 被折叠的 条评论
为什么被折叠?
被折叠的 条评论
为什么被折叠?
 到【灌水乐园】发言


