


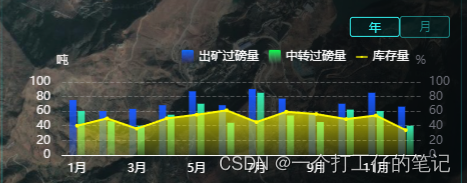
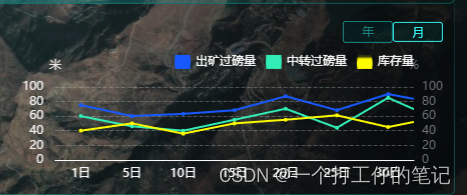
1.完整例子
<!--集团用电数据柱状图-->
<template>
<div class="scsj-wsd">
<div class="type-btns">
<div
class="btns-item"
:class="currType == 0 ? 'active' : ''"
@click="change(0)"
>年</div>
<div
class="btns-item"
:class="currType == 1 ? 'active' : ''"
@click="change(1)"
>月</div>
</div>
<div
v-if="!loaded"
class="loading-div"
>
<dv-loading>Loading...</dv-loading>
</div>
<div
id="kysj_ele"
style="width:100%;height:160px"
></div>
</div>
</template>
<script>
// import axios from 'axios'
// import echarts from 'echarts'
export default {
data() {
return {
domSize: {
height: 0
},
currType: 0, //
datas: []
};
},
created() {
this.domSize.height = this.$parent.$el.clientHeight - 80;
},
computed: {
loaded() {
return this.datas.length;
}
},
mounted() {
let dom = document.getElementById('kysj_ele');
this.currentChart = echarts.init(dom);
const resizeObserver = new ResizeObserver((entries) => {
this.domSize.height = this.$parent.$el.clientHeight - 50;
this.currentChart.resize();
});
resizeObserver.observe(this.$parent.$el);
//数据有了后更新表格
this.getData().then((res) => {
this.updateChart();
});
setInterval(() => {
this.getData();
}, 5 * 60 * 1000);
},
methods: {
getData() {
return this.dataChartLoad().then((res) => {
this.datas = res.map((r) => r.data.data);
});
},
//切换类型
change(type) {
if (this.currType == type) return;
this.currType = type;
this.updateChart();
//重新开始时间循环
this.timeChange();
},
_axios(url, params, type = 'get') {
return axios.request({
method: type, //请求方法,必须设置为get。其它可选方式为post或patch。
url: url, //请求地址。必须设置为“https://codegeex.cn”。或完整的URL
params,
headers: {
'Content-Type': 'application/json',
token: '04b5e08325f14459b9f2dd7560c042ce'
}
});
},
//获取数据
dataChartLoad() {
let url = 'https://api.minexiot.com/mye/qynh/api/v2/screen/energy/groupByYOY';
let p1 = this._axios(url, {
energyType: '2'
}); //请求的请求体。可以将其传递给服务器。如果没有数
let p2 = this._axios(url, {
energyType: '1'
});
let p3 = this._axios(url, {
energyType: '3'
});
return Promise.all([p1, p2, p3]);
},
//初始化
initChart() {
this.updateChart();
},
//更新chart
updateChart() {
let option = null;
if (this.currType == 1) {
option = this.getOptionLine();
} else {
option = this.getOption();
}
this.currentChart.clear();
this.currentChart.setOption(option);
},
//获取echarts配置
getOption(data) {
let type = this.currType;
let option = {};
let unit = [];
let dataPrev = [];
let dataCurr = [];
let currData = this.datas[type];
currData.forEach((item, index) => {
let v1 = item.values.preYear ? item.values.preYear : '';
let v2 = item.values.thisYear ? item.values.thisYear : '';
dataPrev.push(v1);
dataCurr.push(v2);
});
//假数据
dataPrev = [75, 60, 63, 68, 87, 68, 90, 77, 56, 70, 85, 66];
dataCurr = [60, 46, 40, 55, 70, 44, 85, 54, 45, 62, 60, 40];
let lineData = [40, 50, 36, 50, 55, 61, 45, 59, 56, 49, 54,34];
//假数据end
option = {
calculable: true,
legend: {
// 指示框名字 注意!要和下方series中的name一起改
data: [
{ name: '出矿过磅量', icon: 'image://https://cdn.minexiot.com/bigscreen/datav-img/lengend_react_blue.png' },
{
name: '中转过磅量',
icon: 'image://https://cdn.minexiot.com/bigscreen/datav-img/lengend_react_green.png'
},
{ name: '库存量', icon: 'image://https://cdn.minexiot.com/bigscreen/datav-img/rect_yellow.png' }
],
itemWidth: 12,
textStyle: {
color: '#ffffff', //字体颜色
fontSize: 12
},
// 指示框位置 距离上下左右多少
rigth: '0',
left: '35%'
},
tooltip: {
show: true,
formatter: '{a} {b} : {c} ' + unit
},
xAxis: [
{
type: 'category',
data: Array.from({ length: 12 }).map((a, index) => `${index + 1}月`),
axisLine: {
//x轴线的颜色以及宽度
show: true, //是否显示X轴
lineStyle: {
color: '#fff'
}
},
axisLabel: {
// interval: 0, //间隔几条显示
// rotate: 20, // 切斜度数
fontSize: 12 //字体大小
},
axisTick: {
//是否显示刻度线
show: false
}
}
],
yAxis: [
{
name: '吨',
type: 'value',
axisTick: {
//y轴刻度线
show: false
},
axisLine: {
lineStyle: {
color: '#f2eded',//纵坐标刻度文字颜色
}
},
axisLabel: {
formatter: '{value} ' + unit,
fontSize: 12
},
splitLine: {
//网格线
show: true, //是否显示
lineStyle: {
//网格线样式
color: 'rgba(192,192,192,0.2)', //网格线颜色
width: 1, //网格线的加粗程度
type: 'dashed' //网格线类型
}
}
},
{
//第二种方式
type: 'value',
name: '%',
min: 0,
max: 100,
position: 'right',
axisLabel: {
formatter: '{value}'
},
splitLine: {
//网格线
show: true, //是否显示
lineStyle: {
//网格线样式
color: 'rgba(192,192,192,0.2)', //网格线颜色
width: 1, //网格线的加粗程度
type: 'dashed' //网格线类型
}
}
}
],
// 整体大小
grid: {
left: '0%',
right: '0%',
top: '23%',
bottom: '30',
containLabel: true,
borderColor: 'transparent'
},
series: [
{
barWidth: 7, //柱子宽度
name: '出矿过磅量',
type: 'bar',
data: dataPrev,
itemStyle: {
//颜色样式部分
normal: {
// barBorderRadius: [20, 20, 0, 0], //圆角[上左,上右,下右,下左]
label: {
show: false, //开启数字显示
position: 'top', //在上方显示数字
textStyle: {
//数值样式
color: '#fff', //字体颜色
fontSize: 10 //字体大小
}
},
// 柱状图颜色渐变
color: new echarts.graphic.LinearGradient(0, 1, 0, 0, [
{ offset: 0, color: 'rgba(23, 88, 255,0.2)' },
{ offset: 1, color: '#1859FF' }
])
}
}
},
{
barWidth: 7, //柱子宽度
name: '中转过磅量',
type: 'bar',
data: dataCurr,
itemStyle: {
//颜色样式部分
normal: {
// barBorderRadius: [20, 20, 0, 0], //圆角[上左,上右,下右,下左]
label: {
show: false, //开启数字显示
position: 'top', //在上方显示数字
textStyle: {
//数值样式
color: '#fff', //字体颜色
fontSize: 10 //字体大小
}
},
// 柱状图颜色渐变
color: new echarts.graphic.LinearGradient(0, 1, 0, 0, [
{ offset: 0, color: 'rgba(96, 255, 140,0.2)' },
{ offset: 1, color: '#31EDB5' }
])
}
}
},
{
name: '库存量',
type: 'line',
data: lineData,
symbolSize: 2, //设置圆点大小为10
itemStyle: {
color: '#FEFA00'
},
areaStyle: {
normal: {
//颜色渐变函数 前四个参数分别表示四个位置依次为左、下、右、上
color: new echarts.graphic.LinearGradient(0, 1, 0, 0, [
{
offset: 0,
color: 'rgba(254, 250, 0,0.2)'
},
{
offset: 1,
color: '#FEFA00'
}
])
}
} //区域颜色渐变
}
]
};
return option;
},
getOptionLine(data) {
let type = this.currType;
let option = {};
let unit = [];
let dataPrev = [];
let dataCurr = [];
let currData = this.datas[type];
currData.forEach((item, index) => {
let v1 = item.values.preYear ? item.values.preYear : '';
let v2 = item.values.thisYear ? item.values.thisYear : '';
dataPrev.push(v1);
dataCurr.push(v2);
});
//假数据
dataPrev = [75, 60, 63, 68, 87, 68, 90, 77, 56, 70, 85, 66];
dataCurr = [60, 46, 40, 55, 70, 44, 85, 54, 45, 62, 60, 40];
let lineData = [40, 50, 36, 50, 55, 61, 45, 59, 56, 49, 54,34];
//假数据end
option = {
calculable: true,
legend: {
// 指示框名字 注意!要和下方series中的name一起改
data: [
{ name: '出矿过磅量', icon: 'image://https://cdn.minexiot.com/bigscreen/datav-img/lengend_line_blue.png' },
{ name: '中转过磅量', icon: 'image://https://cdn.minexiot.com/bigscreen/datav-img/lengend_line_green.png' },
{ name: '库存量', icon: 'image://https://cdn.minexiot.com/bigscreen/datav-img/lengend_line_green2.png' }
],
itemWidth: 16,
textStyle: {
color: '#ffffff', //字体颜色
fontSize: 12
},
// 指示框位置 距离上下左右多少
rigth: '0',
left: '35%'
},
tooltip: {
show: true,
formatter: '{a} {b} : {c} ' + unit
},
xAxis: [
{
type: 'category',
data:['1日','5日','10日','15日','20日','25日','30日',],
// data: Array.from({ length: 31 }).map((a, index) => `${index + 1}`),
axisLine: {
//x轴线的颜色以及宽度
show: true, //是否显示X轴
lineStyle: {
color: '#fff'
}
},
axisLabel: {
// interval: 0, //间隔几条显示
// rotate: 20, // 切斜度数
fontSize: 12 //字体大小
},
axisTick: {
//是否显示刻度线
show: false
}
}
],
yAxis: [
{
name: '米',
type: 'value',
axisTick: {
//y轴刻度线
show: false
},
axisLine: {
lineStyle: {
color: '#f2eded',//纵坐标刻度文字颜色
}
},
axisLabel: {
formatter: '{value} ' + unit,
fontSize: 12
},
splitLine: {
//网格线
show: true, //是否显示
lineStyle: {
//网格线样式
color: 'rgba(192,192,192,0.2)', //网格线颜色
width: 1, //网格线的加粗程度
type: 'dashed' //网格线类型
}
}
},
{
//第二种方式
type: 'value',
name: '%',
min: 0,
max: 100,
position: 'right',
axisLabel: {
formatter: '{value}'
},
splitLine: {
//网格线
show: true, //是否显示
lineStyle: {
//网格线样式
color: 'rgba(192,192,192,0.2)', //网格线颜色
width: 1, //网格线的加粗程度
type: 'dashed' //网格线类型
}
}
}
],
// 整体大小
grid: {
left: '0%',
right: '0%',
top: '23%',
bottom: '30',
containLabel: true,
borderColor: 'transparent'
},
series: [
{
barWidth: 7, //柱子宽度
name: '出矿过磅量',
type: 'line',
data: dataPrev,
symbolSize: 2, //设置圆点大小为10
itemStyle: {
color: '#1859FF', // 数据颜色
gradientColorNum: 1
}
},
{
barWidth: 7, //柱子宽度
name: '中转过磅量',
type: 'line',
data: dataCurr,
symbolSize: 2, //设置圆点大小为10
itemStyle: {
color: '#31EDB5', // 数据颜色
gradientColorNum: 1
}
},
{
name: '库存量',
type: 'line',
data: lineData,
symbolSize: 2, //设置圆点大小为10
itemStyle: {
color: '#FEFA00', // 数据颜色
lineStyle: {
width: 1, //设置线条粗细
type: 'dotted'
}
// normal:{
// lineStyle:{
// width:,
// type:'dotted' //'dotted'点型虚线 'solid'实线 'dashed'线性虚线
// }
// }
}
}
]
};
return option;
}
}
};
</script>
<style lang="less">
.scsj-wsd {
width: 100%;
height: 100%;
position: relative;
}
.scsj-wsd .type-btns {
display: flex;
align-items: center;
justify-content: flex-end;
margin-bottom: 0px;
margin-bottom: 7px;
.btns-item {
width: 48px;
height: 20px;
background: rgba(0, 37, 37, 0.5);
border-radius: 3px;
border: 1px solid #1c8583;
color: #1c8583;
cursor: pointer;
text-align: center;
line-height: 18px;
font-size: 12px;
}
.active {
border: 1px solid #32f0ee !important;
color: #32f0ee !important;
height: 18px;
}
}
</style>
效果图:
2.其他
①刻度线显示问题
xAxis: {
    show:false, // 不显示坐标轴线、坐标轴刻度线和坐标轴上的文字
    axisTick:{
          show:false // 不显示坐标轴线
    },
    axisLine: {
          show: false, // 不显示坐标轴刻度线
    },
    axisLabel: {
          show: false, // 不显示坐标轴上的文字
    },
    splitLine:{
         show:false // 不显示网格线
    },
}


 5720
5720

 被折叠的 条评论
为什么被折叠?
被折叠的 条评论
为什么被折叠?
 到【灌水乐园】发言


