


实验目的
掌握集成学习思想,掌握boosting策略,基于AdaBoost实现多分类任务。
实验要求
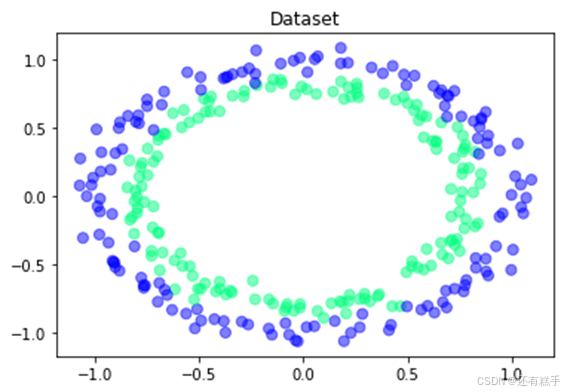
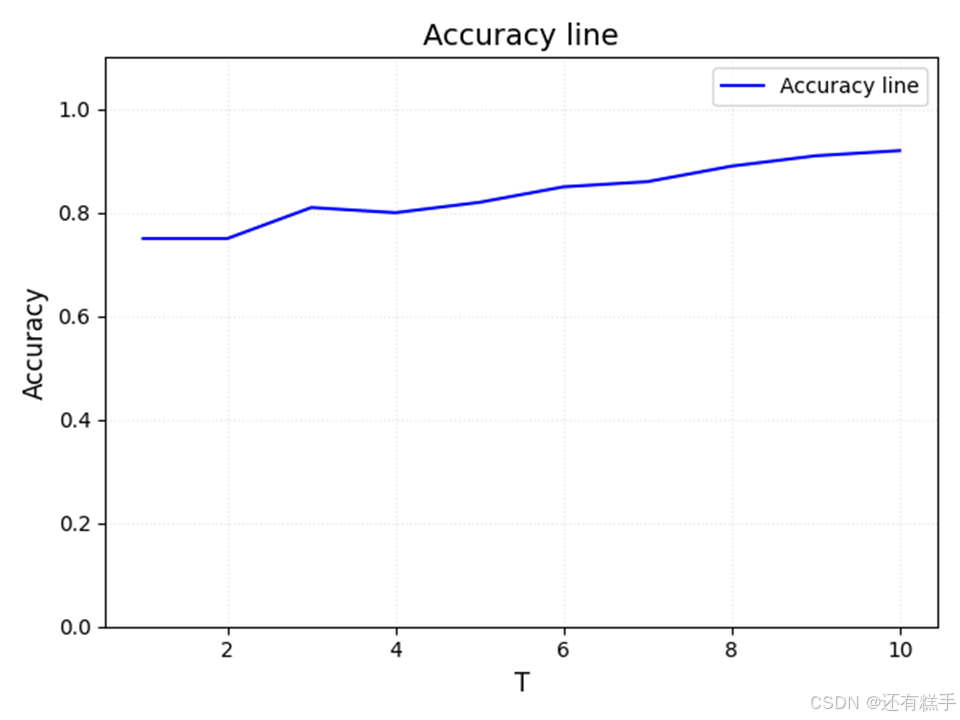
编程实现AdaBoost集成方法,对如下数据集进行分类。基模型采用决策树模型,划分属性指标采用信息熵指标,决策树最大深度设置为1。将基模型数量T依次设置为1,2,…,10,计算集成模型在测试集上的精度,并绘制集成模型精度随基模型数量增加的变化曲线。
实验环境
Python,numpy,matplotlib
实验代码
import numpy as np

import matplotlib.pyplot as plt

import matplotlib

from sklearn.tree import DecisionTreeClassifier


matplotlib.use("TKAgg")


# 训练Adaboost

def AdaBoost(X, Y, T):

    # 得到样本个数

    n_samples = X.shape[0]

    # 初始化样本权重

    w = np.ones(n_samples) / n_samples


    # 初始化存储基分类器和权重的列表

    baseClassifier = []

    alpha = []


    # 训练循环

    for i in range(T):

        # 创建决策树

        h = DecisionTreeClassifier(criterion='entropy', max_depth=3, random_state=42)

        # 训练

        h.fit(X, Y, w)

        # 得到训练数据的预测值

        pred = h.predict(X)

        # 计算错误率

        err = np.sum(w * (pred != Y))

        if err > 0.5:

            break

        # 计算权重

        a = 0.5 * np.log((1 - err) / err)

        # 更新样本权重

        w *= np.exp(-a * Y * pred)

        # 归一化

        w /= np.sum(w)

        # 将模型和权重加入列表

        baseClassifier.append(h)

        alpha.append(a)


    return baseClassifier, alpha


# 计算精度

def accuracy(baseClassifier, alpha, T, X, y):

    # 初始化输出值

    output = np.zeros_like(y)


    for i in range(T):

        # 加上每个基分类器和权重的乘积

        output += alpha[i] * baseClassifier[i].predict(X)


    # 经过sign

    output = np.sign(output)

    # 输出精度

    return np.sum(output == y) / len(y)


# 导入训练数据

train_dataset = np.genfromtxt('experiment_08_training_set.csv', delimiter=',', skip_header=1)

train_x = train_dataset[:, :-1]

train_y = train_dataset[:, -1]


# 导入测试数据

test_dataset = np.genfromtxt('experiment_08_testing_set.csv', delimiter=',', skip_header=1)

test_x = test_dataset[:, :-1]

test_y = test_dataset[:, -1]


# 基分类器个数

T = 10

# 得到基分类器和权重列表

baseClassifier, alpha = AdaBoost(train_x, train_y, T)


# 初始化画图数据

x_line = np.arange(1, T+1)

y_line = np.zeros(T)


# 输出不同基分类器个数的精度

for i in range(T):

    y_line[i] = accuracy(baseClassifier, alpha, i+1, test_x, test_y)

    print(f"T: {i+1} -> Accuracy: {y_line[i]: .2f}")


# 画精度曲线

plt.figure(1)

plt.plot(x_line, y_line, color='b', linewidth=1.5, label='Accuracy line')

plt.xlabel("T", fontsize=12)

plt.ylabel("Accuracy", fontsize=12)

plt.title("Accuracy line", fontsize=14)

plt.legend(loc='upper right', frameon=True)

plt.grid(alpha=0.3, linestyle=':')

plt.ylim(0, 1.1)

plt.tight_layout()

plt.show()
结果分析
测试集上精度
|
T |
1 |
2 |
3 |
4 |
5 |
6 |
7 |
8 |
9 |
10 |
|
精度 |
0.75 |
0.75 |
0.81 |
0.80 |
0.82 |
0.85 |
0.86 |
0.89 |
0.91 |
0.92 |
精度随T增加的变化曲线


 279
279

 被折叠的 条评论
为什么被折叠?
被折叠的 条评论
为什么被折叠?
 到【灌水乐园】发言


