 var myChart = echarts.init(document.getElementById('main'));

        // 指定图表的配置项和数据
        var option = {

            tooltip: {},
            xAxis: {
               data: ["2015","2016","2017","2018"],
			   axisLine: {
				   show: false,
				   textStyle: {
					color: 'rgba(93,113,165,0.3)'
				   }
			   },
			   axisLabel: {
					show: true,
					textStyle: {
						color: '#6c84c1'
					}
				}
            },
            yAxis: {
			   axisLine: {show:false},
			   axisLabel: {
					show: true,
					textStyle: {
						color: '#6c84c1'
					}
				}
			},
            series: [{
                name: '服务企业数量',
                type: 'bar',
                data: [ 20, 36, 10, 20],
				itemStyle: {
					normal:{
          //每个柱子的颜色即为colorList数组里的每一项,如果柱子数目多于colorList的长度,则柱子颜色循环使用该数组
          color: function (params){

            //我这边就两个柱子,大体就两个柱子颜色渐变,所以数组只有两个值,多个颜色就多个值
            var colorList = [
						['#2078be','#384198'],
						['#f3cc20','#f29216'],
						['#71c5cf','#1e7bc0'],
						['#f29525','#e94925']

					   ];

				  var index=params.dataIndex;
				  if(params.dataIndex >= colorList.length){
						  index=params.dataIndex-colorList.length;
				   }

				  return new echarts.graphic.LinearGradient(0, 0, 0, 1,
				  [
					 {offset: 0, color: colorList[index][0]},
					 {offset: 1, color: colorList[index][1]},
				  ]);
          }
        },
                emphasis: {
                    color: new echarts.graphic.LinearGradient(
                        0, 0, 0, 1,
                        [
                            {offset: 0, color: '#e94a25'},
                            {offset: 0.7, color: '#f29325'},
                           /* {offset: 1, color: '#83bff6'}*/
                        ]
                    )
                }
            }
            }]
        };

        // 使用刚指定的配置项和数据显示图表。
        myChart.setOption(option);
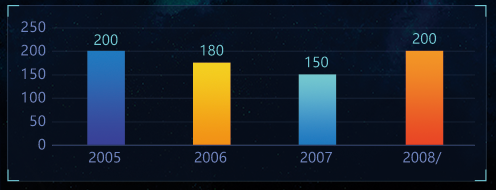


 本文介绍如何使用ECharts创建带有渐变效果的柱状图,详细展示了配置项和数据设置,包括自定义柱子颜色、轴线样式及标签显示等技巧。


 3029
3029

 被折叠的 条评论
为什么被折叠?
被折叠的 条评论
为什么被折叠?
 到【灌水乐园】发言


