


 这篇博客介绍了如何使用OrgChart.js库来构建组织结构图,包括环境配置、初始化、导出、预定义模板等功能。还展示了如何进行CSS自定义、编辑、导航、展开与折叠、拖放操作,以及菜单和文字溢出的处理。此外,博客提到了slink和clinks两种链接类型,以及group分组和编辑节点的特性。
环境配置
先引入两个文件:
<link href="https://fonts.googleapis.com/css?family=Gochi+Hand" rel="stylesheet">
<script type="text/jscript" src="https://balkangraph.com/js/latest/OrgChart.js"></script>
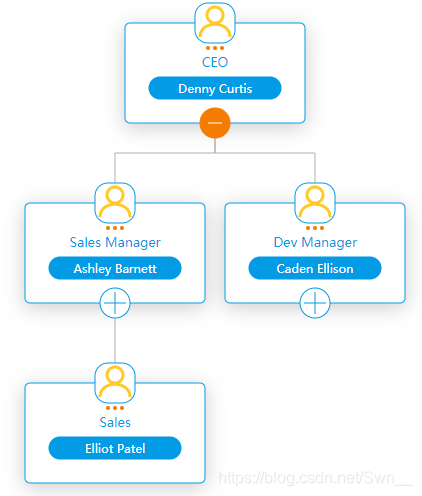
先看一下简单的demo:
HTML部分很简单:
<div id="chart-container"></div>
js部分初始化:
初始化
	var chart = new OrgChart(document.getElementById("chart-container"), {
        nodeBinding: {
            field_0: "name",
        },
        nodes: [
            { id: 1, name: "Denny Curtis"},
            { id: 2, pid: 1, name: "Ashley Barnett" },
            { id: 3, pid: 1, name: "Caden Ellison" },
            { id: 4, pid: 2, name: "Elliot Patel" },
        ]
    });
导出
如果要将生成的组织结构图导出的话:
	  var chart = new OrgChart(document.getElementById("chart-container"), {
        menu: {
            pdf: { text: "Export PDF" },
            png: { text: "Export PNG" },
            svg: { text: "Export SVG" },
            csv: { text: "Export CSV" }
        },
        nodeMenu: {
            pdf: { text: "Export PDF" },
            png: { text: "Export PNG" },
            svg: { text: "Export SVG" }
        },
        ...
    });
默认情况下折叠之后的子节点不会导出,如果要更改必须添加自己的导出节点菜单项
	function pdf(nodeId) {
            chart.exportPDF({filename: "MyFileName.pdf", expandChildren: true, nodeId: nodeId});
        }
    function png(nodeId) {
            chart.exportPNG({filename: "MyFileName.png", expandChildren: true, nodeId: nodeId});
        }
    function svg(nodeId) {
            chart.exportSVG({filename: "MyFileName.svg", expandChildren: true, nodeId: nodeId});
        }

    var chart = new OrgChart(document.getElementById("chart-container"), {
       menu: {
                export_pdf: {
                    text: "Export PDF",
                    icon: OrgChart.icon.pdf(24, 24, "#7A7A7A"),
                    onClick: pdf
                },
                export_png: {
                    text: "Export PNG",
                    icon: OrgChart.icon.png(24, 24, "#7A7A7A"),
                    onClick: png
                },
                export_svg: {
                    text: "Export SVG",
                    icon: OrgChart.icon.svg(24, 24, "#7A7A7A"),
                    onClick: svg
                }
            },
            nodeMenu: {
                export_pdf: {
                    text: "Export PDF",
                    icon: OrgChart.icon.pdf(24, 24, "#7A7A7A"),
                    onClick: pdf
                },
                export_png: {
                    text: "Export PNG",
                    icon: OrgChart.icon.png(24, 24, "#7A7A7A"),
                    onClick: png
                },
                export_svg: {
                    text: "Export SVG",
                    icon: OrgChart.icon.svg(24, 24, "#7A7A7A"),
                    onClick: svg
                }
            },
            ...
      });
导出为A4格式:
 		function pdf(nodeId) {
           chart.exportPDF({
              format: "A4"
           });
        }
        var chart = new OrgChart(document.getElementById("chart-container"), {
            menu: {
                export_pdf: {
                    text: "Export PDF",
                    icon: OrgChart.icon.pdf(24, 24, "#7A7A7A"),
                    onClick: pdf
                },
            }
            ...
        });
增加header和footer:
  	  function pdf(nodeId) {
            chart.exportPDF({
                format: "A4",
                header: 'My Header',
                footer: 'My Footer. Page {current-page} of {total-pages}'
            });
        }

        var chart = new OrgChart(document.getElementById("chart-container"), {
            menu: {
                export_pdf: {
                    text: "Export PDF",
                    icon: OrgChart.icon.pdf(24, 24, "#7A7A7A"),
                    onClick: pdf
                },
            }
            ...
        });
PDF预览:
		 OrgChart.pdfPrevUI.show(chart, {
            format: "A4",
            header: 'My Header',
            footer: 'My Footer. Page {current-page} of {total-pages}'
        });
预定义模板
OrgCharts.js提供了许多预定义模板,可以设置和更改.
var chart = new OrgChart(document.getElementById("chart-container"), {
   template: "isla",  //luba,derek,olivia,diva,mila,polina,mery,rony,belinda,ula,ana(默认),isla,deborah
});
ps:也可以自定义模板,方法是继承其中一个预定义的模板并覆盖某些属性
自定义模板官网地址
也可以做多个模板:
    nodes: [
        { id: "1", tags: ["Management"], ...}
    ]
使用相同标签标记的所有节点都属于同一集合,例如上述的Management标签的模板都是‘rony’
    tags: {
        "Management": {
            template: "rony"
        }
    },
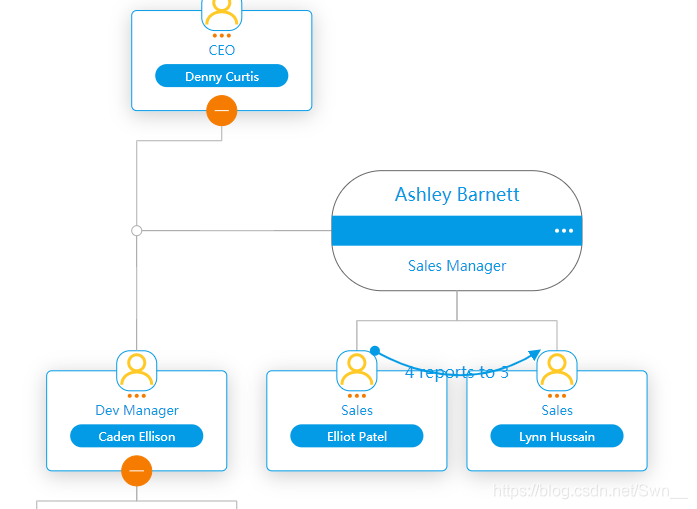
slink 第二个链接
var chart = new OrgChart(document.getElementById("chart-container"), {
slinks:[
{from: 4, to: 1, label: 'text'},
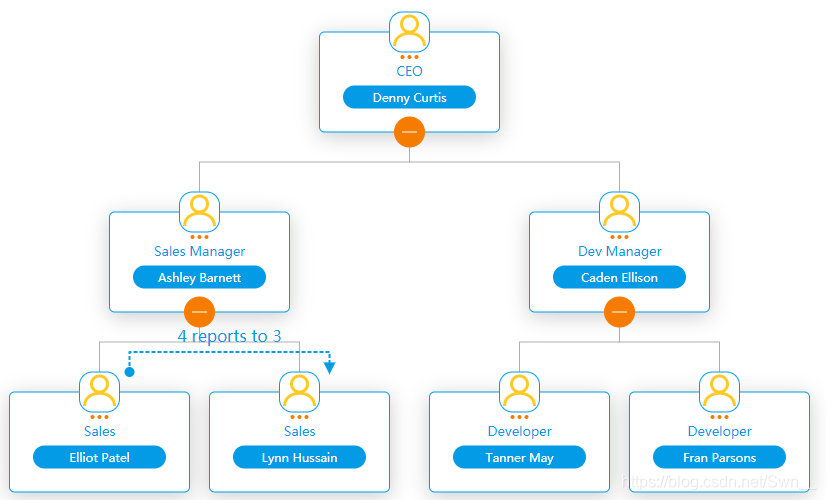
{from: 4, to: 5, template: 'blue', label: '4 reports to 3' },
{from: 2, to: 6, template: 'yellow', label: 'lorem ipsum' },
],
});
从哪个到那个的链接,上述实现的效果如下:
{from: 4, to: 1, label: 'text'}
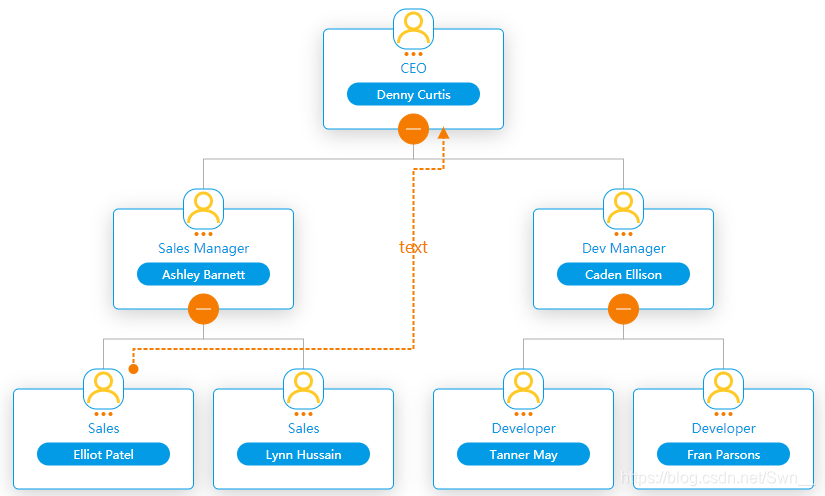
{from: 4, to: 5, template: 'blue', label: '4 reports to 3' }
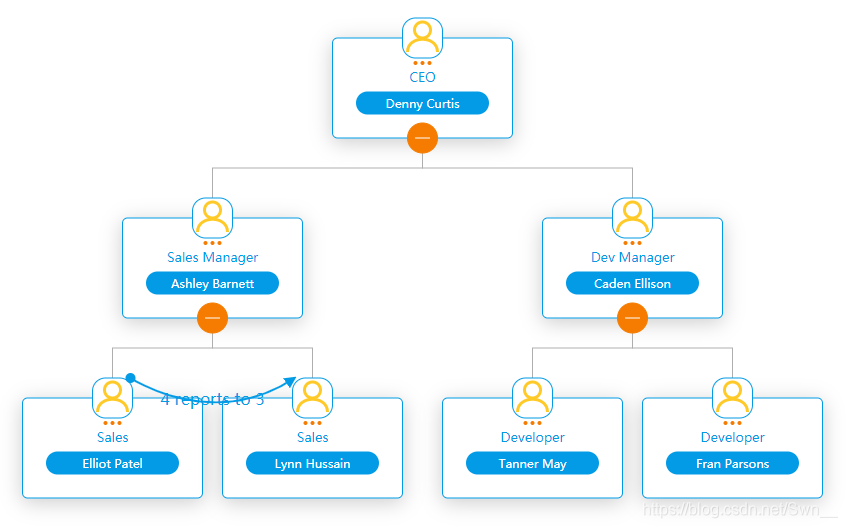
clinks 弯曲的链接
和上述用法一样,只是改个属性名
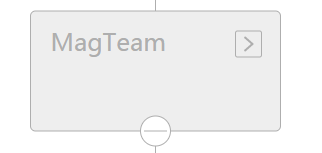
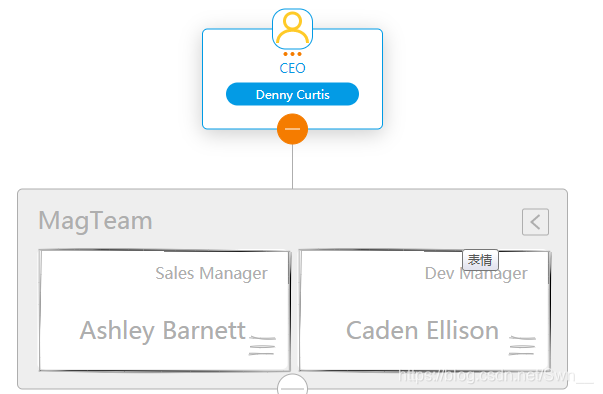
group 分组
与为每个节点分配自己的盒子相比,将多个节点放到一个盒子中可以节省大量空间。例如,如果您有两名董事或两名团队负责人,则需要将他们分组。
要将两个节点分组为一个,请为其设置一个标签。这是一个例子
	var chart = new OrgChart(document.getElementById("chart-container"), {
        ...
        nodes: [
            ...
           { id: 1, pid: 1, tags: ["Mag"]},
           { id: 2, pid: 1, tags: ["Mag"] },
        ],
        tags: {
            Mag: {
                group: true,
                groupName: "HR Team",
                groupState: OrgChart.COLLAPSE,
                template: "group_grey"
            }
        }
    });
将tags 为Mag的节点分到一个盒子里,可以展开。
也可以为里面的节点单独设置template
		 var chart = new OrgChart(document.getElementById("chart-container"), {
            template: "isla",
            tags: {
                Mag: {
                    group: true,
                    groupName: "HR Team",
                    groupState: OrgChart.EXPAND,
                    template: "group_grey"
                },
                "Node with unique template": {
                    template: "derek"
                }
            },
            nodes: [
                ...
                { id: 4, pid: 1, tags: ["Mag", "Node with unique template"] }
                { id: 4, pid: 1, tags: ["Mag", "Node with unique template"] }
            ]
        });
assistant
可以在一张图表中通过将其标记设置为“assistant”来指定一个或多个助手节点
	var chart = new OrgChart(document.getElementById("chart-container"), {
        ...
        nodes: [
            ...
            { id: 1, pid: 1, tags: ["assistant"]}
        ],
         tags: {
      	   "assistant": {
            template: "mery"
        }
  	  }
    });
css定制
有时您想稍微自定义OrgChart JS,例如更改字体颜色或字体样式。您可以使用自定义CSS覆盖图表样式或向图表样式添加新的CSS属性。
您可以使用的CSS选择器
- [node-id] -属性选择器
- [link-id] -属性选择器
- [control-expcoll-id] -属性选择器 ,更改折叠按钮的属性
- [control-node-menu-id] -属性选择器 ,更改节点菜单按钮的颜色:
- .bg-field_0(如果定义了field_0)-类选择器,更改第一个字段的颜色和字体
- svg-标签选择器,更改背景
- .bg-search-table -class选择器, 更改搜索控件
[node-id] rect {
    fill: #016e25;
 }
 .....
[node-id='1'] rect {
    fill: #750000;
}
 ...
[link-id='[3][4]'] path {
    stroke: #016e25;
}
编辑 Edit
var chart = new OrgChart(document.getElementById("chart-container"), {
	nodeMenu:{
       details: {text:"详细信息"},
       edit: {text:"编辑"},
       add: {text:"添加"},
       remove: {text:"删除"}
    },
     ...
});
Navigation 导航
1、 鼠标滑动
- 垂直和水平滚动
将mouseScrool选项设置为OrgChart.action.scroll,可以使用鼠标进行导航:
- 仅水平滚动
为了启用水平滚动条,将showXScroll设置为OrgChart.scroll.visible。也可以选择使用鼠标滚动将mouseScrool设置为OrgChart.action.xScroll
- 仅垂直滚动
现在将showYScroll设置为OrgChart.scroll.visible并将mouseScrool设置为OrgChart.action.yScrol
- 滚动灵敏度
要增加或减少滚动灵敏度,更改OrgChart.scroll.smooth和OrgChart.scroll.speed常数,默认值为:
OrgChart.scroll.smooth = 12;
OrgChart.scroll.speed = 12;
也可以更改特定浏览器的滚动灵敏度。例如:
    OrgChart.scroll.safari = {
        smooth: 12,
        speed: 500
    };
    OrgChart.scroll.ie = { smooth: 12, speed: 200 };
    OrgChart.scroll.edge = { smooth: 12, speed: 200 };
    OrgChart.scroll.chrome = { smooth: 12, speed: 200 };
    OrgChart.scroll.firefox = { smooth: 12, speed: 200 };
    OrgChart.scroll.opera = { smooth: 12, speed: 200 };
2、 Pan
在OrgChart JS中平移/移动,左键单击并按住鼠标按钮,然后向任意方向拖动鼠标。不能禁用平移导航。
3、 Zoom 缩放
Chage mouseScrool to OrgChart.action.zoom.
展开与折叠
- 展开与折叠选项
var chart = new OrgChart(document.getElementById("chart-container"), {
    collapse: {
       level: 2,
       allChildren: true
     },
   ...
})
只显示两行,将图表汇总到第二级以及第二级的所有子级
 collapse: {
	level: 2,
	allChildren: true
},
expand: {
	nodes: [4]
},
折叠到二级,4号节点展开
展开ID为4及所有的子项
expand: {
   nodes: [4],
   allChildren: true
}
- 使用tags
默认情况下,所有节点都展开,如果要折叠特定节点或所有节点,则可以为其设置标签。
var chart = new OrgChart(document.getElementById("chart-container"), {
        tags: {
            "hide": {
                state: OrgChart.COLLAPSE
            }
        },
        ....
        nodes: [
            { id: "1", name: "Amber McKenzie", title: "CEO" },
            { id: "2", tags: ["hide"], name: "Ava Field", title: "IT Manager" },
            { id: "3", name: "Rhys Harper", title: "Marketing Team Lead"}
            ...
        ]
});
默认情况下,所有带有标签“ hide”的节点都将折叠,您可以将标签名“ hide”更改为其他名称。状态选项可以是OrgChart.COLLAPSE或OrgChart.EXPAND。
- .展开/折叠节点单击事件
要在节点上展开或折叠,请单击将nodeMouseClick设置为OrgChart.action.expandCollapse
var chart = new OrgChart(document.getElementById("chart-container"), {
    nodeMouseClick: OrgChart.action.expandCollapse,
    ...
});
在某些情况下,可能不需要扩展/折叠按钮,要隐藏它,将需要覆盖模板。在演示波纹管中,所有节点都折叠
OrgChart.templates.ana.plus = "";
OrgChart.templates.ana.minus = "";
var chart = new OrgChart(document.getElementById("chart-container"), {
    template: "ana",template: "ana",
   ......
});
拖放
要启用拖放功能,将enableDragDrop选项设置为true 。
可重构图的结构
- 与组拖放
var chart = new OrgChart(document.getElementById("chart-container"), {
   dragDropMenu: {
     addInGroup: { text: "Add in group" },
     addAsChild: { text: "Add as child" }
   },
        ...
});
- Event 大事件
如果要有条件地取消拖放操作,添加放置事件处理程序。
OrgChart.REMOVE_GROUP_IF_HAS_ONE_NODE = false;
	var chart = new OrgChart(document.getElementById("chart-container"), {
    dragDropMenu: {
                addInGroup: { text: "Add in group" },
                addAsChild: { text: "Add as child" }
            },
  	  ...
	});
	 chart.on('drop', function (sender, draggedNodeId, droppedNodeId) {
	    if (draggedNodeId == 1){
        return false;
    }

  	  if (droppedNodeId == 4){
      	  return false;
   	}
   });

	 chart.load([
  		  { id: 0 },
  		  { id: 1, pid: 0 },
  		  { id: 2, pid: 0 }
	 ])
- Constants
默认情况下,如果组中有两个节点并从该组中删除第一个节点,则该组也将从第二个节点中删除。要更改该行为,请将OrgChart.REMOVE_GROUP_IF_HAS_ONE_NODE设置为false。
OrgChart.REMOVE_GROUP_IF_HAS_ONE_NODE = false;
var chart = new OrgChart(document.getElementById("chart-container"), {
	dragDropMenu: {
		addInGroup: { text: "Add in group" },
		addAsChild: { text: "Add as child" }
  },
 ...
});
菜单
OrgChart JS有4个菜单
- 菜单-右上角
- nodeMenu-节点中的按钮
- nodeContextMenu-没有上下文菜单
- dragDropMenu-启用分组或拖放功能时使用
预定义菜单项
- add-调用addNode方法
- 编辑-调用editUI.show方法
- 详细信息-调用editUI.show方法
- remove-调用removeNode方法
- svg-调用exportSVG方法
- pdf-调用exportPDF方法
- png-调用exportPNG方法
- csv-调用exportCSV方法
- addInGroup-调用组方法
- addAsChild-调用linkNode方法
对于预定义的菜单项,可以指定文本和/或图标
    var chart = new OrgChart(document.getElementById("chart-container"), {
      nodeContextMenu: {
        edit: { text: "Edit", icon: OrgChart.icon.edit(18, 18, '#039BE5')  },
        add: { text: "Add", icon: OrgChart.icon.add(18, 18, '#FF8304') }
      },
      ...
    });
使用图标,单击事件和文本将您自己的菜单项添加到节点菜单
    var chart = new OrgChart(document.getElementById("chart-container"), {
         nodeMenu: {
                call: {
                    icon: webcallMeIcon,
                    text: "Call now",
                    onClick: callHandler
                }
            },
            ...
    });
    //图标可以是图像html元素(img)或svg元素
 	var webcallMeIcon = <svg width="24" height="24" viewBox="0 0 300 400"><g transform="matrix...
   //callHandler函数具有一个参数nodeId
    function callHandler(nodeId) {
        var nodeData = chart.get(nodeId);
        var employeeName = nodeData["name"];
        window.open('https://webcall.me/' + employeeName, employeeName, 'width=340px, height=670px, top=50px, left=50px');
    }
使用标签覆盖特定节点的节点菜单项
可以通过标记节点来覆盖节点菜单项
var chart = new OrgChart(document.getElementById("chart-container"), {
        nodeMenu: {
            pdf: {
                text: "Export To Pdf",
            }
        },
        tags:{
            overrideMenu:{
                nodeMenu:{
                    add: {text: "Add New" }
                }
            }
        },
    ...
});
使用显示事件覆盖特定节点的节点菜单项
    var chart = new OrgChart(document.getElementById("chart-container"), {
        nodeMenu: {},
        nodeContextMenu: {},
        dragDropMenu: {},
        menu: {}
        ...
    });

    chart.dragDropMenuUI.on('show', function(sender, args){
          args.menu = { myMenuItem: { text: "My Text", icon: OrgChart.icon.add(16,16,"#ccc"), onClick: function(id) {alert(id)} } }
    });

    chart.nodeMenuUI.on('show', function(sender, args){
          args.menu = { myMenuItem: { text: "My Text", icon: OrgChart.icon.add(16,16,"#ccc"), onClick: function(id) {alert(id)} } }
    });

    chart.menuUI.on('show', function(sender, args){
          args.menu = { myMenuItem: { text: "My Text", icon: OrgChart.icon.add(16,16,"#ccc"), onClick: function(id) {alert(id)} } }
    });

    chart.nodeContextMenuUI.on('show', function(sender, args){
          args.menu = { myMenuItem: { text: "My Text", icon: OrgChart.icon.add(16,16,"#ccc"), onClick: function(id) {alert(id)} } }
    });

    chart.load(...);
文字溢出
文本溢出模板字段属性指定应如何向用户发信号通知未显示的溢出内容。它可以被剪切,显示省略号(…)或多行。如果将文本溢出设置为省略号,则将在悬停时显示整个文本。
这两个属性都是文本溢出所必需的:
- 文字溢出
- 宽度
剪切的字段 - text-overflow =“省略号”
OrgChart.templates.myTemplate = Object.assign({}, OrgChart.templates.olivia);
OrgChart.templates.myTemplate.field_0 = '<text width="230" text-overflow="ellipsis" style="font-size: 24px;" fill="#757575" x="125" y="100" text-anchor="middle">{val}</text>';
多行字段 - text-overflow =“ multiline”
 OrgChart.templates.myTemplate = Object.assign({}, OrgChart.templates.olivia);
OrgChart.templates.myTemplate.field_1 =  '<text width="230" text-overflow="multiline" style="font-size: 16px;" fill="#757575" x="125" y="30" text-anchor="middle">{val}</text>';


 4万+
4万+

 被折叠的 条评论
为什么被折叠?
被折叠的 条评论
为什么被折叠?
 到【灌水乐园】发言


