


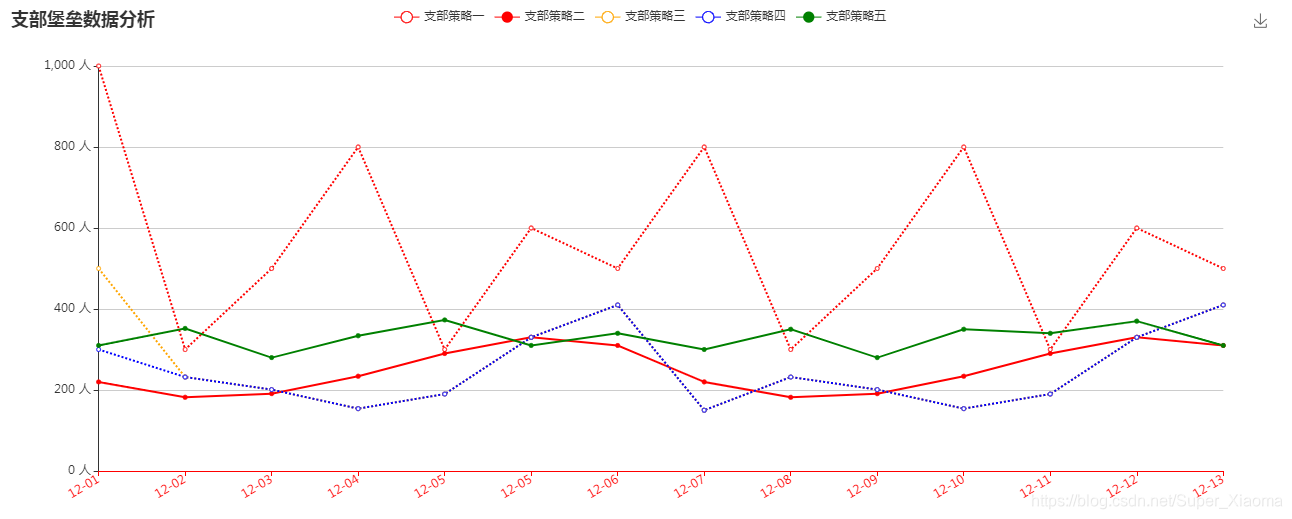
 本文介绍了一种使用ECharts实现的党员先锋数据分析图表制作方法。该图表包含五个不同的先锋策略,并展示了每个月的人数变化趋势,通过实线和虚线区分不同的策略效果。
效果图:
1,首先要引入echarts.js 下载链接: http://echarts.baidu.com/download.html
//页面上准备一个盒子,作为存放统计图的容器
<div id="echarts_30" style="height: 500px; width:100%; margin-top: 0px;" class="m-b-sm"></div>
//把js放在下面就可以了
<script type="text/javascript">
var myChart = echarts.init(document.getElementById("echarts_30"));
var option = {
// 标题
title: {
text: '党员先锋数据分析'
},
tooltip: {
trigger: 'axis'
},
//图例名
legend: {
data:['先锋策略一','先锋策略二','先锋策略三','先锋策略四','先锋策略五']
},
grid: {
left: '3%', //图表距边框的距离
right: '4%',
bottom: '3%',
containLabel: true
},
//工具框,可以选择
toolbox: {
feature: {
saveAsImage: {}
}
},
//x轴信息样式
xAxis: {
type: 'category',
boundaryGap: false,
data: ['19-01','19-02','19-03','19-04','19-05','19-05','19-06','19-07','19-08','19-09','19-10','19-11','19-12'],
//坐标轴颜色
axisLine:{
lineStyle:{
color:'red'
}
},
//x轴文字旋转
axisLabel:{
rotate:30,
interval:0
},
},
yAxis : [
{
type : 'value',
axisLabel : {
formatter: '{value} 人'
}
}
],
series: [
//虚线
{
name:'先锋策略一',
type:'line',
symbolSize:4, //拐点圆的大小
color:['red'], //折线条的颜色
data:[1000, 300, 500, 800, 300, 600,500,800, 300, 500, 800, 300, 600,500],
smooth:false, //关键点,为true是不支持虚线的,实线就用true
itemStyle:{
normal:{
lineStyle:{
width:2,
type:'dotted' //'dotted'虚线 'solid'实线
}
}
}
},
//实线
{
name:'先锋策略二',
type:'line',
symbol:'circle',
symbolSize:4,
itemStyle:{
normal:{
color:'red',
borderColor:'red' //拐点边框颜色
}
},
data:[220, 182, 191, 234, 290, 330, 310,220, 182, 191, 234, 290, 330, 310]
},
{
name:'先锋策略三',
type:'line',
symbolSize:4,
color:['orange'],
smooth:false, //关键点,为true是不支持虚线的,实线就用true
itemStyle:{
normal:{
lineStyle:{
width:2,
type:'dotted' //'dotted'虚线 'solid'实线
}
}
},
data:[500, 232, 201, 154, 190, 330, 410,150, 232, 201, 154, 190, 330, 410]
},
{
name:'先锋策略四',
type:'line',
symbolSize:4,
color:['blue'],
itemStyle:{
normal:{
lineStyle:{
width:2,
type:'dotted' //'dotted'虚线 'solid'实线
}
}
},
data:[300, 232, 201, 154, 190, 330, 410,150, 232, 201, 154, 190, 330, 410]
},
{
name:'先锋策略五',
type:'line',
color:['green'],
symbol:'circle',
symbolSize:4,
data:[310, 352, 280, 334, 373, 310, 340,300, 350, 280, 350, 340, 370, 310],
itemStyle:{
normal:{
color:'green',
borderColor:'green'
}
}
}
]
};
myChart.setOption(option);
</script>


 1万+
1万+

 被折叠的 条评论
为什么被折叠?
被折叠的 条评论
为什么被折叠?
 到【灌水乐园】发言


