


 本文介绍如何使用Chart.js插件及JavaScript实现24小时内不同类型的告警趋势图绘制,包括获取后台数据、数据处理及图表配置等关键步骤。
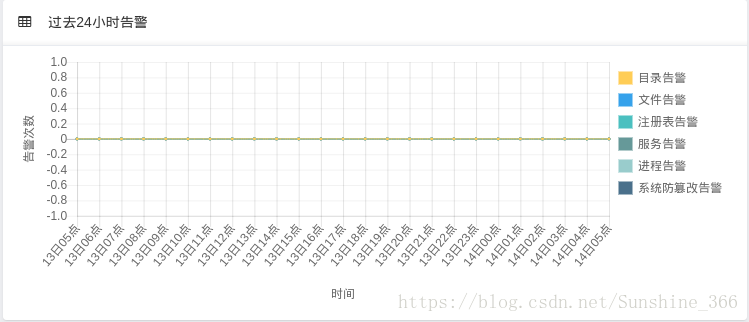
1. 使用插件 Chart.js 下载地址:https://github.com/chartjs/Chart.js/blob/master/LICENSE.md
2. JS实现(需要根据后台数据进行解析)
$.ajax({
        type: "POST",
        cache: false,
        dataType: "json",
        url: g_pageName,
        data: {"code": "OPHS_24h_Bl_stat"},
        success: function (data) {
            var json = eval(data); //数组
            // 生成表格数据
            function randomBar(date, y1) {
                return {
                    t: date.valueOf(),
                    y: y1
                };
            }
            var dateFormat = 'YYYY-MM-DD HH:mm:ss';
            var date = moment(json[0][0], dateFormat);
            var likesd = [randomBar(date, json[1][0])];
            var likesf = [randomBar(date, json[2][0])];
            var likesr = [randomBar(date, json[3][0])];
            var likess = [randomBar(date, json[4][0])];
            var likesp = [randomBar(date, json[5][0])];
            var likesy = [randomBar(date, json[6][0])];
            var labels = [date];
            for(var j=1; j<json[0].length-1; j++) {
                date = date.clone().add(1, 'hour');
                likesd.push(randomBar(date, json[1][j]));
                likesf.push(randomBar(date, json[2][j]));
                likesr.push(randomBar(date, json[3][j]));
                likess.push(randomBar(date, json[4][j]));
                likesp.push(randomBar(date, json[5][j]));
                likesy.push(randomBar(date, json[6][j]));
                labels.push(date);
            }

            var cfg = {
                labels: labels,
                type: 'line',
                datasets: [{
                    label: '目录告警',
                    data: likesd,
                    type: 'line',
                    borderColor: window.chartColors.yellow,
                    backgroundColor: window.chartColors.yellow,
                    pointRadius: 1,
                    fill: false,
                    lineTension: 0.5,
                    borderWidth: 1

                }, {
                    label: '文件告警',
                    data: likesf,
                    type: 'line',
                    borderColor: window.chartColors.blue,
                    backgroundColor: window.chartColors.blue,
                    pointRadius: 1,
                    fill: false,
                    lineTension: 0.5,
                    borderWidth: 1
                }, {
                    label: '注册表告警',
                    data: likesr,
                    type: 'line',
                    borderColor: window.chartColors.green,
                    backgroundColor: window.chartColors.green,
                    pointRadius: 1,
                    fill: false,
                    lineTension: 0.5,
                    borderWidth: 1
                }, {
                    label: '服务告警',
                    data: likess,
                    type: 'line',
                    borderColor: '#669999',
                    backgroundColor: '#669999',
                    pointRadius: 1,
                    fill: false,
                    lineTension: 0.5,
                    borderWidth: 1
                }, {
                    label: '进程告警',
                    data: likesp,
                    type: 'line',
                    borderColor: '#99cccc',
                    backgroundColor: '#99cccc',
                    pointRadius: 1,
                    fill: false,
                    lineTension: 0.5,
                    borderWidth: 1
                }, {
                    label: '系统防篡改告警',
                    data: likesy,
                    type: 'line',
                    borderColor: '#4A708B',
                    backgroundColor: '#4A708B',
                    pointRadius: 1,
                    fill: false,
                    lineTension: 0.5,
                    borderWidth: 1
                }]
            };
            // var chart = new Chart(ctx, cfg);
            var ctx = document.getElementById('doChart1').getContext('2d');
            ctx.canvas.width = 1000;
            ctx.canvas.height = 350;
            window.myLine = Chart.Line(ctx, {
                data: cfg,
                options: {
                    animation: false,
                    responsive: true,
                    hoverMode: 'index',
                    stacked: false,
                    legend: {
                        display: true,
                        position: 'right',
                        labels: {
                            boxWidth: 13,
                        }
                    },
                    /*title: {
                        display: true,
                        text: '过去24小时告警'
                    },*/
                    scales: {
                        xAxes: [{
                            scaleLabel: {
                                display: true,
                                labelString: '时间'
                            },
                            type: 'time',
                            time: {
                                displayFormats: {
                                    minute: 'DD'+'日'+'HH'+'点',
                                },
                                tooltipFormat: 'YYYY'+'年'+'MM'+'月'+'DD'+'日'+'HH'+'点',
                            },
                            distribution: 'series',
                            ticks: {
                                source: 'labels'
                            }
                        }],
                        yAxes: [{
                            scaleLabel: {
                                display: true,
                                labelString: '告警次数'
                            },
                            type: 'linear', //only linear but allow scale type registration. This allows extensions to exist solely for log scale for instance
                            display: true,
                            gridLines: {
                                opacity: 0.5,
                                lineWidth: 0.5
                            },
                        }],
                    }
                }
            });

        },
        error: function(xhr, errmsg, err) {
            console.log(xhr.status + ": " + xhr.responseText);
        }
    });


 299
299

 被折叠的 条评论
为什么被折叠?
被折叠的 条评论
为什么被折叠?
 到【灌水乐园】发言


