


 本文介绍如何从CSV文件读取数据,利用igraph库将数据转换为网络边,并应用FR算法进行图布局,最终绘制出直观的图结构。
import igraph
from igraph import Graph as ig
import csv
edges = []
firstLine = True
# 读取文件
with open('storm_copy.csv', 'r') as df:
    for row in csv.reader(df.read().splitlines()):
        if firstLine == True:
            firstLine = False
            continue
        u, v, weight = [i for i in row]
# 添加网络边和权重
        edges.append((u, v, int(weight)))
print(edges)
# 使用FR算法绘图
g = ig.TupleList(edges, directed=True, vertex_name_attr='name', edge_attrs=None, weights=True)
layout = g.layout('fr')
igraph.plot(g, layout=layout)
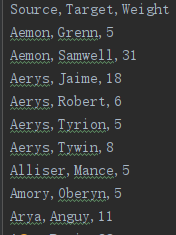
使用的csv文件数据是这样的:
edges[]中的数据是这样的:

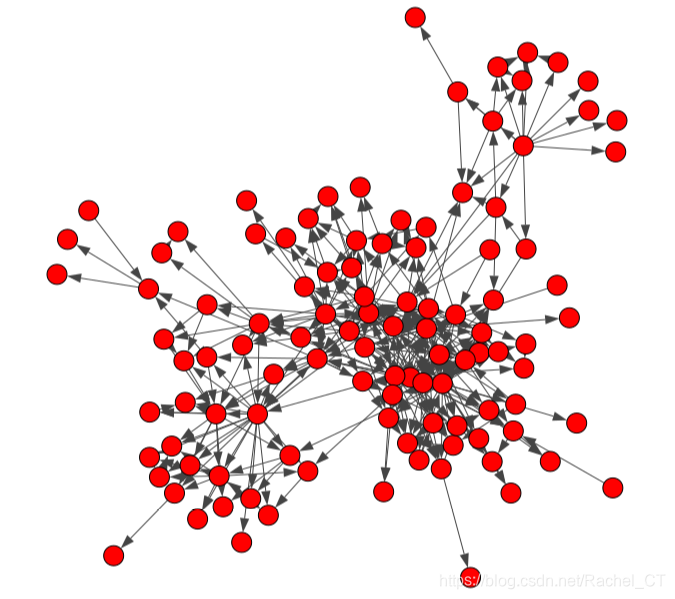
经过FR算法后得到的图布局效果如下:


 3400
3400

 被折叠的 条评论
为什么被折叠?
被折叠的 条评论
为什么被折叠?
 到【灌水乐园】发言


