


1:import echarts from "echarts";
2:
function renderItem(params, api) {
var categoryIndex = api.value(0);
var start = api.coord([api.value(1), categoryIndex]);
var end = api.coord([api.value(2), categoryIndex]);
var height = api.size([0, 1])[1] * 0.6;
var rectShape = echarts.graphic.clipRectByRect(
{
x: start[0],
y: start[1] - height / 2,
width: end[0] - start[0],
height: height,
},
{
x: params.coordSys.x,
y: params.coordSys.y,
width: params.coordSys.width,
height: params.coordSys.height,
}
);
return (
rectShape && {
type: "rect",
transition: ["shape"],
shape: rectShape,
style: api.style(),
}
);
}
3:option{
xAxis:{
//如果是具体的年月日加个type:"time",如果是数字去掉就行
type:"time",
},
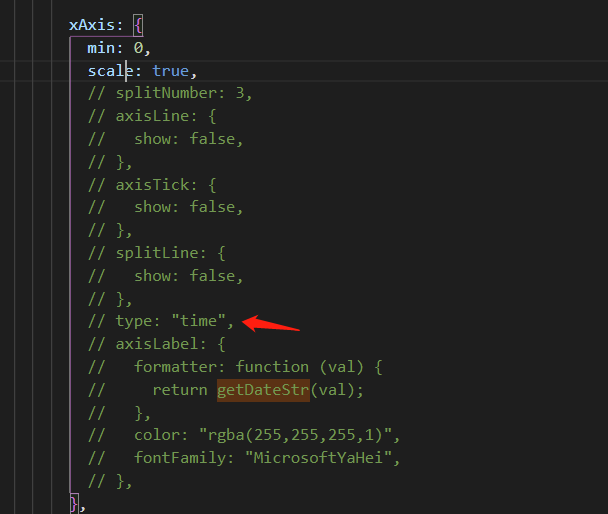
}
4:赋值(仅供参考)
data.push({
name: "想要展示的名字",
value: [1, item.startTime, item.endTime, item.intervalTime], //第一个值是要展示的上下级别 ,第二个开始的值,第三个结束的值,第四个鼠标移入上展示的值
itemStyle: {
normal: {
color: item.status ? "#E6A23C" : "#67C23A",/展示的颜色
},
},
});


 1424
1424

 被折叠的 条评论
为什么被折叠?
被折叠的 条评论
为什么被折叠?
 到【灌水乐园】发言


