


 这篇博客详细记录了Echarts的各种API用法,包括Slient、legend、rich、formatter等,还提供了丰富的示例,如折线图、柱形图、饼图和仪表盘的绘制技巧,如柱状图顶部显示数字、轴文字倾斜、自定义tooltips等,同时也探讨了在Echarts多图表布局时的适配问题和解决办法。
API
Slient
当设置slient为true时,echarts就不再会调用相应事件也就是tooltips不会触发
legend
    color: [ // 设置颜色可以让legend和line的颜色保持此颜色顺序
        '#4F70D9',
        '#538DFC',
        '#7585A2',
        '#F7C739',
        '#FF8769',
        '#26D9FF'
    ],
    legend: {
        data: [],
        show: true,
        icon: 'circle',
        inactiveColor: 'rgba(255,255,255,0.1)', // 设置不选中时的颜色
        orient: 'vertical',
        formatter: (params) => {
            let target, percentage
            for (let i = 0; i < this.pieChart.seriesData.length; i++) {
                if (this.pieChart.seriesData[i].name === params) {
                    target = this.pieChart.seriesData[i].value | 0
                    percentage = this.pieChart.seriesData[i].percentage
                }
            }
            // 自定义图例内容
            return `{a|${params}}{b|${target}}{c|${percentage}}`
        },
        left: 500,
        top: 80,
        itemWidth: 12,
        itemGap: 18,
        width: 500,
        height: 160,
        textStyle: {
            fontSize: 14,
            rich: {
                a: {
                    borderWidth: 1,
                    borderColor: 'black',
                    width: 100
                },
                b: {
                    width: 70
                },
                c: {
                    width: 70
                }
            }
        }
    }

rich
axisLabel: {
    formatter: (value, index) => {
    const length = this.waterQualityData.data.length;
    if (index !== length - 1 || value.length <= 6 || length === 1) return value;
             return `{a|${value}}`;
         },
         textStyle: {
             rich: { // rich不能设置绝对定位
                 a: {
                     align: 'left',
                     width: 150
                 }
             }
         }
     },
formatter
formatter: (value, index) => {} 两个回调参数 值和索引
formatter: function(param) {
     param = param[0];
     let color = 'red';
     let span = `<span
		style='display:inline-block;margin-right:5px;border-radius:50%;width:10px;height:10px;background-color:${color};'></span>`;
		return [param.seriesName + ' ', param.marker + param.name + ':' + (param.value || '--') + 'mg/L', span + '水质等级:' + (findLevelInfo(that.waterQualityData [param.dataIndex]).name || '--') + '类'].join('<br/>');
}
Line的itemStyle
设置直线拐点小球的样式
Echarts多个图表时使用flex控制图表自适应失效问题
会出现拖拽页面明明监听了变化就调用reseve方法自适应图表但是会发现div不会变化,后来发现原来是flex失效了,所以只需要强行设置flex子的宽度/width: 25%;/
就可以了
.welbody {
  height: 100%;
  width: 100%;
  display: flex;
  justify-content: center;
  align-items: center;
}
.bodyleft,
.bodyright {
  flex: 1;
  height: 100%;
  width: 25%;
  /* width: 22%;
  min-width: 22%;
  max-width: 22%; */
}
.bodymid {
  position: relative;
  flex: 2;
  width: 50%;
  height: 100%;
}
文字倾斜柱形折线
仪表盘
仪表盘 4.7echarts版本不能支持进度条 只能颜色叠加
axisLine: {
	lineStyle: {
		color: [
			[44 / 100, '#468EFD'],
			[1, '#111F42']
		],
		width: 8
	}
}
Echart图表绘制报错问题
在this.charts = echarts.init(this.$refs.gaugemid);
获取页面dom时,有时会在页面dom渲染结束之前就调用此方法并往下输入配置信息,从而发生报错所以一般需要在绘制ecahrts方法外用nextTick调用
echarts 柱状图 柱顶部显示数字

轴文字倾斜
xAxis: [
    {
        axisLabel: {
            rotate: 40
        },
    }
],
柱形顶部文字
series: [
        {
            itemStyle: {
                normal: {
                    label: {
                        show: true,
                        position: 'top'
                    }
                }
            }
        }
    ]
自定义tooltips位置
tooltip: {
    // trigger: 'axis',
    trigger: 'axis',
    position: function (point, params, dom) {
         let width = dom.clientWidth;
         return [point[0] > 190 ? point[0] - width : point[0],
-150];
     }
}
柱形图tooltips的小球图标
formatter: function(params){
	return params.marker
}
自定义tooltips内dom
formatter: function(params) {
     let str
     str = `
<div style="min-width:80px">
    <div>${params[0].seriesName}</div>
    <div style="display:flex;height:20px;align-items:center;">
        <div style="width:8px;height:8px;margin-right:8px;background:${params[0].color};border-radius:6px;">
        </div>
        <div>${params[0].value}${unit}</div>
    </div>
</div>`
     return str
例子
折线图
分段颜色+拐点全显示+断线连接

{
    title: {
        text: '',
        left: '0',
        textStyle: {
            color: 'rgba(255,255,255,0.5)',
            fontSize: 12,
            fontFamily: 'TRENDS'
        }
    },
    tooltip: {
        trigger: 'axis',
        axisPointer: {
            type: 'line'
        }
    },
    grid: {
        top: 30,
        left: 40,
        right: 10,
        bottom: 30
    },
    xAxis: [
        {
            type: 'category',
            data: ['2021-10', '2021-11', '2021-12', '2022-01', '2022-02', '2022-03', '2022-04', '2022-05', '2022-06', '2022-07', '2022-08', '2022-09', '2022-10'],
            axisLine: {
                show: false
            },
            axisLabel: {
                textStyle: {
                    fontFamily: 'TRENDS',
                    fontSize: '12',
                    color: 'rgba(255,255,255,0.5)'
                }
            },
            axisTick: {
                show: false
            }
        }
    ],
    yAxis: [
        {
            type: 'value',
            name: '',
            axisLabel: {
                textStyle: {
                    fontFamily: 'TRENDS',
                    fontSize: 12,
                    color: 'rgba(255, 255, 255, 0.5)'
                }
            },
            axisLine: {
                show: false
            },
            splitArea: {
                show: false
            },
            splitLine: { // 值分割线
                show: true,
                lineStyle: {
                    color: 'rgba(255, 255, 255, 0.2)'
                }
            },
            axisTick: {
                show: false
            }
        }
    ],
    visualMap: { // 分段显示逻辑
        top: 50,
        right: 10,
        show: false,
        seriesIndex: 0,
        pieces: [
            {
                min: 0.050000000000000044,
                max: 1,
                color: '#03A9F4'
            },
            {
                min: 1.05,
                max: 2,
                color: '#1976D2'
            },
            {
                min: 2.05,
                max: 3,
                color: '#85C940'
            },
            {
                min: 3.05,
                max: 4,
                color: '#D9CD4C'
            },
            {
                min: 4.05,
                max: 5,
                color: '#EF8E00'
            },
            {
                min: 5.05,
                max: 6,
                color: '#E12214'
            }
        ],
        outOfRange: {
            color: '#999'
        }
    },
    series: {
        name: '水质类别',
        type: 'line',
        symbol: 'circle',
        symbolSize: 8, // 拐点大小 none 代表不显示
        connectNulls: true, // 断线连接
        showAllSymbol: true, // 显示所有拐点
        smooth: true,
        data: [null, null, null, null, 5, 3, 6, 4, 5, 4, 5, null, null],
        markLine: {
            data: [
                {
                    yAxis: 4,
                    name: '目标线',
                    symbol: 'none',
                    label: {
                        show: true,
                        formatter: '{b}',
                        position: 'end',
                        distance: -35,
                        fontSize: 12,
                        lineHeight: 15,
                        padding: [2, 6, 0, 6],
                        color: '#FFFFFF',
                        backgroundColor: '#F84439',
                        borderRadius: 8
                    },
                    lineStyle: {
                        type: 'solid',
                        color: '#F84439',
                        width: 2
                    }
                }
            ]
        }
    }
}
自定义y轴和拐点

const xData = ['水','煤','电','其他']
const yData = [6000,2000,1000,1000]
const option = {
    tooltip: {
        trigger: 'axis',
        axisPointer: {
            // 坐标轴指示器,坐标轴触发有效
            type: 'shadow' // 默认为直线,可选为:'line' | 'shadow'
        },
        formatter(params: any) {
            const str
                        = `<div><div>${params[0].axisValue}</div><div style='display:
                        flex;height:20px;align-items:center;'>${params[0].marker}
                        <div>${params[0].data}${params[0].seriesName}</div></div>`
            return str
        }
    },
    title: {
        text: '实际碳排放总量',
        top: 8,
        padding: [0, 0, 0, 18],
        textStyle: {
            color: 'rgba(255,255,255,1)',
            fontWeight: 700,
            fontSize: 14
        }
    },
    color: ['#e7dd17'],
    grid: {
        top: '60',
        left: '50',
        bottom: '30',
        right: '20'
    },
    xAxis: [
        {
            type: 'category',
            axisTick: {
                show: false
            },
            axisLabel: {
                color: '#ffffff',
                fontSize: 14,
                interval: 0
            },
            axisLine: {
                lineStyle: {
                    color: '#038b8f'
                }
            },
            data: xData
        }
    ],
    yAxis: [
        {
            name: '单位:(t)',
            max: 10000,
            nameTextStyle: {
                color: 'rgba(255,255,255,.6)',
                nameLocation: 'start',
                padding: [5, 0, 0, 0]
            },
            axisLine: {
                show: false
            },
            axisTick: {
                show: false
            },
            splitLine: {
                show: false
            },
            splitArea: {
                show: true,
                areaStyle: {
                    color: ['rgba(3,139,143,0.1)', 'rgba(255,255,255,0)']
                },
                interval: 1
            },
            axisLabel: {
                color: 'rgba(255,255,255,0.6)',
                fontFamily: 'Bebas Neue',
                fontSize: 12,
                formatter: (value: number) => {
                    return `${(value / 1000).toFixed(2)}k`
                }
            }
        }
    ],
    series: [
        {
            name: 't',
            type: 'line',
            // symbol: 'circle',     //设定拐点为实心点
            symbolSize: 8,   // 设定拐点的大小
            data: yData,
        }
    ]
}
多条折线拖动图

option = {
    dataZoom: [
        {
            backgroundColor: '#021e2d',
            borderColor: '#021e2d',
            dataBackground: {
                areaStyle: {
                    opacity: 0,
                },
                lineStyle: {
                    color: '#03d5fb',
                },
            },
            end: 100,
            fillerColor: 'rgba(255, 255, 255, 0.1)',
            height: 24,
            moveHandleStyle: { opacity: 0 },
            realtime: true,
            selectedDataBackground: {
                areaStyle: { opacity: 0 },
                lineStyle: { color: '#03d5fb' },
            },
            show: true,
            start: 70,
            textStyle: {
                color: 'rgba(255,255,255,0.5)',
                fontFamily: 'Bebas Neue',
            },
            top: '87%',
            type: 'slider',
            // xAxisIndex: [0, 1],
        },
    ],
    tooltip: {
        link: { xAxisIndex: 'all' },
        trigger: 'axis',
    },
    legend: {
        top: 220,
        left: 'center',
        textStyle: {
            fontSize: 14,
            color: '#ffffff'
        }
    },
    grid: {
        top: 50,
        left: 60,
        right: 32,
        bottom: 100
    },
    xAxis: {
        axisLabel: {
            show: true,
            fontFamily: 'Bebas Neue',
            fontSize: 12,
            color: 'rgba(255,255,255,.6)'
        },
        axisLine: {
            show: true,
            lineStyle: {
                color: 'rgba(255,255,255,0.2)',
            },
        },
        axisTick: { show: false },
        data: ['2015-01','2015-02','2015-03','2015-04','2015-05','2015-06','2015-07','2015-08','2015-09',
            '2015-10','2015-11','2015-12','2016-01','2016-02','2016-03','2016-04','2016-05','2016-06',
            '2016-07','2016-08','2016-09','2016-10','2016-11','2016-12','2017-01','2017-02','2017-03',
            '2017-04','2017-05','2017-06','2017-07','2017-08','2017-09','2017-10','2017-11','2017-12',
            '2018-01','2018-02','2018-03','2018-04','2018-05','2018-06','2018-07','2018-08','2018-09',
            '2018-10','2018-11','2018-12','2019-01','2019-02','2019-03','2019-04','2019-05','2019-06',
            '2019-07','2019-08','2019-09','2019-10','2019-11','2019-12','2020-01','2020-02','2020-03',
            '2020-04','2020-05','2020-06','2020-07','2020-08','2020-09','2020-10','2020-11','2020-12',
            '2021-01','2021-02','2021-03','2021-04','2021-05','2021-06','2021-07','2021-08','2021-09','2021-10','2021-11','2021-12','2022-01'],
        gridIndex: 0,
        type: 'category',
    },
    yAxis: {
        name: '单位:(t)',
        nameTextStyle: {
            color: 'rgba(255,255,255,.6)',
            nameLocation: 'start',
            padding: [5, 0, 0, 0],
        },
        axisLabel: {
            color: 'rgba(255,255,255,0.6)',
            fontFamily: 'Bebas Neue',
            fontSize: 12,
            formatter: (value: number) => {
                return (value / 1000).toFixed(2) + 'k'
            },
        },
        axisLine: {
            show: false,
            lineStyle: { color: 'rgba(255,255,255,0.5)' },
        },
        axisTick: { show: false },
        gridIndex: 0,
        splitArea: { show: true, areaStyle: { color: ['rgba(3, 139, 143, 0.1)', 'rgba(0, 0, 0, 0)'] } },
        splitLine: { show: false },
        type: 'value',
    },
    color: ['#03d5fb','#ffd902','#00c164','#8c2194','#6dc8ec','#e86452','#479292'],
    series: [
        {
            data: [182.43, 331.93, 280.81, 306.58, 175.65, 255.62, 296.47,
                200.29, 328.7, 362.27, 262.62, 207.44, 293.15, 228.11, 255.78, 201.57,
                343.41, 501.33,498.48, 245.99, 286.61, 376.92, 326.08, 247.09, 482.85,
                423.43, 505.87, 266.3, 403.53, 309.25, 424.08, 261.61, 272.59, 371.21,
                398.12, 396.44,247.97, 422.56, 386.74, 301.53, 619.63, 327.24, 437.38,
                396.34, 437.26, 509.46, 480.18, 364.14, 295.89, 454.31, 446.57, 430.51,
                409.9, 307.79,637.78, 550.48, 525.59, 741.72, 743.59, 1373.45, 705.16,
                564.36, 313.02, 520.78, 321.25, 414.22, 968.89, 988.12, 591.68, 924.52,
                298.81, 975.16,442.93, 378.51, 450.52, 439.35, 466.52, 431.31, 568.86,
                495.26, 453.81, 320.52, 373.43, 294.15, 488.52],
            // itemStyle: {
            //     normal: {
            //         borderColor: '#03d5fb',
            //         color: '#fff',
            //         lineStyle: { color: '#03d5fb' },
            //     },
            // },
            name: '电',
            symbol: 'circle',
            symbolSize: 6,
            type: 'line',
        },
        {
            data: [182.43, 331.93, 280.81, 306.58, 175.65, 255.62, 296.47,
                200.29, 328.7, 362.27, 262.62, 207.44, 293.15, 228.11, 255.78, 201.57,
                343.41, 501.33,498.48, 245.99, 286.61, 376.92, 326.08, 247.09, 482.85,
                423.43, 505.87, 266.3, 403.53, 309.25, 424.08, 261.61, 272.59, 371.21,
                398.12, 396.44,247.97, 442.56, 386.74, 301.53, 161.63, 327.24, 437.38,
                396.34, 437.26, 509.46, 480.18, 364.14, 295.89, 454.31, 446.57, 430.51,
                409.9, 307.79,637.78, 550.48, 525.59, 741.72, 743.59, 373.45, 705.16,
                564.36, 313.02, 320.78, 321.25, 414.22, 968.89, 988.12, 591.68, 924.52,
                298.81, 975.16,442.93, 378.51, 250.52, 439.35, 466.52, 431.31, 568.86,
                495.26, 453.81, 320.52, 373.43, 294.15, 488.52],
            name: '气',
            symbol: 'circle',
            symbolSize: 6,
            type: 'line',
        },
    ]
}
自定义legend

const xData = ["09.26 10:00","09.26 10:20","09.26 10:40","09.26 11:00","09.26 11:20","09.26 11:40","09.26 12:40","09.26 13:00","09.26 13:20","09.26 13:40","09.26 14:00","09.26 14:20","09.26 14:40","09.26 15:00","09.26 15:20","09.26 15:40","09.26 16:00","09.26 16:20","09.26 16:40","09.26 17:00","09.26 17:20","09.26 12:00","09.26 12:20"]
const yData = [0.02,0.04,0.12,0.1,0.1,0.09,0.12,0.15,0.25,0.3,0.46,0.2,0.3,0.5,0.8,0.6,0.8,0.5,0.5,0.8,2,2,2.1]
const option = {
    tooltip: {
        trigger: 'axis',
        axisPointer: {
            // 坐标轴指示器,坐标轴触发有效
            type: 'shadow' // 默认为直线,可选为:'line' | 'shadow'
        },
        formatter(params: any) {
            const str = `<div><div>${params[0].seriesName}</div><div
            style='display:
            flex;height:20px;align-items:center;'>${params[0].marker}
            <div>${params[0].axisValue}:${params[0].data}mm</div></div>`
            return str
        }
    },
    title: {
        text: '化学需氧量 过去24小时趋势变化',
        left: 'center',
        textStyle: {
            color: 'white',
            fontFamily: 'TRENDS',
            fontSize: 12
        }
    },
    color: ['#00DDFF'],
    grid: {
        top: '50',
        left: '30',
        bottom: '35',
        right: '10'
    },
    xAxis: [
        {
            type: 'category',
            axisTick: {
                show: false
            },
            axisLabel: {
                color: '#ffffff',
                fontSize: 12,
                // interval: 0, // 强制显示所有x轴标签
                fontFamily: 'TRENDS'
            },
            axisLine: {
                lineStyle: {
                    color: '#038b8f'
                }
            },
            data: xData
        }
    ],
    yAxis: [
        {
            name: 'mm',
            nameTextStyle: {
                fontFamily: 'TRENDS',
                color: 'rgba(255, 255, 255, 0.6)',
                fontSize: '12px',
                align: 'center'
            },
            axisLine: {
                show: false
            },
            axisTick: {
                show: false
            },
            splitLine: {
                // x轴竖线
                lineStyle: {
                    color: 'rgba(255, 255, 255, 0.15)'
                    // type: 'dashed',
                },
            },
            axisLabel: {
                color: 'rgba(255,255,255,0.7)',
                fontFamily: 'TRENDS',
                fontSize: 12,
            }
        }
    ],
    series: [
        {
            name: '化学需氧量',
            type: 'line',
            // smooth: true, // 折线平滑
            data: yData,
            symbolSize: 'none', // 设定拐点的大小
            lineStyle: {
                // 设置折线颜色
                color: '#00DDFF'
            },
            areaStyle: {
                // 阴影颜色渐变
                normal: {
                    color: {
                        x: 0,
                        y: 0,
                        x2: 0,
                        y2: 1,
                        colorStops: [
                            {
                                offset: 0,
                                color: 'rgba(0, 221, 255, 0.7)' // 100% 处的颜色
                            },
                            {
                                offset: 1,
                                color: 'rgba(0, 221, 255, 0)' // 0% 处的颜色
                            }
                        ],
                        globalCoord: false, // 缺省为 false
                    }
                }
            },
            markLine: {
                symbol: 'none', // 去掉箭头
                data: [
                    {
                        yAxis: 0.5,
                        name: '标准值',
                        symbol: 'none',
                        label: {
                            show: true,
                            formatter: '{b}',
                            position: 'middle',
                            distance: -8,
                            fontSize: 12,
                            lineHeight: 15,
                            padding: [2, 6, 0, 6],
                            color: '#FFFFFF',
                            backgroundColor: '#F84439',
                            borderRadius: 8
                        },
                        lineStyle: {
                            type: 'solid',
                            color: '#F84439',
                            width: 2
                        }
                    },
                ]
            }
        }
    ]
}
区域阴影,分割线虚线

const xAxisData = ['1月', '2月', '3月', '4月', '5月', '6月']
const seriesData = [20, 30, 45, 50, 60, 80]
const lineChart = {
    grid: {
        top: 30,
        bottom: 0,
        right: 0
    },
    legend: {
        show: false,
    },
    tooltip: {
        trigger: 'axis',
        // 设置显示的文字内容
        formatter: (args: any) => {
            return args[0].name + ':' + args[0].value + '万元'
        }
    },
    backgroundColor: 'rgba(23, 31, 39, 1)', // 设置echarts图背景色
    yAxis: {
        splitLine: {
            // 设置y轴分割线为虚线
            lineStyle: {
                type: 'dashed', // y轴分割线类型 虚线
                color: 'rgb(61, 76, 83)'
            }
        },
        axisLine: {
            // 不显示y轴线
            show: false
        },
        // 不显示y轴的小刻度
        axisTick: {
            // 不显示y轴小刻度线
            show: false
        },
        // 把刻度标签里面的文字颜色设置为黑色
        axisLabel: {
            // y轴文本白色
            color: 'white'
        }
    },
    xAxis: {
        data: xAxisData,
        axisLine: {
            lineStyle: {
                color: 'rgb(61, 76, 83)'
            }
        },
        // 不显示y轴的小刻度
        axisTick: {
            show: false
        },
        // 把刻度标签里面的文字颜色设置为黑色
        axisLabel: {
            color: 'white'
        }
    },
    series: [
        {
            name: '张三',
            data: seriesData,
            lineStyle: {
                // 设置折线颜色
                color: 'rgba(12, 170, 174,1)'
            },
            areaStyle: {
                // 阴影颜色渐变
                normal: {
                    color: {
                        x: 0,
                        y: 0,
                        x2: 0,
                        y2: 1,
                        colorStops: [
                            {
                                offset: 0,
                                color: 'rgba(12, 170, 174,0.8)' // 100% 处的颜色
                            },
                            {
                                offset: 1,
                                color: 'rgba(12, 170, 174,0)' // 0% 处的颜色
                            }
                        ],
                        globalCoord: false, // 缺省为 false
                    }
                }
            }
        }
    ]
}
平滑折线阴影+markline

const xData = ['五常', '仁和', '良渚', '闲林', '仓前', '余杭', '百丈']
const yData = [7.66, 6, 2.44, 8, 5, 8.66, 7]
const option = {
    tooltip: {
        trigger: 'axis',
        axisPointer: {
            // 坐标轴指示器,坐标轴触发有效
            type: 'shadow' // 默认为直线,可选为:'line' | 'shadow'
        },
        formatter(params: any) {
            const str = `<div><div>${params[0].axisValue}</div><div
            style='display:
            flex;height:20px;align-items:center;'>${params[0].marker}
            <div>${params[0].data}${params[0].seriesName}</div></div>`
            return str
        }
    },
    color: ['#03d5fb'],
    grid: {
        top: '16',
        left: '30',
        bottom: '30',
        right: '10'
    },
    xAxis: [
        {
            type: 'category',
            axisTick: {
                show: false
            },
            axisLabel: {
                color: '#ffffff',
                fontSize: 14,
                interval: 0,
                fontFamily: 'TRENDS'
            },
            axisLine: {
                lineStyle: {
                    color: '#038b8f'
                }
            },
            data: xData
        }
    ],
    yAxis: [
        {
            axisLine: {
                show: false
            },
            axisTick: {
                show: false
            },
            splitLine: {
                // x轴竖线
                lineStyle: {
                    color: 'rgba(255,255,255,.2)'
                    // type: 'dashed',
                },
            },
            axisLabel: {
                color: 'rgba(255,255,255,0.5)',
                fontFamily: 'TRENDS',
                fontSize: 12,
            }
        }
    ],
    series: [
        {
            name: 'mm',
            type: 'line',
            smooth: true, // 折线平滑
            connectNulls: true, // 断线连接
            barWidth: 13,
            data: yData,
            symbolSize: 'none', // 设定拐点的大小
            itemStyle: {
                show: false
            },
            lineStyle: {
                // 设置折线颜色
                color: '#00DDFF'
            },
            areaStyle: {
                // 阴影颜色渐变
                normal: {
                    color: {
                        x: 0,
                        y: 0,
                        x2: 0,
                        y2: 1,
                        colorStops: [
                            {
                                offset: 0,
                                color: 'rgba(0, 221, 255, 0.7)' // 100% 处的颜色
                            },
                            {
                                offset: 1,
                                color: 'rgba(0, 221, 255, 0)' // 0% 处的颜色
                            }
                        ],
                        globalCoord: false, // 缺省为 false
                    }
                }
            },
            markLine: {
                symbol: 'none', // 去掉箭头
                data: [
                    {
                        yAxis: 5.66,
                        name: '5.66m',
                        label: {
                            show: true,
                            formatter: '{b}',
                            position: 'insideEndBottom',
                            // distance: -35,
                            fontSize: 12,
                            lineHeight: 15,
                            fontFamily: 'Furore',
                            // padding: [40, 0, 0, 0],
                            color: 'rgba(255, 153, 2, 1)',
                            // borderRadius: 8
                        },
                        lineStyle: {
                            type: 'dashed',
                            color: 'rgba(255, 153, 2, 1)',
                            width: 2
                        }
                    },
                    {
                        yAxis: 6.66,
                        name: '6.66m',
                        label: {
                            show: true,
                            formatter: '{b}',
                            position: 'insideEndTop',
                            fontSize: 12,
                            lineHeight: 15,
                            color: 'rgba(248, 68, 57, 1)',
                            fontFamily: 'Furore'
                        },
                        lineStyle: {
                            type: 'dashed',
                            color: 'rgba(248, 68, 57, 1)',
                            width: 2
                        }
                    },
                    {
                        yAxis: 2,
                        name: '2m',
                        label: {
                            show: false,
                        },
                        lineStyle: {
                            type: 'dashed',
                            color: 'white',
                            width: 2
                        }
                    }
                ]
            }
        }
    ]
}
翻转+区域阴影+自定义legend折线
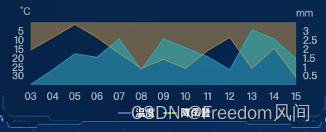
const xAxis = ['2022-08-01 03','2022-08-01 04','2022-08-01 05','2022-08-01 06','2022-08-01 07','2022-08-01 08','2022-08-01 09','2022-08-01 10','2022-08-01 11','2022-08-01 12','2022-08-01 13','2022-08-01 14','2022-08-01 15']
const seriesData = {
    temperature: [15.5, 8.5, 1.2, 8.5, 17.4, 25.8, 20.8, 25.8, 15.8, 8.5, 25.8, 14.6, 30.8],
    rain: [0.02, 0.85, 1.74, 1.55, 2.58, 0.85, 2.58, 2.08, 1.58, 0.85, 3.08, 2.58, 1.46]
}
const option = {
    grid: {
        top: 30,
        right: 32,
        bottom: 50,
        left: 30
    },
    tooltip: {
        trigger: 'axis',
        axisPointer: {
            type: 'line'
        },
        textStyle: {
            color: '#b9cfe2',
            fontFamily: 'PingFang SC'
        },
        formatter: (params: any[]) => {
            let str = `<div>${params[0].axisValue}</div>`
            params.forEach((item: record, index: number) => {
                let unit = ''
                if (index === 0)
                    unit = 'mm'
                else if (index === 1)
                    unit = '°C'
                str += `<div>${item.marker}${item.seriesName}:${item.value
                    ? item.value
                    : '--'}${unit}</div>`
            })
            return str
        }
    },
    legend: {
        show: true,
        bottom: 5,
        inactiveColor: 'rgba(255,255,255,0.5)',
        textStyle: {
            color: 'rgba(255,255,255,1)'
        },
        itemHeight: 2,
        itemWidth: 16,
        data: [
            {
                name: '温度',
                icon: 'rect',
            },
            {
                name: '降雨量',
                icon: 'rect',
            }
        ]
    },
    xAxis: {
        type: 'category',
        boundaryGap: false,
        axisLine: {
            show: false,
            lineStyle: {
                color: 'rgba(255,255,255,0.5)'
            }
        },
        axisLabel: {
            show: true,
            textStyle: {
                fontFamily: 'Bebas Neue',
                fontSize: '12',
                color: 'rgba(255,255,255,0.6)'
            },
            formatter: (value: string) => {
                return value.slice(-2)
            }
        },
        axisTick: {
            show: false
        },
        data: xAxis
    },
    yAxis: [
        {
            type: 'value',
            name: '°C',
            // nameLocation: 'start',
            nameTextStyle: {
                align: 'right',
                padding: [-110, 0, 0, 0]
            },
            axisLabel: {
                formatter: '{value}',
                textStyle: {
                    fontFamily: 'Bebas Neue',
                    fontSize: '12',
                    color: 'rgba(255,255,255,0.6)'
                }
            },
            axisLine: {
                show: false,
                lineStyle: {
                    color: 'rgba(255,255,255,0.5)'
                }
            },
            axisPointer: {
                snap: true
            },
            splitLine: { show: false },
            axisTick: { show: false },
            inverse: true // 折线翻转
        },
        {
            type: 'value',
            name: 'mm',
            nameTextStyle: {
                align: 'left',
                padding: [0, 0, -10, 0]
            },
            axisLabel: {
                formatter: '{value}',
                textStyle: {
                    fontFamily: 'Bebas Neue',
                    fontSize: '12',
                    color: 'rgba(255,255,255,0.6)'
                }
            },
            axisLine: {
                show: false,
                lineStyle: {
                    color: 'rgba(255,255,255,0.5)'
                }
            },
            axisPointer: {
                snap: true
            },
            splitLine: { show: false },
            axisTick: { show: false }
        }
    ],
    series: [
        {
            name: '温度',
            type: 'line',
            showSymbol: false, // 不显示点
            yAxisIndex: 0,
            lineStyle: {
                color: 'rgba(255, 180, 67, 1)',
                opacity: 1,
                width: 0.5
            },
            areaStyle: {
                color: 'rgba(255, 180, 67, .5)'
            },
            data: temperature
        },
        {
            name: '降雨量',
            type: 'line',
            showSymbol: false, // 不显示点
            yAxisIndex: 1,
            areaStyle: {
                color: 'rgba(0, 221, 255, .5)'
            },
            markPoint: {
                show: false,
            },
            lineStyle: {
                color: 'rgba(0, 221, 255, 1)',
                opacity: 1,
                width: 0.5
            },
            data: rain
        }
    ]
}
不同颜色折线图
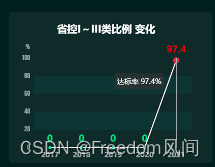
通过设置两个series 叠加的显示和隐藏实现
goodData=[100,100,99,98,95]
targetDate= [100,100,100,100,100]
{
    grid: {
        top: '90',
        left: '50',
        bottom: '30',
        right: '40'
    },
    title: {
        text: title,
        left: 90,
        top: 20,
        textStyle: {
            fontSize: 20,
            color: '#FFFFFF'
        }
    },
    tooltip: {
        trigger: 'axis',
        formatter: arg => {
             return `${arg[0].seriesName}  ${arg[0].value}%`
        }
    },
    xAxis: {
        type: 'category',
        axisTick: {
            show: false
        },
        data: [2017, 2018, 2019, 2020, 2021],
        axisLabel: {
            color: 'rgba(255, 255, 255, 0.6)',
            fontFamily: 'Microsoft YaHei',
            fontSize: 14,
            fontWeight: 'bold'
        },
        axisLine: {
            lineStyle: {
                color: 'rgba(255, 255, 255, 0.2)'
            }
        }
    },
    yAxis: {
        name: '%',
        nameTextStyle: {
            fontFamily: 'Bebas Neue',
            fontSize: 14,
            color: 'rgba(255, 255, 255, 0.6)',
            padding: [0, 25, 0, 0] // 设置位置
        },
        axisLine: {
            show: false
        },
        axisTick: {
            show: false
        },
        splitLine: {
            show: false
        },
        splitArea: { // 背景斑马纹
            show: true,
            areaStyle: {
                color: ['rgba(255,255,255,0)',
'rgba(3,139,143,0.1)']
            },
            interval: 1
        },
        axisLabel: {
            show: true,
            color: 'rgba(255,255,255,0.6)',
            fontFamily: 'Bebas Neue',
            fontSize: 14
        }
    },
    series: [
        {
            name: '达标率',
            type: 'line',
            data: goodData,
            itemStyle: {
                normal: {
                    label: {
                        show: true,
                        formatter: arg => {
                            if (arg.data < targetDate[arg.dataIndex]) return ''
                            return arg.data
                        },
                        textStyle: {
                            fontSize: 18,
                            fontWeight: 'bold',
                            color: '#00e87e'
                        }
                    }
                }
            }
        },
        {
            name: '达标率',
            type: 'line',
            symbol: 'circle',
            symbolSize: 6,
            data: goodData,
            lineStyle: {
                normal: {
                    color: '#ffffff', //折线的颜色
                    width: '2' //折线粗细
                }
            },
            itemStyle: {
                normal: {
                    color: arg => {
                        if (arg.data < targetDate[arg.dataIndex]) return '#E12234'
                        else return '#00e87e'
                    },
                    label: {
                        show: true,
                        formatter: arg => {
                            if (arg.data >= targetDate[arg.dataIndex]) return ''
                            return arg.data
                        },
                        textStyle: {
                            fontSize: 18,
                            color: 'red',
                            fontWeight: 'bold'
                        }
                    }
                }
            }
        }
    ]
}
双标准线折线图
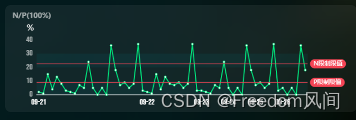
getNPTrentChange() {
        const xData = ['2022-09-21 00:00', '2022-09-21 01:00', '2022-09-21
        02:00', '2022-09-21 03:00', '2022-09-21 04:00', '2022-09-21
        05:00','2022-09-21 06:00', '2022-09-21 07:00', '2022-09-21
        08:00', '2022-09-21 09:00', '2022-09-21 10:00', '2022-09-21
        11:00','2022-09-21 12:00', '2022-09-21 13:00', '2022-09-21
        14:00', '2022-09-21 15:00', '2022-09-21 16:00', '2022-09-21
        17:00','2022-09-21 18:00', '2022-09-21 19:00', '2022-09-21
        20:00', '2022-09-21 21:00', '2022-09-21 22:00', '2022-09-21
        23:00','2022-09-22 00:00', '2022-09-22 01:00', '2022-09-22
        02:00', '2022-09-22 03:00', '2022-09-22 04:00', '2022-09-22
        05:00','2022-09-22 06:00', '2022-09-22 07:00', '2022-09-22
        08:00', '2022-09-22 09:00', '2022-09-22 10:00', '2022-09-22
        11:00','2022-09-23 00:00', '2022-09-23 01:00', '2022-09-23
        02:00', '2022-09-23 03:00', '2022-09-23 04:00', '2022-09-23
        05:00','2022-09-24 00:00', '2022-09-24 01:00', '2022-09-24
        02:00', '2022-09-24 03:00', '2022-09-24 04:00', '2022-09-24
        05:00','2022-09-25 00:00', '2022-09-25 01:00', '2022-09-25
        02:00', '2022-09-25 03:00', '2022-09-25 04:00', '2022-09-25
        05:00','2022-09-26 00:00', '2022-09-26 01:00', '2022-09-26
        02:00', '2022-09-26 03:00', '2022-09-26 04:00', '2022-09-26
        05:00']
            const data = ['2', '1', '15', '4', '13', '8','3', '2', '1', '7', '5', '24','5', '0', '5', '0', '36', '18','7', '9', '5', '8', '37', '3','2', '1', '15', '4', '13', '8','7', '9', '5', '8', '37', '3','3', '2', '1', '7', '5', '24','5', '0', '5', '0', '36', '18','7', '9', '5', '8', '37', '3','5', '0', '5', '0', '36', '18']
            this.initNPTrentChangeChart(xData, data)
        },
initNPTrentChangeChart(xData, data) {
            let option = {
                title: {
                    show: true,
                    text: 'N/P(100%)',
                    textAlign: 'left',
                    left: 10,
                    top: 10,
                    textStyle: {
                        color: 'rgba(255,255,255,0.6)',
                        fontSize: 14
                    }
                },
                tooltip: {
                    trigger: 'axis',
                    axisPointer: {
                        // 坐标轴指示器,坐标轴触发有效
                        type: 'line', // 默认为直线,可选为:'line' | 'shadow'
                    },
                },
                legend: {
                    show: false
                },
                grid: {
                    top: 70,
                    left: '6%',
                    right: '14%',
                    bottom: '5%',
                    containLabel: true,
                },
                xAxis: [
                    {
                        type: 'category',
                        data: xData,
                        axisLine: {
                            show: true,
                            lineStyle: {
                                color: 'rgba(255,255,255,1)',
                            },
                        },
                        axisLabel: {
                            interval:0,
                            textStyle: {
                                fontFamily: 'Bebas Neue',
                                fontSize: '16',
                                fontWeight: 'normal',
                                color: 'rgba(255,255,255,1)',
                            },
                            formatter: params => {
                                if (this.day.indexOf(params) != -1) {
                                    return params.substr(5, 5)
                                }
                            },
                        },
                        axisTick: {
                            show: false,
                            interval: 24,
                        },
                    },
                ],
                yAxis: [
                    {
                        type: 'value',
                        name: '%',
                        nameTextStyle: {
                            color: 'rgba(255,255,255,1)',
                            align: 'center',
                            padding: [0, 25, 0, 0],
                            fontSize: 16
                        },
                        axisLabel: {
                            textStyle: {
                                fontFamily: 'Bebas Neue',
                                fontSize: 16,
                                fontWeight: 'normal',
                                color: 'rgba(255,255,255,0.6)',
                            },
                        },
                        axisLine: {
                            show: false,
                            lineStyle: {
                                color: 'rgba(255,255,255,1)',
                            },
                        },
                        splitArea: {
                            show: true,
                            areaStyle: {
                                color: ['rgba(3, 139, 143, 0.1)', 'transparent'],
                            },
                        },
                        splitLine: { show: false },
                        axisTick: { show: false },
                    },
                ],
                series: [
                    {
                        name: '趋势',
                        type: 'line',
                        data: data,
                        markLine: {
                            symbol: 'none',
                            data: [
                                {
                                    silent: false,
                                    lineStyle: {
                                        type: 'solid',
                                        color: '#f54455'
                                    },
                                    label: {
                                        position: 'end',
                                        formatter: 'P限制限值',
                                        backgroundColor: '#f54455',
                                        color: '#fff',
                                        borderRadius: 20,
                                        padding: [3, 7]
                                    },
                                    yAxis: 9
                                },
                                {
                                    silent: false,
                                    lineStyle: {
                                        type: 'solid',
                                        color: '#f54455'
                                    },
                                    label: {
                                        position: 'end',
                                        formatter: param => {
                                            return `N限制限值`
                                        },
                                        backgroundColor: '#f54455',
                                        color: '#fff',
                                        borderRadius: 20,
                                        padding: [3, 7]
                                    },
                                    yAxis: 22.6
                                },
                            ]
                        },
                        axisLabel: {
                            textStyle: {
                                fontFamily: 'Bebas Neue',
                                fontSize: '16',
                                fontWeight: 'normal',
                            },
                        },
                        lineStyle: {
                            color: '#00e87e',
                        },
                        itemStyle: {
                            color: '#00e87e',
                        },
                        splitLine: { show: false },
                        axisTick: { show: false },
                    }
                ]
            }
            this.NPChart.setOption(option)
}
交易K图

const tooltipParams = {
close: "收盘值"
highest: "最高值"
lowest: "最低值"
open: "开盘值"
}
const options = {
        color:['#f54455', '#e8b025', '#2bfc83', '#3babfc'],
        title: {
            //标题
            show: true,
            text: '元/吨',
            textStyle: {
                color: 'rgba(255, 255, 255, 0.6)',
                fontSize: 14,
                fontWeight: 700,
            },
        },
        tooltip: {
            show: true,
            trigger: 'axis',
            backgroundColor: 'rgba(0, 18, 16, 0.9)',
            borderColor: 'transparent',
            textStyle: {
                color: '#fff',
            },
            confine: true,
            formatter: (params: any) => {
                if (!params.length) return
                const data = params[0]
                const time = `<div><span style="color: #fff">${data.name}</span></div>`
                const kd = data.value
                let itemLabel = ''
                kd.forEach((el: any, index: number) => {
                    if (index > 0) {
                        itemLabel += `<div style=" display: flex;
                        flex-shrink: 0; justify-content: space-between;"><div
                        style="min-width: 80px; margin-right:
                        16px">${tooltipParams[data.dimensionNames[index]]}</div><div
                        style="color: #00fc83">${el || '--'}</div></div>`
                    }
                })
                return `<div style="font-weight: 600; padding-left: 12px;padding-right: 12px">${time}${itemLabel}</div>`
            }
        },
        grid: {
            top: 40,
            left: 30,
            right: 8,
            bottom: 10,
            containLabel: true,
        },
        dataZoom: {
            type: 'inside',
            start: 0,
            end: 100,
        },
        xAxis: {
            type: 'category',
            data: ['2021-07-23', '2021-07-26', '2021-07-27',
                '2021-07-28', '2021-07-29', '2021-07-30', '2021-08-02',
                '2021-08-03', '2021-08-04', '2021-08-05', '2021-08-06',
                '2021-08-09', '2021-08-10', '2021-08-11'],
            axisLine: {
                //x轴线
                show: true,
                lineStyle: {
                    color: 'rgba(255, 255, 255, .2)',
                },
            },
            axisLabel: {
                fontFamily: 'Bebas Neue',
                fontSize: '16',
                color: 'rgba(255,255,255,0.6)',
            },
            min: 'dataMin',
            max: 'dataMax',
            axisTick: {
                //x轴上的刻度线
                show: false,
            }
        },
        yAxis: {
            type: 'value',
            axisLine: {
                show: false
            },
            axisTick: {
                show: false
            },
            splitLine: {
                show: false
            },
            axisPointer: {
                snap: true,
            },
            splitArea: {
                show: true,
                areaStyle: {
                    color: ['rgba(3,139,143,0.1)', 'rgba(255,255,255,0)']
                },
                interval: 1
            },
            axisLabel: {
                color: 'rgba(255,255,255,0.6)',
                fontFamily: 'Bebas Neue',
                fontSize: 12
            },
            splitNumber: 3,
            scale: true
        },
        series: [
            {
                name: 'K线',
                type: 'k',
                itemStyle: {
                    color: 'transparent',
                    color0: 'transparent',
                },
                data: [
                    {
                        itemStyle: {
                        borderColor: "#00fc83"
                        borderColor0: "#f54455"
                    }
                    value: [56.52, 56.97, 55.52, 61.07]
                    },
                    {
                        itemStyle: {
                        borderColor: "#00fc83"
                        borderColor0: "#f54455"
                    }
                    value: [[54.5, 54.46, 53.98, 54.85]]
                    }
                ]
            }
        ]
    }
柱形图
重叠+自定义顶部文字柱形图

const xData = ['国控', '省控', '市控', '县控']
const yData = [
    { value: 120, done: 120, unDone: 0 },
    { value: 110, done: 70, unDone: 40 },
    { value: 80, done: 50, unDone: 30 },
    { value: 75, done: 50, unDone: 25 },
]
const option = {
    tooltip: {
        trigger: 'axis',
        axisPointer: {
            // 坐标轴指示器,坐标轴触发有效
            type: 'shadow' // 默认为直线,可选为:'line' | 'shadow'
        },
        formatter(params: any) {
            console.log(params, 'params')
            const str = `<div><div>${params[0].axisValue}</div>
        <div style='display: flex;height:20px;align-items:center;'>
        <span>
        总共${params[0].data}${params[0].seriesName}:
        </span>
        </div>
        <div style='display: flex;height:20px;align-items:center;'>
        ${params[1].marker}
        <span>
        已处置:${params[1].data}${params[0].seriesName}
        </span>
        </div>
        <div style='display: flex;height:20px;align-items:center;'>
        ${params[0].marker}
        <span>
        未处置:${params[0].data
        - params[1].data}${params[0].seriesName}
        </span>
        </div>`
            return str
        }
    },
    color: ['#F84439', '#36F097'],
    grid: {
        top: '20',
        left: '30',
        bottom: '25',
        right: '10'
    },
    xAxis: [
        {
            type: 'category',
            axisTick: {
                show: false
            },
            axisLabel: {
                color: '#ffffff',
                fontSize: 14,
                interval: 0,
                fontFamily: 'TRENDS'
            },
            axisLine: {
                lineStyle: {
                    color: '#038b8f'
                }
            },
            data: xData
        }
    ],
    yAxis: [
        {
            axisLine: {
                show: false
            },
            axisTick: {
                show: false
            },
            splitLine: {
                show: false
            },
            splitArea: {
                show: true,
                areaStyle: {
                    color: ['transparent', 'rgba(255, 255, 255, 0.05)'],
                },
            },
            axisLabel: {
                color: 'rgba(255,255,255,0.5)',
                fontFamily: 'TRENDS',
                fontSize: 12,
            }
        }
    ],
    series: [
        {
            name: '个',
            type: 'bar',
            barWidth: 25,
            data: yData.map(item => item.value),
            itemStyle: {
                color: '#F84439',
                normal: {
                }
            },
            label: {
                show: true,
                position: 'top',
                color: 'white',
                fontFamily: 'Furore',
                fontSize: 14,
                formatter: (val: any) => {
                    const index = val.dataIndex
                    const currData = yData[index]
                    return `${Math.round(currData.done / currData.value * 1000) / 10}%`
                }
            },
            z: '-1', // 改变这根柱子的层级使这根柱子在下面
        },
        {
            name: '个',
            type: 'bar',
            barWidth: 25,
            data: yData.map(item => item.done),
            itemStyle: {
                color: '#36F097'
            },
            barGap: '-100%', // 移动第二个柱子的位置实现重叠
        }
    ]
}
自定义y轴
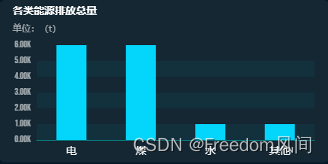
const xData = ['水','煤','电','其他']
const yData = [6000,2000,1000,1000]
option = {
                tooltip: {
                    trigger: 'axis',
                    axisPointer: {
                        // 坐标轴指示器,坐标轴触发有效
                        type: 'shadow' // 默认为直线,可选为:'line' | 'shadow'
                    },
                    formatter: function(params:any) {
                        let str =
                        `<div><div>${params[0].axisValue}</div><div style='display:
                        flex;height:20px;align-items:center;'>${params[0].marker}
                        <div>${params[0].data}${params[0].seriesName}</div></div>`
                        return str
                    }
                },
                title: {
                    text: '各类能源排放总量',
                    top: 8,
                    padding: [0, 0, 0, 18],
                    textStyle: {
                        color: 'rgba(255,255,255,1)',
                        fontWeight: 700,
                        fontSize: 14
                    }
                },
                color: ['#03d5fb'],
                grid: {
                    top: '60',
                    left: '50',
                    bottom: '30',
                    right: '20'
                },
                xAxis: [
                    {
                        type: 'category',
                        axisTick: {
                            show: false
                        },
                        axisLabel: {
                            color: '#ffffff',
                            fontSize: 14,
                            interval: 0
                        },
                        axisLine: {
                            lineStyle: {
                                color: '#038b8f'
                            }
                        },
                        data: xData
                    }
                ],
                yAxis: [
                    {
                        name: "单位:(t)",
                        nameTextStyle: {
                            color: "rgba(255,255,255,.6)",
                            nameLocation: "start",
                            padding:[5,0,0,0]
                        },
                        axisLine: {
                            show: false
                        },
                        axisTick: {
                            show: false
                        },
                        splitLine: {
                            show: false
                        },
                        splitArea: {
                            show: true,
                            areaStyle: {
                                color: ['rgba(3,139,143,0.1)', 'rgba(255,255,255,0)']
                            },
                            interval: 1
                        },
                        axisLabel: {
                            color: 'rgba(255,255,255,0.6)',
                            fontFamily: 'Bebas Neue',
                            fontSize: 12,
                            formatter: (value:number) => {
                                return (value/1000).toFixed(2)+'k'
                            }
                        }
                    }
                ],
                series: [
                    {
                        name: 't',
                        type: 'bar',
                        barWidth: 40,
                        data: yData,
                    }
                ]
            }
分隔线普通柱形图
const option = {
    tooltip: {
        trigger: 'axis',
        axisPointer: {
            type: 'shadow'
        }
    },
    color: [
        '#03d5fb'
    ],
    grid: {
        top: '20',
        left: '30',
        bottom: '35',
        right: '10'
    },
    xAxis: [
        {
            type: 'category',
            axisTick: {
                show: false
            },
            axisLabel: {
                color: '#ffffff',
                fontSize: 14,
                interval: 0,
                fontFamily: 'TRENDS'
            },
            axisLine: {
                lineStyle: {
                    color: '#038b8f'
                }
            },
            data: ['五常', '仁和', '良渚', '闲林', '仓前', '余杭', '百丈']
        }
    ],
    yAxis: [
        {
            axisLine: {
                show: false
            },
            axisTick: {
                show: false
            },
            splitLine: {
                lineStyle: {
                    color: 'rgba(255,255,255,.2)'
                }
            },
            axisLabel: {
                color: 'rgba(255,255,255,0.5)',
                fontFamily: 'TRENDS',
                fontSize: 12
            }
        }
    ],
    series: [
        {
            name: 't',
            type: 'bar',
            barWidth: 13,
            data: [12, 6, 10, 14, 5, 20, 17]
        }
    ]
}
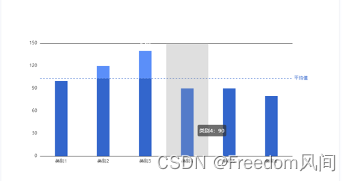
平均值分层显示柱形图
顶部是有数字的就是因为是白色看不出来。通过对 series 设置两组数据并设置相同的stack产生堆叠柱形图,并对上面和下面的柱的数据进行处理且让平均值的线设置为下面数据的最大值即可。在tooltip显示的时候也要修改formatter的值。
<template>
  <base-bar-chart
    ref="barCharts"
    :seriesData="barChart.dataList"
    :xAxisData="barChart.xAxisData"
    :seriesOptions="barChart.seriesOptions"
    :chartOptions="barChart.chartOptions"
    :grid="barChart.grid"
    width="800px"
    height="500px"
  ></base-bar-chart>
</template>
<script>
  export default {
    data() {
      return {
        seriesData: [100, 120, 140, 90, 90, 80],
        barChart: {
          xAxisData: [["类别1", "类别2", "类别3", "类别4", "类别5","类别6"],[]],
          dataList: [],
          grid: {
            top: 110,
            bottom: 90,
            right: 50,
          },
          seriesOptions: [
            {
              type: "bar",
              stack: "类1",
              itemStyle: {
                color: "#3366cc",
              },
              markLine: {
                data: [
                  {
                    type: "max",
                    name: "平均线",
                  },
                ],
                lineStyle: {
                  type: "dashed",
                },
                symbol: ["none", "none"], // 去除线段两端标记样式
                label: {
                  show: true,
                  formatter: "平均值",
                },
              },
            },
            {
              type: "bar",
              label: {
                show: true,
                position: "top",
                textStyle: {
                  color: "#fff",
                  fontSize: 16,
                },
                formatter: (arg) => {
                  return this.seriesData[arg.dataIndex];
                },
              },
              stack: "类1",
            },
          ],
          chartOptions: {
            tooltip: {
              formatter: (arg) => {
                return `${arg[0].name}:${this.seriesData[arg[0].dataIndex]}`;
              },
            },
          },
        },
      };
    },
    mounted() {
      this.getData();
      this.$refs.barCharts.initChart();
    },
    methods: {
      getData() {
        let sum = 0;
        this.seriesData.forEach((item) => (sum += item));
        const aver = sum / this.seriesData.length;
        this.barChart.dataList[0] = this.seriesData.map((item) => {
          if (item > aver) return aver;
          else return item;
        });
        this.barChart.dataList[1] = this.seriesData.map((item) => {
          if (item > aver) return item - aver;
           else return 0;
        });
      },
    },
  };
</script>
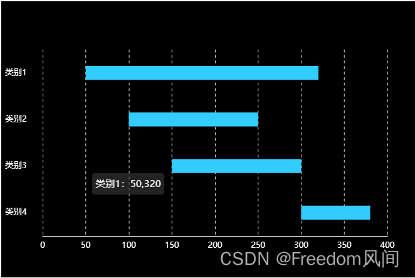
脱离零轴柱形图
通过对 series 设置两组数据并设置相同的stack产生堆叠柱形图,并对上面和下面的柱的数据进行处理靠近y 轴柱data数据是列表的第一个数值,第二组数值为差值。让第一个柱子透明度设置为 0 。在tooltip显示的时候也要修改formatter的值。
<template>
  <base-bar-chart
    ref="barCharts"
    :seriesData="barChart.dataList"
    :yAxisData="barChart.yAxisData"
    :seriesOptions="barChart.seriesOptions"
    :chartOptions="barChart.chartOptions"
    :grid="barChart.grid"
    width="600px"
    height="400px"
    theme="dark"
  ></base-bar-chart>
</template>
<script>
  export default {
    data() {
      return {
        seriesData: [
          [50, 320],
          [100, 250],
          [150, 300],
          [300, 380],
        ],
        barChart: {
          yAxisData: [["类别1", "类别2", "类别3", "类别4"]],
          dataList: [],
          grid: {
            top: 70,
            bottom: 60,
            right: 40,
          },
          seriesOptions: [
            {
              stack: "类1",
              itemStyle: {
                opacity: 0,
              },
              type: "bar",
            },
            {
              label: {
                show: false,
              },
              stack: "类1",
              xAxisIndex: 0,
              itemStyle: {
                color: "#33ccff",
              },
              type: "bar",
            },
          ],
          chartOptions: {
            tooltip: {
              formatter: (arg) => {
                return `${arg[0].name}:${this.seriesData[arg[0].dataIndex]}`;
              },
            },
            xAxis: [
              {
                interval: 50, // 强制设置坐标轴刻度间隔值
                type: "value",
                axisLabel: {
                  // 刻度标签文字的颜色
                  color: "#fff",
                },
                splitLine: {
                  // x轴竖线
                  lineStyle: {
                    type: "dashed",
                  },
                },
                axisLine: {
                  // 设置轴线
                  show: true,
                  // 设置轴线
                  lineStyle: {
                    color: "#fff",
                  },
                },
                axisTick: {
                  show: false, // 是否显示坐标轴刻度。
                },
              },
            ],
            yAxis: [
              {
                type: "category",
                inverse: true,
                axisLabel: {
                  color: "#fff", // 刻度标签文字的颜色
                  padding: [0, 15, 0, 0], // 设置轴文字上下偏移
                },
                axisLine: {
                  // 设置轴线
                  lineStyle: {
                    color: "#fff",
                    type: "dashed",
                  },
                },
                axisTick: {
                  show: false, // 是否显示坐标轴刻度。
                },
              },
            ],
          },
        },
      };
    },
    mounted() {
      this.getData();
      this.$refs.barCharts.initChart();
    },
    methods: {
      getData() {
        this.barChart.dataList[0] = this.seriesData.map((item) => {
          // 获得底部隐藏柱子数据
          return item[0];
        });
        this.barChart.dataList[1] = this.seriesData.map((item) => {
          // 获得显示柱子的数据
          return item[1] - item[0];
        });
      },
    },
  };
</script>
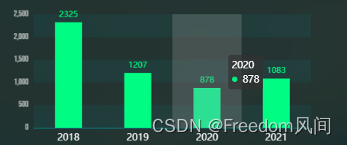
顶部文字显示背景斑马
let option = {
    tooltip: {
        trigger: 'axis',
        axisPointer: {
            // 坐标轴指示器,坐标轴触发有效
            type: 'shadow' // 默认为直线,可选为:'line' |
'shadow'
        },
        formatter: function(params) {
            let resultArr = params.reverse()
            let str =
`<div><div>${params[0].axisValue}</div>`
            resultArr.forEach(item => {
                str += `<div style='display:
flex;height:20px;align-items:center;'><div
style="width:8px;height:8px;margin-right:8px;background:
#00e87e;border-radius:6px;"></div>
                    <div>${item.value}</div></div>`
            })
            return str
        }
    },
    color: ['#00fc83'],
    grid: {
        top: '20',
        left: '50',
        bottom: '30',
        right: '20'
    },
    xAxis: [
        {
            type: 'category',
            axisTick: {
                show: false
            },
            axisLabel: {
                color: '#ffffff',
                fontSize: 14,
                interval: 0
            },
            axisLine: {
                lineStyle: {
                    color: '#038b8f'
                }
            },
            data: [2018,2019,2020,2021]
        }
    ],
    yAxis: [
        {
            axisLine: {
                show: false
            },
            axisTick: {
                show: false
            },
            splitLine: {
                show: false
            },
            splitArea: {
                show: true,
                areaStyle: {
                    color: ['rgba(3,139,143,0.1)', 'rgba(255,255,255,0)']
                },
                interval: 1
            },
            axisLabel: {
                color: 'rgba(255,255,255,0.6)',
                fontFamily: 'Bebas Neue',
                fontSize: 12
            }
        }
    ],
    series: [
        {
            name: '曝光',
            type: 'bar',
            barWidth: 40,
            data: [2325,1207,878,1083],
            itemStyle: {
                normal: {
                    label: {
                        show: true,
                        position: 'top'
                    }
                }
            }
        }
    ]
}
叠加图斑马纹
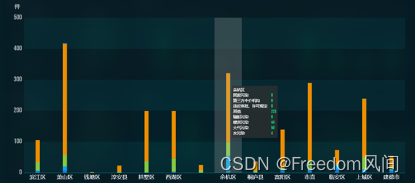
关键是要根据数据循环生成series 设置stack值一致就可以叠加
const xdata = ['滨江区', '萧山区', '钱塘区', '淳安县',
'拱墅区']
const series = [
    {
        barWidth: 15,
        data: ['4', '7', 0, 0, 0],
        name: '水污染',
        stack: '信访', // 关键是stack一致
        type: 'bar'
    },
    {
        barWidth: 15,
        data: ['4', '7', 0, 0, 0],
        name: '土污染',
        stack: '信访', // 关键时stack一致
        type: 'bar'
    },
    {
        barWidth: 15,
        data: ['4', '7', 0, 0, 0],
        name: '气污染',
        stack: '信访', // 关键时stack一致
        type: 'bar'
    }
]
let option = {
    title: {
        text: '件',
        padding: [0, 0, 0, 25],
        textStyle: {
            color: 'rgba(255,255,255,0.6)',
            fontWeight: 700,
            fontSize: 20
        }
    },
    tooltip: {
        //过滤掉统计的series
        trigger: 'axis',
        axisPointer: {
            // 坐标轴指示器,坐标轴触发有效
            type: 'shadow' // 默认为直线,可选为:'line' |
'shadow'
        },
        formatter: function (params) {
            let resultArr = params.reverse()
            let str =
`<div><div>${params[0].axisValue}</div>`
            resultArr.forEach(item => {
                str += `<div
style="display:flex;height:20px;align-items:center;">
                        <div style="width:
140px">${item.seriesName}</div>
                        <div style='font-family:Bebas Neue;color:
#00e87e;font-size: 16px;'>${item.value}</div>
                    </div></div>`
            })
            return str
        }
    },
    color: ['#1976d2', '#03a9f4', '#85c941', '#d9cc4c',
'#ee8e00'],
    grid: {
        top: '50',
        left: '60',
        bottom: 40,
        right: '20'
    },
    xAxis: [
        {
            type: 'category',
            axisTick: {
                show: false
            },
            axisLabel: {
                color: '#ffffff',
                fontSize: 20,
                interval: 0
            },
            axisLine: {
                lineStyle: {
                    color: '#038b8f'
                }
            },
            data: xdata
        }
    ],
    yAxis: [
        {
            axisLine: {
                show: false
            },
            axisTick: {
                show: false
            },
            splitLine: {
                show: false
            },
            splitArea: {
                show: true,
                areaStyle: {
                    color: ['rgba(3,139,143,0.1)', 'rgba(255,255,255,0)']
                },
                interval: 1
            },
            axisLabel: {
                color: 'rgba(255,255,255,0.6)',
                fontFamily: 'Bebas Neue',
                fontSize: 25
            }
        }
    ],
    series: series
}
不同颜色柱子
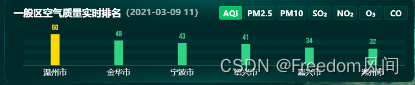
const xData = [60, 48,25,35,15],
                yData = ['绍兴市', '嘉兴市', '台州市',
'温州市', '杭州市']
getOption(xData, yData) {
            let chartOption = {
                grid: {
                    top: '30',
                    left: '20',
                    bottom: '25',
                    right: '20'
                },
                tooltip: {
                    trigger: 'axis',
                    formatter: function(params) {
                        return `${params[0].seriesName} <br/>
${params[0].marker} ${params[0].value}个`
                    }
                },
                xAxis: {
                    type: 'category',
                    axisTick: {
                        show: false
                    },
                    data: xData,
                    axisLabel: {
                        color: 'rgba(255,255,255,1)',
                        fontSize: 16,
                        interval: 0
                    },
                    axisLine: {
                        lineStyle: {
                            color: '#038b8f'
                        }
                    }
                },
                yAxis: {
                    axisLine: {
                        show: false
                    },
                    axisTick: {
                        show: false
                    },
                    splitLine: {
                        show: false
                    },
                    splitArea: {
                        show: true,
                        areaStyle: {
                            color: ['rgba(3,139,143,0.1)', 'rgba(255,255,255,0)']
                        },
                        interval: 1
                    },
                    axisLabel: {
                        show: false
                    }
                },
                series: [
                    {
                        name: 'AQI',
                        type: 'bar',
                        barWidth: 18,
                        data: yData,
                        itemStyle: {
                            color: function(params) {
                        if (params.data >= 150) return 'red'
                        else if (150 > params.data >= 100) return 'yellow'
                        else return 'green'
                    },
                            label: {
                                textStyle: {
                                    color: 'red'
                                }
                            }
                        },
                        label: {
                            show: true,
                            formatter: '{c}',
                            position: 'top',
                            fontSize: 16,
                            fontFamily: 'Bebas Neue',
                            color: 'inherit'
                        },
                        labelLine: {
                            show: false
                        }
                    }
                ]
            }
            return chartOption
        }
预警线柱形图
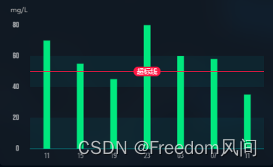
const option = {
                tooltip: {
                    trigger: 'axis',
                    axisPointer: {
                        // 坐标轴指示器,坐标轴触发有效
                        type: 'shadow' // 默认为直线,可选为:'line' | 'shadow'
                    }
                },
                color: ['#00E87E'],
                grid: {
                    top: '50',
                    left: '35',
                    bottom: '30',
                    right: '0'
                },
                xAxis: [
                    {
                        type: 'category',
                        axisTick: {
                            show: false
                        },
                        axisLabel: {
                            color: 'rgba(255,255,255,0.5)',
                            fontSize: 12,
                            fontFamily:"Arial Narrow",
                            interval: 0
                        },
                        axisLine: {
                            lineStyle: {
                                color: '#038b8f'
                            }
                        },
                        data: [11,15,19,23,'03','07',11],
                    }
                ],
                yAxis: [
                    {
                        name: "mg/L",
                        nameTextStyle: {
                            color: "#aaa",
                            nameLocation: "start",
                            padding:[0,40,5,0]
                        },
                        axisLine: {
                            show: false
                        },
                        axisTick: {
                            show: false
                        },
                        splitLine: {
                            show: false
                        },
                        splitArea: {
                            show: true,
                            areaStyle: {
                                color: ['rgba(3,139,143,0.1)', 'rgba(255,255,255,0)']
                            },
                            interval: 1
                        },
                        axisLabel: {
                            color: 'rgba(255,255,255,0.6)',
                            fontFamily: 'Bebas Neue',
                            fontWeight: 'normal',
                            fontSize: 14,
                            margin: 20
                        }
                    }
                ],
                series: [
                    {
                        name: '曝光',
                        type: 'bar',
                        barWidth: 12,
                        data: [70,55,45,80,60,58,35],
                        itemStyle: {
                        },
                        markLine: {
                            data : [
                                {
                                    type :'average',
                                    name: '超标线',
                                    yAxis:50, // 设置makline的位置
                                    label: {
                                        show: true,
                                        formatter: '{b}',
                                        position: 'middle',
                                        distance: -8.5,
                                        fontSize: 12,
                                        lineHeight: 15,
                                        padding: [2, 6, 0, 6],
                                        color: '#FFFFFF',
                                        backgroundColor: '#FF1744',
                                        borderRadius: 8,
                                    },
                                    lineStyle: {
                                        type: 'solid',
                                        color: '#FF1744',
                                    }}
                            ],
                            symbol:['none','none'],
                        }
                    }
                ]
            }
3d柱形图

需要安装 echarts-gl
const seriesData = [40]
const xData = { name: '基本能力', rate: 40, total: 100, done: 40 }
const { total, done } = xData
const options = {
    grid: {
        left: 0,
        right: 0,
        top: 7,
        bottom: 20
    },
    tooltip: {
        trigger: 'axis',
        axisPointer: {
            type: 'line' // 默认为直线,可选为:'line' | 'shadow'
        },
        // position(point: number[]) {
        //     // 固定在顶部
        //     return [point[0], '10%']
        // },
        textStyle: {
            fontFamily: 'TRENDS'
        },
        formatter: (params: any[]) => {
            let str = `<div>${params[0].axisValue}:</div>`
            str += `<div>完成数:${done}个</div>`
            str += `<div>总数:${total}个</div>`

            return str
        }
    },
    legend: {
        show: true,
        icon: 'circle',
        orient: 'horizontal',
        top: '90.5%',
        right: 'center',
        itemWidth: 16.5,
        itemHeight: 6,
        textStyle: {
            color: '#C9C8CD',
            fontSize: 14
        }
    },
    xAxis: [{
        show: false,
        data: [xData.name],
        axisLabel: {
            show: true,
            textStyle: {
                color: '#aaaaaa',
                fontSize: 12
            },
            margin: 30, // 刻度标签与轴线之间的距离。
        },
        axisLine: {
            show: false // 不显示x轴
        },
        axisTick: {
            show: false // 不显示刻度
        },
        boundaryGap: true,
        splitLine: {
            show: false,
            width: 1,
            lineStyle: {
                type: 'solid',
                color: '#03202E'
            }
        }
    }],
    yAxis: [{
        show: false,
        axisLabel: {
            interval: 'auto',
            show: true,
            textStyle: {
                fontSize: 14,
                color: '#fff',
            },
        },
        splitLine: {
            show: false,
            lineStyle: {
                color: 'rgba(49,176,255,0.05)',
            },
        },
        axisTick: {
            show: false,
        },
        axisLine: {
            show: true,
            lineStyle: {
                color: 'rgba(49,176,255,0.5)',
            },
        },
    }],
    series: [
    // 柱顶圆片 背景
        {
            name: '',
            type: 'pictorialBar',
            symbolSize: [52, 20], // 调整截面形状
            symbolOffset: [0, -6],
            z: 12,
            symbolPosition: 'end',
            label: {
                show: false,
                position: 'top',
                textStyle: {
                    color: '#fff'
                }
            },
            itemStyle: {
                normal: {
                    color: () => {
                        return new echarts.graphic.LinearGradient(0, 0, 0, 1, [
                            { offset: 0, color: 'rgba(0, 58, 77, 1)' },
                            { offset: 1, color: 'rgba(0, 158, 209, 1)' },
                        ])
                    },
                }
            },
            data: [total]
        },
        // 柱体 背景
        {
            name: '',
            type: 'bar',
            barWidth: '100%',
            itemStyle: {
                color: () => {
                    return new echarts.graphic.LinearGradient(0, 0, 1, 0, [
                        { offset: 0, color: 'rgba(0, 58, 77, 1)' },
                        { offset: 0.5, color: 'rgba(0, 58, 77, 0)' },
                        { offset: 1, color: 'rgba(0, 58, 77, 1)' },
                    ])
                },
                opacity: 1
            },
            data: [total]
        },

        { // 顶部园片 数据实体
            name: '',
            type: 'pictorialBar',
            symbolSize: [52, 20], // 调整截面形状
            symbolOffset: [0, -6],
            z: 13,
            symbolPosition: 'end',
            itemStyle: {
                normal: {
                    color: () => {
                        return new echarts.graphic.LinearGradient(0, 0, 0, 1, [
                            { offset: 0, color: 'rgba(159, 255, 224, 0.8)' },
                            { offset: 1, color: 'rgba(75, 210, 187, 0.8)' },
                        ])
                    },
                }
            },
            data: seriesData || []
        },
        { // 柱体 数据实体
            name: '',
            type: 'bar',
            barWidth: '100%',
            barGap: '-100%',
            itemStyle: {
                normal: {
                    color: () => {
                        return new echarts.graphic.LinearGradient(0, 0, 1, 0, [
                            { offset: 0, color: 'rgba(0, 58, 77, 1)' },
                            { offset: 0.5, color: 'rgba(113,286,181, .7)' },
                            { offset: 1, color: 'rgba(0, 58, 77, 1)' },
                        ])
                    },
                }
            },
            data: seriesData || []
        },
        { // 柱底圆片
            name: '',
            type: 'pictorialBar',
            symbolSize: [58, 18], // 调整截面形状
            symbolOffset: [0, 8],
            z: 12,
            itemStyle: {
                color: () => {
                    return new echarts.graphic.LinearGradient(0, 0, 1, 0, [
                        { offset: 0, color: 'rgba(0, 58, 77, 1)' },
                        { offset: 0.5, color: 'rgba(113,286,181, .7)' },
                        { offset: 1, color: 'rgba(0, 58, 77, 1)' },
                    ])
                },
            },
            data: seriesData || []
        },
    ]
}
混合图 折线柱形
自定义legend+头部名称+tooltip+ 自定义y轴条数
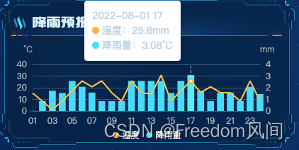
const xAxis = ['2022-08-01 01', '2022-08-01 02', '2022-08-01 03', '2022-08-01 04', '2022-08-01 05', '2022-08-01 06', '2022-08-01 07', '2022-08-01 08', '2022-08-01 09', '2022-08-01 10', '2022-08-01 11', '2022-08-01 12', '2022-08-01 13', '2022-08-01 14', '2022-08-01 15', '2022-08-01 16', '2022-08-01 17', '2022-08-01 18', '2022-08-01 19', '2022-08-01 20', '2022-08-01 21', '2022-08-01 22', '2022-08-01 23', '2022-08-01 24']
const seriesData = {
    temperature: [15.5, 8.5, 1.2, 8.5, 17.4, 25.8, 20.8, 25.8, 15.8, 8.5, 25.8, 15.8, 14.6, 30.8, 8.5, 17.4, 25.8, 15.8, 20.8, 15.8, 15.8, 8.5, 25.8, 8.5],
    rain: [0.02, 0.85, 1.74, 1.55, 2.58, 2.08, 1.58, 0.85, 0.85, 0.85, 2.58, 2.58, 2.58, 2.58, 1.55, 2.58, 3.08, 1.74, 0.85, 1.55, 1.58, 0.85, 2.08, 1.46]
}
const option = {
    grid: {
        top: 40,
        right: 32,
        bottom: 50,
        left: 30
    },
    tooltip: {
        trigger: 'axis',
        axisPointer: {
            type: 'line'
        },
        textStyle: {
            color: '#b9cfe2',
            fontFamily: 'PingFang SC'
        },
        formatter: (params: any[]) => {
            let str = `<div>${params[0].axisValue}</div>`
            params.forEach((item: record, index: number) => {
                let unit = ''
                if (index === 0)
                    unit = 'mm'
                else if (index === 1)
                    unit = '°C'
                str += `<div>${item.marker}${item.seriesName}:${item.value
                    ? item.value
                    : '--'}${unit}</div>`
            })
            return str
        }
    },
    legend: {
        show: true,
        bottom: 5,
        inactiveColor: 'rgba(255,255,255,0.5)',
        textStyle: {
            color: 'rgba(255,255,255,1)'
        },
        itemHeight: 8,
        itemWidth: 8,
        data: [
            {
                name: '温度',
                icon: 'circle',
            },
            {
                name: '降雨量',
                icon: 'circle',
            }
        ]
    },
    xAxis: {
        type: 'category',
        boundaryGap: false,
        axisLine: {
            show: false,
            lineStyle: {
                color: 'rgba(255,255,255,0.5)'
            }
        },
        axisLabel: {
            show: true,
            textStyle: {
                fontFamily: 'Bebas Neue',
                fontSize: '12',
                color: 'rgba(255,255,255,0.6)'
            },
            formatter: (value: string) => {
                return value.slice(-2)
            }
        },
        axisTick: {
            show: false
        },
        data: xAxis
    },
    yAxis: [
        {
            type: 'value',
            name: '°C',
            // nameLocation: 'start',
            splitNumber: 3, // 横线数
            nameTextStyle: {
                align: 'right',
                padding: [0, 0, -0, 0]
            },
            axisLabel: {
                formatter: '{value}',
                textStyle: {
                    fontFamily: 'Bebas Neue',
                    fontSize: '12',
                    color: 'rgba(255,255,255,0.6)'
                }
            },
            axisLine: {
                show: false,
                lineStyle: {
                    color: 'rgba(255,255,255,0.5)'
                }
            },
            axisPointer: {
                snap: true
            },
            splitLine: {
                show: true,
                lineStyle: {
                    color: 'rgba(255,255,255,.2)'
                    // type: 'dashed',
                },
            },
            axisTick: { show: false },
        },
        {
            type: 'value',
            name: 'mm',
            splitNumber: 3, // 横线数
            nameTextStyle: {
                align: 'left',
                padding: [0, 0, 0, 0]
            },
            axisLabel: {
                formatter: '{value}',
                textStyle: {
                    fontFamily: 'Bebas Neue',
                    fontSize: '12',
                    color: 'rgba(255,255,255,0.6)'
                }
            },
            axisLine: {
                show: false,
                lineStyle: {
                    color: 'rgba(255,255,255,0.5)'
                }
            },
            axisPointer: {
                snap: true
            },
            splitLine: { show: false },
            axisTick: { show: false }
        }
    ],
    series: [
        {
            name: '温度',
            type: 'line',
            showSymbol: false, // 不显示点
            yAxisIndex: 0,
            lineStyle: {
                color: 'rgba(255, 180, 67, 1)',
                opacity: 1,
                width: 2
            },
            itemStyle: {
                color: 'rgba(255, 180, 67, 1)',
            },
            data: temperature
        },
        {
            name: '降雨量',
            type: 'bar',
            yAxisIndex: 1,
            markPoint: {
                show: false,
            },
            itemStyle: {
                color: 'rgba(0, 221, 255, 1)',
                width: 0.5
            },
            data: rain
        }
    ]
}
轴顶峰值和最低值
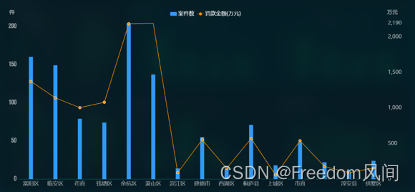
设置y轴数组 配合series数组第一个为柱形图 第二个为折线
const xdata = ['富阳区', '临安区', '市直', '钱塘区', '余杭区']
const seriesData = [160, 149, 79, 74, 204]  // 柱形图数据
const lineData = [1372.51, 1141.95, 1004.08, 1080.24, 2183.48] //
折线数据
let chartOption = {
    grid: {
        top: '50',
        left: '45',
        bottom: '30',
        right: '70'
    },
    legend: {
        data: ['案件数', '罚款金额(万元)'],
        textStyle: {
            fontSize: 20,
            color: '#ffffff'
        }
    },
    tooltip: {
        trigger: 'axis'
    },
    xAxis: [
        {
            type: 'category',
            axisTick: {
                show: false
            },
            data: barXvalue,
            axisLabel: {
                color: 'rgba(255,255,255,0.6)',
                fontSize: 20
            },
            axisLine: {
                lineStyle: {
                    color: '#038b8f'
                }
            }
        }
    ],
    yAxis: [
        {
            type: 'value',
            name: '件',
            position: 'left',
            nameTextStyle: {
                color: 'rgba(255,255,255,0.5)',
                fontSize: 20,
                fontWeight: 700,
                padding: [0, 0, 15, -50]
            },
            min: 0,
            max: 204, // 设置柱形图y轴的最大值
            axisLine: {
                show: false
            },
            axisTick: {
                show: false
            },
            splitLine: {
                show: false
            },
            splitArea: {
                areaStyle: {
                    color: ['rgba(3,139,143,0.1)', 'rgba(255,255,255,0)']
                },
                interval: 1
            },
            axisLabel: {
                show: true,
                color: 'rgba(255,255,255,0.6)',
                fontFamily: 'Bebas Neue',
                fontSize: 25
            }
        },
        {
            type: 'value',
            name: '万元',
            position: 'right',
            nameTextStyle: {
                color: 'rgba(255,255,255,0.5)',
                fontSize: 20,
                fontWeight: 700,
                padding: [0, -50, 15, 0]
            },
            show: true,
            min: 0,
            max: 2190, // 设置折线y轴最大值
            axisLine: {
                show: false
            },
            axisTick: {
                show: false
            },
            splitLine: {
                show: false
            },
            axisLabel: {
                show: true,
                color: 'rgba(255,255,255,0.6)',
                fontSize: 20
            }
        }
    ],
    series: [
        {
            name: '案件数',
            type: 'bar',
            barWidth: 15,
            data: data,
            yAxisIndex: 0,
            itemStyle: {
                normal: {
                    // label: {
                    //     show: true, //开启显示
                    //     position: 'top' //在上方显示
                    // },
                    labelLine: {
                        show: false
                    },
                    color: '#3299f4'
                }
            }
        },
        {
            name: '罚款金额(万元)',
            type: 'line',
            data: lineData,
            yAxisIndex: 1,
            symbol: 'circle',
            symbolSize: 10,
            itemStyle: {
                normal: {
                    labelLine: {
                        show: false
                    },
                    color: '#ee8e00',
                    borderColor: '#ffffff'
                }
            },
            lineStyle: {
                normal: {
                    color: '#ee8e00' // 线条颜色
                }
            }
        }
    ]
}
上下联动控制折线,柱形图

option = {
    dataZoom: [
        {
            backgroundColor: '#021e2d',
            borderColor: '#021e2d',
            dataBackground: {
                areaStyle: {
                    opacity: 0,
                },
                lineStyle: {
                    color: '#03d5fb',
                },
            },
            end: 100,
            fillerColor: 'rgba(255, 255, 255, 0.1)',
            height: 24,
            moveHandleStyle: { opacity: 0 },
            realtime: true,
            selectedDataBackground: {
                areaStyle: { opacity: 0 },
                lineStyle: { color: '#03d5fb' },
            },
            show: true,
            start: 70,
            textStyle: {
                color: 'rgba(255,255,255,0.5)',
                fontFamily: 'Bebas Neue',
            },
            top: '92%',
            type: 'slider',
            xAxisIndex: [0, 1], // 同时控制两个图表
        },
    ],
    tooltip: {
        link: { xAxisIndex: 'all' },
        trigger: 'axis',
    },
    grid: [
        { top: 50, left: 60, right: 32, height: 140 },
        { left: 60, right: 32, top: '56%', height: 140 },
    ],
    xAxis: [
        {
            axisLabel: { show: false },
            axisLine: {
                show: true,
                lineStyle: {
                    color: 'rgba(255,255,255,0.2)',
                },
            },
            axisTick: { show: false },
            data: ['2015-01','2015-02','2015-03','2015-04','2015-05','2015-06','2015-07','2015-08','2015-09','2015-10','2015-11','2015-12','2016-01','2016-02','2016-03','2016-04','2016-05','2016-06','2016-07','2016-08','2016-09','2016-10','2016-11','2016-12','2017-01','2017-02','2017-03','2017-04','2017-05','2017-06','2017-07','2017-08','2017-09','2017-10','2017-11','2017-12','2018-01','2018-02','2018-03','2018-04','2018-05','2018-06','2018-07','2018-08','2018-09','2018-10','2018-11','2018-12','2019-01','2019-02','2019-03','2019-04','2019-05','2019-06','2019-07','2019-08','2019-09','2019-10','2019-11','2019-12','2020-01','2020-02','2020-03','2020-04','2020-05','2020-06','2020-07','2020-08','2020-09','2020-10','2020-11','2020-12','2021-01','2021-02','2021-03','2021-04','2021-05','2021-06','2021-07','2021-08','2021-09','2021-10','2021-11','2021-12','2022-01'],
            gridIndex: 0,
            type: 'category',
        },
        {
            axisLabel: { color: 'rgba(255,255,255,0.6)', fontFamily:
'Bebas Neue', fontSize: 12 },
            axisLine: { show: false, lineStyle: { color:
'rgba(255,255,255,0.2)' } },
            axisTick: { show: false },
            data: [
'2015-01','2015-02','2015-03','2015-04','2015-05','2015-06','2015-07','2015-08','2015-09',
'2015-10','2015-11','2015-12','2016-01','2016-02','2016-03','2016-04','2016-05','2016-06',
'2016-07','2016-08','2016-09','2016-10','2016-11','2016-12','2017-01','2017-02','2017-03',
'2017-04','2017-05','2017-06','2017-07','2017-08','2017-09','2017-10','2017-11','2017-12',
'2018-01','2018-02','2018-03','2018-04','2018-05','2018-06','2018-07','2018-08','2018-09',
'2018-10','2018-11','2018-12','2019-01','2019-02','2019-03','2019-04','2019-05','2019-06',
'2019-07','2019-08','2019-09','2019-10','2019-11','2019-12','2020-01','2020-02','2020-03',
'2020-04','2020-05','2020-06','2020-07','2020-08','2020-09','2020-10','2020-11','2020-12',
'2021-01','2021-02','2021-03','2021-04','2021-05','2021-06','2021-07','2021-08','2021-09', '2021-10','2021-11','2021-12','2022-01'],
            gridIndex: 1,
            type: 'category',
        },
    ],
    yAxis: [
        {
            axisLabel: { color: 'rgba(255,255,255,0.6)', fontFamily:
'Bebas Neue', fontSize: 12 },
            axisLine: { show: false, lineStyle: { color:
'rgba(255,255,255,0.5)' } },
            axisTick: { show: false },
            gridIndex: 0,
            splitArea: { show: true, areaStyle: { color: ['rgba(3,
139, 143, 0.1)', 'rgba(0, 0, 0, 0)'] } },
            splitLine: { show: false },
            type: 'value',
        },
        {
            axisLabel: { color: 'rgba(255,255,255,0.6)', fontFamily:
'Bebas Neue', fontSize: 12 },
            axisLine: { show: false, lineStyle: { color:
'rgba(255,255,255,0.5)' } },
            axisTick: { show: false },
            gridIndex: 1,
            splitLine: { show: false },
            type: 'value',
        }
    ],
    series: [
        {
            data: [182.43, 331.93, 280.81, 306.58, 175.65, 255.62, 296.47,
200.29, 328.7, 362.27, 262.62, 207.44, 293.15, 228.11, 255.78, 201.57,
343.41, 501.33,498.48, 245.99, 286.61, 376.92, 326.08, 247.09, 482.85,
423.43, 505.87, 266.3, 403.53, 309.25, 424.08, 261.61, 272.59, 371.21,
398.12, 396.44,247.97, 422.56, 386.74, 301.53, 619.63, 327.24, 437.38,
396.34, 437.26, 509.46, 480.18, 364.14, 295.89, 454.31, 446.57, 430.51,
409.9, 307.79,637.78, 550.48, 525.59, 741.72, 743.59, 1373.45, 705.16,
564.36, 313.02, 520.78, 321.25, 414.22, 968.89, 988.12, 591.68, 924.52,
298.81, 975.16,442.93, 378.51, 450.52, 439.35, 466.52, 431.31, 568.86,
495.26, 453.81, 320.52, 373.43, 294.15, 488.52],
            itemStyle: {
                normal: {
                    borderColor: '#03d5fb',
                    color: '#fff',
                    lineStyle: { color: '#03d5fb' },
                },
            },
            name: '交易指数',
            symbol: 'circle',
            symbolSize: 6,
            type: 'line',
            xAxisIndex: 0,
            yAxisIndex: 0,
        },
        {
            color: '#03d5fb',
            data: [917.69, 1432.33, 368.8, 847.28, 914.93, 1401.59, 890.24,730.58, 1410.65, 2455.78, 624.47, 4255.95, 380.35, 505.21, 707.07,1187.47, 704.68,982.8, 879.25, 928.67, 527.28, 745.01, 626.85, 1057.78,712.86, 454.54, 870.92, 697.28, 827.7, 2878.98, 722.32, 1901.37,2012.69, 1281.26,1551.8, 864.89, 2508.12, 399.67, 558.1, 1413.86,1213.51, 3185.93, 798.56, 1528.6, 1181.06, 613.97, 2359.39, 2108.55,1390.34, 244.09, 819.07,900.86, 727.02, 8795.05, 797.41, 730.47, 1274.81, 299.2,972.85, 3068.04, 1726.9, 217.88, 1460.76, 1020.14, 966.39, 881.36,1062.06, 963.89,644.61, 535.22, 945.37, 1764.53, 926.24, 689.99,1518.73, 1044.09, 1239.62, 2594.6, 1376.45, 2825.65, 4709.81, 1065.98,559.45, 1189.44,1459.03],
            name: '成交量',
            type: 'bar',
            xAxisIndex: 1,
            yAxisIndex: 1,
        },
    ],
}
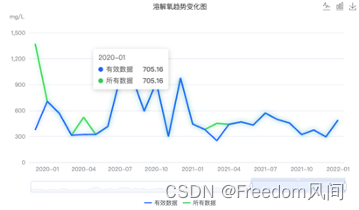
工具栏切换,阴影
const option = {
    dataZoom: [
        {
            end: 100,
            height: 24,
            realtime: true,
            selectedDataBackground: {
                areaStyle: { opacity: 0 },
                lineStyle: { color: '#E6F7FF' }
            },
            show: true,
            start: 70,
            textStyle: {
                color: 'rgba(255,255,255,0.5)',
                fontFamily: 'Oswald'
            },
            bottom: '10%',
            type: 'slider'
            // backgroundColor: '#021e2d',
            // borderColor: '#021e2d',
            // dataBackground: {
            // areaStyle: {
            // opacity: 0
            // },
            // lineStyle: {
            // color: '#E6F7FF'
            // }
            // },
            // moveHandleStyle: { opacity: 0 },
            // fillerColor: 'rgba(255, 255, 255, 0.1)',
            // xAxisIndex: [0, 1],
        }
    ],
    tooltip: {
        link: { xAxisIndex: 'all' },
        trigger: 'axis'
    },
    toolbox: {
        // !!!
        show: true,
        feature: {
            magicType: {
                type: ['line', 'bar']
            },
            saveAsImage: {} // 导出图片
        },
        // iconStyle: {
        // borderColor: '#DCDFE6'
        // },
        brush: {
            type: 'rect'
        }
    },
    title: {
        text: '溶解氧趋势变化图',
        left: 'center',
        top: 4,
        textStyle: {
            fontSize: '14',
            fontFamily: 'PingFangSC',
            fontWeight: 'normal'
        }
    },
    legend: {
        bottom: 5,
        left: 'center',
        itemHeight: 2,
        itemWidth: 16,
        textStyle: {
            fontSize: 12,
            color: '#606266',
            fontFamily: 'PingFangSC'
        }
    },
    grid: {
        top: 70,
        left: 60,
        right: 32,
        bottom: 100
    },
    xAxis: {
        axisLabel: {
            show: true,
            fontFamily: 'Oswald',
            fontSize: 12,
            color: '#909399'
        },
        axisLine: {
            show: true,
            lineStyle: {
                color: '#DCDFE6'
            }
        },
        axisTick: { show: false },
        data: [
            '2015-01', '2015-02', '2015-03', '2015-04', '2015-05', '2015-06', '2015-07', '2015-08', '2015-09', '2015-10', '2015-11', '2015-12', '2016-01', '2016-02', '2016-03', '2016-04', '2016-05', '2016-06', '2016-07', '2016-08', '2016-09', '2016-10', '2016-11', '2016-12', '2017-01', '2017-02', '2017-03', '2017-04', '2017-05', '2017-06', '2017-07', '2017-08', '2017-09', '2017-10', '2017-11', '2017-12', '2018-01', '2018-02', '2018-03', '2018-04', '2018-05', '2018-06', '2018-07', '2018-08', '2018-09', '2018-10', '2018-11', '2018-12', '2019-01', '2019-02', '2019-03', '2019-04', '2019-05', '2019-06', '2019-07', '2019-08', '2019-09', '2019-10', '2019-11', '2019-12', '2020-01', '2020-02', '2020-03', '2020-04', '2020-05', '2020-06', '2020-07', '2020-08', '2020-09', '2020-10', '2020-11', '2020-12', '2021-01', '2021-02', '2021-03', '2021-04', '2021-05', '2021-06', '2021-07', '2021-08', '2021-09', '2021-10', '2021-11', '2021-12',
            '2022-01'
        ],
        gridIndex: 0,
        type: 'category'
    },
    yAxis: {
        name: 'mg/L',
        nameTextStyle: {
            color: '#909399',
            nameLocation: 'start',
            padding: [5, 50, 12, 0]
        },
        axisLabel: {
            color: '#909399',
            fontFamily: 'Oswald',
            fontSize: 12
        },
        axisLine: {
            show: false,
            lineStyle: { color: 'rgba(255,255,255,0.5)' }
        },
        axisTick: { show: false },
        gridIndex: 0,
        splitLine: { show: true },
        type: 'value'
    },
    color: ['#0062FF', '#2AC94F'],
    series: [
        {
            data: [
                182.43, 331.93, 280.81, 306.58, 175.65, 255.62, 296.47, 200.29, 328.7, 362.27, 262.62, 207.44, 293.15, 228.11, 255.78, 201.57, 343.41, 501.33, 498.48, 245.99, 286.61, 376.92, 326.08, 247.09, 482.85, 423.43, 505.87, 266.3, 403.53, 309.25, 424.08, 261.61, 272.59, 371.21, 398.12, 396.44, 247.97, 442.56, 386.74, 301.53, 161.63, 327.24, 437.38, 396.34, 437.26, 509.46, 480.18, 364.14, 295.89, 454.31, 446.57, 430.51, 409.9, 307.79, 637.78, 550.48, 525.59, 741.72, 743.59, 373.45, 705.16, 564.36, 313.02, 320.78, 321.25, 414.22, 968.89, 988.12, 591.68, 924.52, 298.81, 975.16, 442.93, 378.51, 250.52, 439.35, 466.52, 431.31, 568.86, 495.26, 453.81, 320.52, 373.43, 294.15,
                488.52
            ],
            name: '有效数据',
            symbol: 'none',
            lineStyle: {
                width: 3,
                shadowColor: 'rgba(0, 98, 255, 0.4)',
                shadowBlur: 10
            },
            type: 'line',
            z: 3
        },
        {
            data: [
                182.43, 331.93, 280.81, 306.58, 175.65, 255.62, 296.47, 200.29, 328.7, 362.27, 262.62, 207.44, 293.15, 228.11, 255.78, 201.57, 343.41, 501.33, 498.48, 245.99, 286.61, 376.92, 326.08, 247.09, 482.85, 423.43, 505.87, 266.3, 403.53, 309.25, 424.08, 261.61, 272.59, 371.21, 398.12, 396.44, 247.97, 422.56, 386.74, 301.53, 619.63, 327.24, 437.38, 396.34, 437.26, 509.46, 480.18, 364.14, 295.89, 454.31, 446.57, 430.51, 409.9, 307.79, 637.78, 550.48, 525.59, 741.72, 743.59, 1373.45, 705.16, 564.36, 313.02, 520.78, 321.25, 414.22, 968.89, 988.12, 591.68, 924.52, 298.81, 975.16, 442.93, 378.51, 450.52, 439.35, 466.52, 431.31, 568.86, 495.26, 453.81, 320.52, 373.43, 294.15,
                488.52
            ],
            name: '所有数据',
            symbol: 'none',
            type: 'line',
            lineStyle: {
                width: 3,
                shadowColor: 'rgba(42, 201, 79, 0.4)',
                shadowBlur: 10
            },
            z: 0
        }
    ]
}
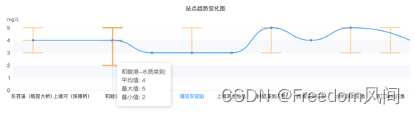
Boxplot和折线混合图
const option = {
    tooltip: {
        trigger: 'axis',
        formatter: (param: any) => {
            return [`${param[0].axisValueLabel}-${param[0].seriesName}:`, `平均值: ${this.checkNumber(param[0].value[3])
                ? param[0].value[3]
                : '--'}`, `最大值: ${
                this.checkNumber(param[0].value[5])
                    ? param[0].value[5]
                    : '--'}`, `最小值: ${this.checkNumber(param[0].value[1])
                ? param[0].value[1]
                : '--'}`].join('<br/>')
        }
    },
    title: {
        text: '站点趋势变化图',
        left: 'center',
        textStyle: {
            fontFamily: 'PingFangSC',
            fontSize: '14',
            color: '#303133',
            fontWeight: 'normal'
        }
    },
    grid: {
        left: 15,
        right: '0',
        top: 60,
        bottom: 45,
        containLabel: true
    },
    xAxis: {
        type: 'category',
        splitArea: {
            show: false
        },
        splitLine: {
            show: false
        },
        axisTick: {
            show: false
        },
        axisLine: {
            lineStyle: {
                color: 'rgba(220, 223, 230, 1)'
            }
        },
        axisLabel: {
            fontFamily: 'PingFangSC',
            fontSize: '12',
            color: (val: string) => {
                if (val === '浦沿东冠站') return 'rgba(64, 158, 255, 1)'
                return '#303133'
            },
            fontWeight: 'normal',
            interval: 0
        },
        data: ['东苕溪(瓶窑大桥)', '上塘河(保障桥)', '和睦港',
            '六塘文洋桥', '浦沿东冠站', '上城藻类应急', '拱墅藻类应急',
            '西湖藻类应急', '余杭藻类应急', '滨江藻类应急']
    },
    yAxis: {
        min: 0,
        type: 'value',
        name: 'mg/L',
        nameTextStyle: {
            color: 'rgba(96, 98, 102, 1)'
        },
        splitArea: {
            show: true,
            color: ['rgba(242, 246, 252, 1)', 'transparent']
        },
        splitLine: {
            show: false
        },
        axisTick: {
            show: false
        },
        axisLine: {
            lineStyle: {
                color: 'rgba(220, 223, 230, 1)'
            }
        },
        axisLabel: {
            fontFamily: 'Oswald',
            fontSize: '12',
            color: '#303133',
            fontWeight: 'normal'
            // formatter: value => {
            // if (this.isGroup) {
            // if (value && value > 0 && parseInt(value) === value) {
            // const name = this.getColorNameByLevel({
            // level: value,
            // type: 'name'
            // });
            // return name ? name : '';
            // }
            // return '';
            // } else {
            // return value;
            // }
            // }
        }
    },
    series: [
        {
            name: '水质类别',
            type: 'boxplot',
            data: [
                [3, 4, 4, 4, 5, 4, 2, '氨氮(NH3-N)、总磷(以 P 计)'],
                [null, null, null, null, null, null, 3, '', []],
                [2, 4, 4, 4, 5, 4, 3, '氨氮(NH3-N)'],
                [null, null, null, null, null, null, 2, '', []],
                [3, 3, 3, 3, 5, 3, 3, ''],
                [null, null, null, null, null, null, 3, '', []],
                [3, 3, 3, 3, 5, 3, 3, ''],
                [null, null, null, null, null, null, 3, '', []],
                [3, 3, 3, 3, 5, 3, 3, ''],
                [3, 5, 5, 5, 5, 5, 3, '总磷(以 P 计)、氨氮(NH3-N)'],
                [3, 4, 4, 4, 5, 4, 3, '氨氮(NH3-N)'],
                [4, 5, 5, 5, 5, 5, 2, '总磷(以 P 计)、氨氮(NH3-N)、溶解氧'],
                [null, null, null, null, null, null, 3, '', []],
                [null, null, null, null, null, null, 3, '', []],
                [3, 3, 3, 3, 5, 3, 3, ''],
                [3, 4, 4, 4, 5, 4, 3, '氨氮(NH3-N)'],
                [null, null, null, null, null, null, 3, '', []],
                [null, null, null, null, null, null, 3, '', []],
                [null, null, null, null, null, null, 3, '', []],
                [null, null, null, null, null, null, 3, '', []],
                [null, null, null, null, null, null, 3, '', []],
                [null, null, null, null, null, null, 3, '', []]
            ],
            itemStyle: {
                color: 'rgba(255, 153, 2, 1)',
                borderColor: 'rgba(255, 153, 2, 1)'
            }
        },
        {
            name: '水质类别',
            type: 'line',
            lineStyle: {
                color: 'rgba(64, 158, 255, 1)'
            },
            data: [4, null, 4, 3, 3, 3, 5, 4, 5, null, null, 3, 4, null, null, null, null, null, null],
            smooth: true,
            tooltip: {
                show: false
            },
            connectNulls: true // 无数的点连接在一起
        }
    ]
}
饼图
普通饼图
const data= [
                { name: '已完成', value: 6 },
                { name: '未完成', value: 4 }
            ]
let chartOption = {
                grid: {
                    top: 0,
                    left: '1%',
                    bottom: '1%',
                    right: '1%'
                },
                color: ['#00e87e', '#1e4940'],
                tooltip: {
                    trigger: 'item',
                    formatter: '{a} {b} : {c} ({d}%)',
                    position: 'right'
                },
                graphic: [
                    {
                        type: 'text',
                        left: '25',
                        top: 'center',
                        style: {
                            text: ((data[0].value / (data[0].value + data[1].value)) * 100).toFixed(0),
                            textAlign: 'center',
                            fill: '#00e87e',
                            fontSize: 24,
                            fontFamily: 'Bebas Neue'
                        },
                        tooltip: {
                            show: false
                        }
                    },
                    {
                        type: 'text',
                        left: '45',
                        top: '36',
                        style: {
                            text: '%',
                            textAlign: 'center',
                            fill: '#00e87e',
                            fontSize: 12,
                            fontWeight: 700
                        },
                        tooltip: {
                            show: false
                        }
                    }
                ],
                series: [
                    {
                        name:'',
                        type: 'pie',
                        center: ['50%', '50%'],
                        radius: ['60%', '84%'],
                        avoidLabelOverlap: true,
                        hoverAnimation: false,
                        data: data,
                        itemStyle: {
                            normal: {
                                label: {
                                    show: false
                                },
                                labelLine: {
                                    show: false
                                }
                            }
                        }
                    }
                ]
            }
自定义lengend rich TS
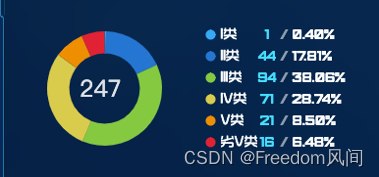
const option = {
    grid: {
        top: 0,
        left: 55,
        bottom: '1%'
    },
    color: ['#03A9F4', '#1976D2', '#85C941', '#D9CC4C', '#EE8E00', '#E12234'],
    legend: {
        type: 'scroll',
        orient: 'vertical',
        itemGap: 8,
        right: '0%',
        left: '50%',
        top: 'center',
        itemWidth: 10,
        itemHeight: 10,
        icon: 'circle',
        data: [
            {
                name: 'I类',
                value: 1,
                rate: '0.40%'
            },
            {
                name: 'II类',
                value: 44,
                rate: '17.81%'
            },
            {
                name: 'III类',
                value: 94,
                rate: '38.06%'
            },
            {
                name: 'IV类',
                value: 71,
                rate: '28.74%'
            },
            {
                name: 'V类',
                value: 21,
                rate: '8.50%'
            },
            {
                name: '劣V类',
                value: 16,
                rate: '6.48%'
            }
        ],
        textStyle: {
            rich: {
                name: {
                    width: 35,
                    fontSize: 14,
                    color: '#FFFFFF',
                    fontFamily: 'TRENDS'
                },
                num: {
                    fontSize: 14,
                    color: '#00DDFF',
                    width: 25,
                    align: 'right',
                    fontFamily: 'Furore'
                },
                label: {
                    fontSize: 14,
                    fontWeight: 'normal',
                    color: 'rgba(255,255,255,.5)',
                    width: 10,
                    align: 'center',
                    fontFamily: 'Furore'
                },
                rate: {
                    fontSize: 14,
                    padding: [0, 0, 0, 3],
                    align: 'right',
                    fontFamily: 'Furore',
                    color: 'rgba(255,255,255,1)'
                }
            }
        }
    },
    tooltip: {
        trigger: 'item'
    },
    graphic: [
        {
            type: 'text',
            left: '16%',
            top: '43%',
            style: {
                text: 247,
                textAlign: 'center',
                fontWeight: 'normal',
                fill: 'rgba(255,255,255,.85)',
                fontSize: 24,
                fontFamily: 'Oswald'
            }
        }
    ],
    series: [
        {
            name: '企业档案',
            type: 'pie',
            center: [
                '23%',
                '50%'
            ],
            radius: [
                '43%',
                '70%'
            ],
            avoidLabelOverlap: true,
            hoverAnimation: false,
            data: [
                {
                    name: 'I类',
                    value: 1,
                    rate: '0.40%'
                },
                {
                    name: 'II类',
                    value: 44,
                    rate: '17.81%'
                },
                {
                    name: 'III类',
                    value: 94,
                    rate: '38.06%'
                },
                {
                    name: 'IV类',
                    value: 71,
                    rate: '28.74%'
                },
                {
                    name: 'V类',
                    value: 21,
                    rate: '8.50%'
                },
                {
                    name: '劣V类',
                    value: 16,
                    rate: '6.48%'
                }
            ],
            itemStyle: {
                normal: {
                    label: {
                        show: false
                    },
                    labelLine: {
                        show: false
                    }
                }
            }
        }
    ]
}
自定义legend rich 2


const data = [
    { name: '危废单位规范化自查', value: 42, rate: '341次' },
    { name: '环境风险自查', value: 212, rate: '15843次' },
    { name: '辐射打卡', value: 65, rate: '58584次' },
    { name: '治理设施自巡查', value: 764, rate: '111次' }
]
let chartOption = {
    grid: {
        top: 0,
        left: '1%',
        bottom: '1%',
        right: '1%'
    },
    color: ['#3babff', '#00fc83', '#e8b021', '#f56c6c',
'#5D7092'],
    legend: {
        type: 'scroll',
        orient: 'vertical',
        right: '0%',
        left: '32%',
        top: 'center',
        itemWidth: 16,
        itemHeight: 16,
        icon: 'rect',
        data: data,
        formatter: name => {
            for (let i = 0; i < data.length; i++) {
                if (name == data[i].name) {
                    let richText =
`{name|${name}}{num|${data[i].value}${data[i].unit ?
data[i].unit : '家'}}{rate|${data[i].rate}}`
                    return richText
                }
            }
        },
        textStyle: {
            rich: {
                name: {
                    width: 160,
                    fontSize: 18,
                    fontWeight: 700,
                    padding: [0, 0, 0, 0],
                    color: 'rgba(255,255,255,0.6)',
                    overflow: 'hidden',
                    textOverflow: 'ellipsis',
                    whiteSpace: 'nowrap'
                },
                num: {
                    fontSize: 20,
                    fontWeight: 400,
                    padding: [0, 10, 0, 10],
                    color: '#01fe85',
                    width: 50,
                    align: 'right',
                    fontFamily: 'Bebas Neue'
                },
                rate: {
                    fontSize: 20,
                    fontWeight: 500,
                    padding: [0, 0, 0, 0],
                    align: 'right',
                    fontFamily: 'Bebas Neue',
                    color: 'rgba(255,255,255,1)'
                }
            }
        }
    },
    tooltip: {
        trigger: 'item',
        formatter: params => {
            const {
                data: { name, value, rate }
            } = params
            return `${name}:${value}家(${rate})`
        }
    },
    graphic: [ // 设置饼图中间文字内容
        {
            type: 'text',
            left: 80, // center不行 因为会飞到整个div的中间
            top: 75,
            style: {
                text: 'dd',
                textAlign: 'center',
                fill: '#f5f5f5',
                fontSize: 32,
                fontFamily: 'Bebas Neue'
            }
        }
    ],
    series: [
        {
            name: '企业档案',
            type: 'pie',
            center: ['16%', '50%'],
            radius: ['43%', '64%'],
            avoidLabelOverlap: true,
            hoverAnimation: false,
            data: data,
            itemStyle: {
                normal: {
                    label: {
                        show: false
                    },
                    labelLine: {
                        show: false
                    }
                }
            }
        }
    ]
}
自定义中间文字样式

graphic: [
    {
        type: 'text',
        left: 'center',
        top: '36%',
        style: {
            text: '94.0%',
            textAlign: 'center',
            fill: '#ffffff',
            fontSize: 24,
            fontFamily: 'Bebas Neue'
        }
    },
    {
        type: 'text',
        left: 'center',
        top: '56%',
        style: {
            text: '里程碑进度',
            textAlign: 'center',
            fill: 'rgba(255,255,255,0.6)',
            fontSize: 10
        }
    }
]
Ts 版本自定义legend
const data = [
    { name: '危废单位规', value: 42, percent: '34' },
    { name: '环境风查', value: 212, percent: '1 ' },
    { name: '辐射卡', value: 65, percent: '58' },
    { name: '设施自巡查', value: 764, percent: '11 ' }
]
const chartOption = {
        grid: {
            top: 0,
            left: '1%',
            bottom: '1%',
            right: '1%'
        },
        color: ['#3babff', '#00fc83', '#e8b021', '#f56c6c',
'#5D7092'],
        legend: {
            type: 'scroll',
            orient: 'vertical',
            right: '0%',
            left: '40%',
            top: 'center',
            itemWidth: 10,
            itemHeight: 10,
            icon: 'rect',
            itemGap: 15,// 多个图例之间的距离
            data: val,
            formatter: (name: string) => {
                for (let i = 0; i < val.length; i++) {
                    if (name === val[i].name) {
                        const richText = `{name|${name}}{nums|${val[i].value + '/'}}{percent|${val[i].percent}%}`
                        return richText
                    }
                }
            },
            textStyle: {
                rich: {
                    name: {
                        fontSize: 12,
                        padding: [0, 0, 0, 0],
                        color: '#303133',
                        overflow: 'hidden',
                        textOverflow: 'ellipsis',
                        whiteSpace: 'nowrap'
                    },
                    nums: {
                        fontSize: 12,
                        fontWeight: 700,
                        padding: [0, 0, 0, 0],
                        color: '#303133',
                        width: 50,
                        fontFamily: 'FjallaOne',
                        align: 'right',
                    },
                    percent: {
                        fontSize: 12,
                        fontFamily: 'FjallaOne',
                        fontWeight: 700,
                        padding: [0, 0, 0, 0],
                        align: 'right',
                        color: '#303133'
                    }
                }
            }
        },
        tooltip: {
            trigger: 'item',
            formatter: (params:any) => {
                const {
                    data: { name, value, percent }
                } = params
                return `${params.marker}${name}:${value}/${percent}%`
            }
        },
        // graphic: [ // 设置饼图中间文字内容
        //     {
        //         type: 'text',
        //         left: 80, // center不行 因为会飞到整个div的中间
        //         top: 75,
        //         style: {
        //             text: 'dd',
        //             textAlign: 'center',
        //             fill: '#f5f5f5',
        //             fontSize: 32,
        //             fontFamily: 'Bebas Neue'
        //         }
        //     }
        // ],
        series: [
            {
                name: '企业档案',
                type: 'pie',
                center: ['18%', '50%'],
                radius: ['60%', '85%'],
                avoidLabelOverlap: true,
                hoverAnimation: false,
                data: val,
                itemStyle: {
                    normal: {
                        label: {
                            show: false
                        },
                        labelLine: {
                            show: false
                        }
                    }
                }
            }
        ]
    }
油表
简洁油表

const data = {
    complete: 5,
    total: 15
}
const option = {
    title: {
        text: '问题整改',
        left: 40,
        textStyle: {
            color: 'white',
            fontSize: '18'
        }
    },
    tooltip: {
        formatter: '{a} {b}:  ' + ((data.complete / data.total) *
100).toFixed(1) + '%',
        position: 'left'
    },
    series: [
        {
            name: '问题整改完成率',
            type: 'gauge',
            center: ['50%', '70%'], // 左右 上下 仪表位置
            radius: '90%', //仪表大小
            detail: { show: false, formatter: '{value}%' },
            data: [{ value: data.complete }],
            // startAngle: 210, // 仪表盘起始角度,默认 225。圆心正右手侧为0度,正上方为90度,正左手侧为180度。
            // endAngle: -30, // 仪表盘结束角度,默认 -45
            min: 0, // 最小的数据值,默认 0 。映射到 minAngle。
            max: data.total, // 最大的数据值,默认 100 。映射到maxAngle。
            splitNumber: 2, // 仪表盘刻度的分割段数,默认 10。
            axisLine: {
                lineStyle: {
                    width: 10, // 这个是修改宽度的属性
                    color: [
                        [data.complete / data.total, '#00E87E'],
                        [1, 'rgb(91, 107, 113)']
                    ]
                }
            },
            axisTick: {
                splitNumber: 4, // 分隔线之间分割的刻度数,默认 5。
                length: 4, // 刻度线长。支持相对半径的百分比,默认 8。
                lineStyle: {
                    // 刻度线样式。
                    color: 'rgba(255,255,255,0.6)' //线的颜色,默认#eee。
                }
            },
            axisLabel: {
                formatter: function (v) {
                    return v.toFixed(0)
                }
            },
            splitLine: {
                length: 20,
                lineStyle: {
                    color: 'rgba(255,255,255,0.6)'
                }
            },
            pointer: {
                length: '60%',
                width: 4
            }
        }
    ]
}
水球图
需求按照依赖

const option = {
    title: {
        text: '小型水库',
        left: '20%',
        top: '23%',
        textStyle: {
            fontWeight: 'normal',
            fontSize: 16,
            fontFamily: 'TRENDS',
            color: 'rgba(255, 255, 255, 0.8)'
        }
    },
    series: [
        {
            type: 'liquidFill',
            radius: '92%',
            center: [
                '50%',
                '50%'
            ],
            data: [0.5, 0.5, 0.5],
            borderWidth: 0,
            outline: {
                show: true,
                borderDistance: 4,
                itemStyle: {
                    color: 'none',
                    borderColor: 'rgba(2, 198, 252, .5)',
                    borderWidth: 2,
                    shadowBlur: 20,
                    shadowColor: 'rgba(0, 0, 0, 0.25)'
                }
            },
            backgroundStyle: {
                color: 'rgba(2,156,252,.2)'
            },
            itemStyle: {
                color: 'rgba(0, 175, 223, 1)'
            },
            label: {
                position: [
                    '50%',
                    '60%'
                ],
                formatter: '50%',
                color: 'white',
                textStyle: {
                    fontFamily: 'Furore',
                    fontSize: 24
                }
            }
        }
    ]
}
参考网站:
https://blog.youkuaiyun.com/fu983531588/article/details/97274041
https://github.com/ecomfe/echarts-liquidfill#api


 被折叠的 条评论
为什么被折叠?
被折叠的 条评论
为什么被折叠?
 到【灌水乐园】发言


