


Prometheus、Grafana 和 Alertmanager 是构建现代监控系统的三大核心组件,它们协同工作可以实现完整的监控、可视化和告警流程。
组件介绍:
-
Prometheus:核心监控引擎,负责数据采集、存储和查询
- 采用时序数据库存储监控指标
- 通过 Pull 方式主动抓取目标服务的监控数据
- 提供 PromQL 查询语言进行数据查询和分析
-
Grafana:可视化平台,用于创建监控仪表盘
- 支持多种数据源,尤其对 Prometheus 有良好支持
- 提供丰富的图表类型和可视化组件
- 支持告警配置和通知
-
Alertmanager:告警管理组件
- 处理 Prometheus 产生的告警
- 支持告警聚合、分组、路由
- 提供多种通知方式(邮件、Slack 等)
- node_exporter:收集服务器参数指标
- 部署在被监控服务器上,收集 CPU、内存、磁盘、网络等系统指标
- process-exporter:进程级别监控
- 监控进程的工具,它可以根据配置跟踪特定进程的资源使用情况
基本工作流程:
- 采集:node_exporter/process_exporter 生成系统 / 进程指标并暴露接口。
- 存储:Prometheus 定期抓取指标,存储为时序数据。
- 可视化:Grafana 从 Prometheus 查询数据,生成监控仪表盘。
- 告警:Prometheus 触发告警规则,Alertmanager 处理并发送通知。
搭建:
prometheus-2.27.1.linux-amd64.tar.gz
grafana-6.7.3-1.x86_64.rpm
Grafana-Chinese-master.tar(Grafana的中文包)
alertmanager-0.27.0.linux-amd64.tar.gz
node_exporter-1.2.0.linux-amd64.tar.gz
process-exporter-0.8.7.linux-amd64.tar.gz(可选)
一搭建prometheus
[root@SD-salog9 ywsdru]# ls -l prometheus-2.27.1.linux-amd64.tar.gz
-rw-r----- 1 ywsdru ywsdru 69491886 Sep 15 15:49 prometheus-2.27.1.linux-amd64.tar.gz
[root@SD-salog9 ywsdru]# tar -xvf prometheus-2.27.1.linux-amd64.tar.gz -C /usr/local/[root@SD-salog9 local]# cd /usr/local/
[root@SD-salog9 local]# mv prometheus-2.27.1.linux-amd64 prometheus
解压改名完成后,来编译主机清单,创建prometheus.yml文件
[root@SD-salog9 local]# cd prometheus/
[root@SD-salog9 prometheus]# vi prometheus.yml
prometheus.yml:
# my global config
global:
scrape_interval: 60s
evaluation_interval: 60s
# scrape_timeout is set to the global default (10s).# Alertmanager configuration
alerting:
alertmanagers:
- static_configs:
- targets:
- localhost:9093# Load rules once and periodically evaluate them according to the global 'evaluation_interval'.
rule_files:
# - "first_rules.yml"
# - "second_rules.yml"
- "rules/disk.rules.yml" #这里的规则选择rules下的disk.rules.yml# A scrape configuration containing exactly one endpoint to scrape:
# Here it's Prometheus itself.
scrape_configs:
# The job name is added as a label `job=<job_name>` to any timeseries scraped from this config.
- job_name: 'prometheus'# metrics_path defaults to '/metrics'
# scheme defaults to 'http'.static_configs:
# - targets: ['localhost:9090'] # 监控Prometheus自身(已注释)
- targets: ['192.168.66.2:9100']
labels:
instance: SD-caiji1 #一个instance对应一个主机监控指标,这里的9100端口是node_exporter的端口
- targets: ['192.168.66.12:9100']
labels:
instance: SD-caiji2
- targets: ['192.168.66.13:9100']
labels:
instance: SD-caiji3
- targets: ['192.168.66.14:9100']
labels:
instance: SD-caiji4
- targets: ['192.168.66.15:9100']
labels:
instance: SD-caiji5
- targets: ['192.168.66.16:9100']
labels:
instance: SD-caiji6
- targets: ['192.168.66.17:9100']
labels:
instance: SD-caiji7- targets: ['192.168.66.24:9256']
labels:
instance: SD-caiji14#后面不一一列举,有多少要监控的主机加到后面就可以,另外,如果你还有process_exporter,则需要另外加9256端口,上面举例了。
创建告警规则文件:
/usr/local/prometheus/rules/disk.rules.yml
groups:
- name: 磁盘使用率告警规则
rules:
# fxlog1-10(/data*,阈值98%)
- alert: fxlog磁盘使用率过高
expr: 100 - (node_filesystem_avail_bytes{instance=~"SD-fxlog([1-9]|10)", mountpoint=~"/data.*"} / node_filesystem_size_bytes{instance=~"SD-fxlog([1-9]|10)", mountpoint=~"/data.*
"} * 100) > 98
for: 5m
labels:
severity: critical
server_group: fxlog
annotations:
summary: "{{ $labels.instance }} 磁盘使用率过高"
description: "{{ $labels.instance }} 的 {{ $labels.mountpoint }} 使用率达 {{ $value | printf \"%.2f\" }}%,超阈值98%"# caiji1-18(/mnt,阈值98%)
- alert: caiji磁盘使用率过高
expr: 100 - (node_filesystem_avail_bytes{instance=~"SD-caiji([1-9]|1[0-8])", mountpoint="/mnt"} / node_filesystem_size_bytes{instance=~"SD-caiji([1-9]|1[0-8])", mountpoint="/mnt
"} * 100) > 98
for: 2m
labels:
severity: critical
server_group: caiji
annotations:
summary: "{{ $labels.instance }} 磁盘使用率过高"
description: "{{ $labels.instance }} 的 {{ $labels.mountpoint }} 使用率达 {{ $value | printf \"%.2f\" }}%,超阈值98%"# salog1-19(/data*,阈值98%)
- alert: salog磁盘使用率过高
expr: 100 - (node_filesystem_avail_bytes{instance=~"SD-salog([1-9]|1[0-9])", mountpoint=~"/data.*"} / node_filesystem_size_bytes{instance=~"SD-salog([1-9]|1[0-9])", mountpoint=~
"/data.*"} * 100) > 98
for: 2m
labels:
severity: critical
server_group: salog
annotations:
summary: "{{ $labels.instance }} 磁盘使用率过高"
description: "{{ $labels.instance }} 的 {{ $labels.mountpoint }} 使用率达 {{ $value | printf \"%.2f\" }}%,超阈值98%"
然后就可以启动你的Prometheus了,启动方式如下
在/usr/local/prometheus目录下
nohup ./prometheus --config.file=/usr/local/prometheus/prometheus.yml &
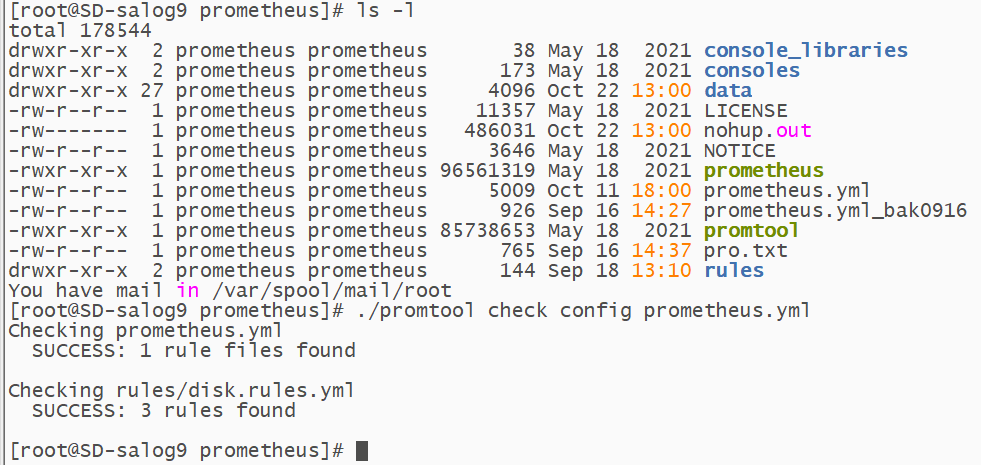
启动完成后,如果没有其它问题,通过命令查看端口是否正常监听

如果无法正常启动,先排查是否是配置文件格式错误导致,可以只用Prometheus自带的工具来check。如果都是success就不是配置的问题,考虑权限或者其它因素。
一切正常后,可以通过浏览器访问Prometheus了
访问方式:ip:端口
比如:192.168.10.1:9090
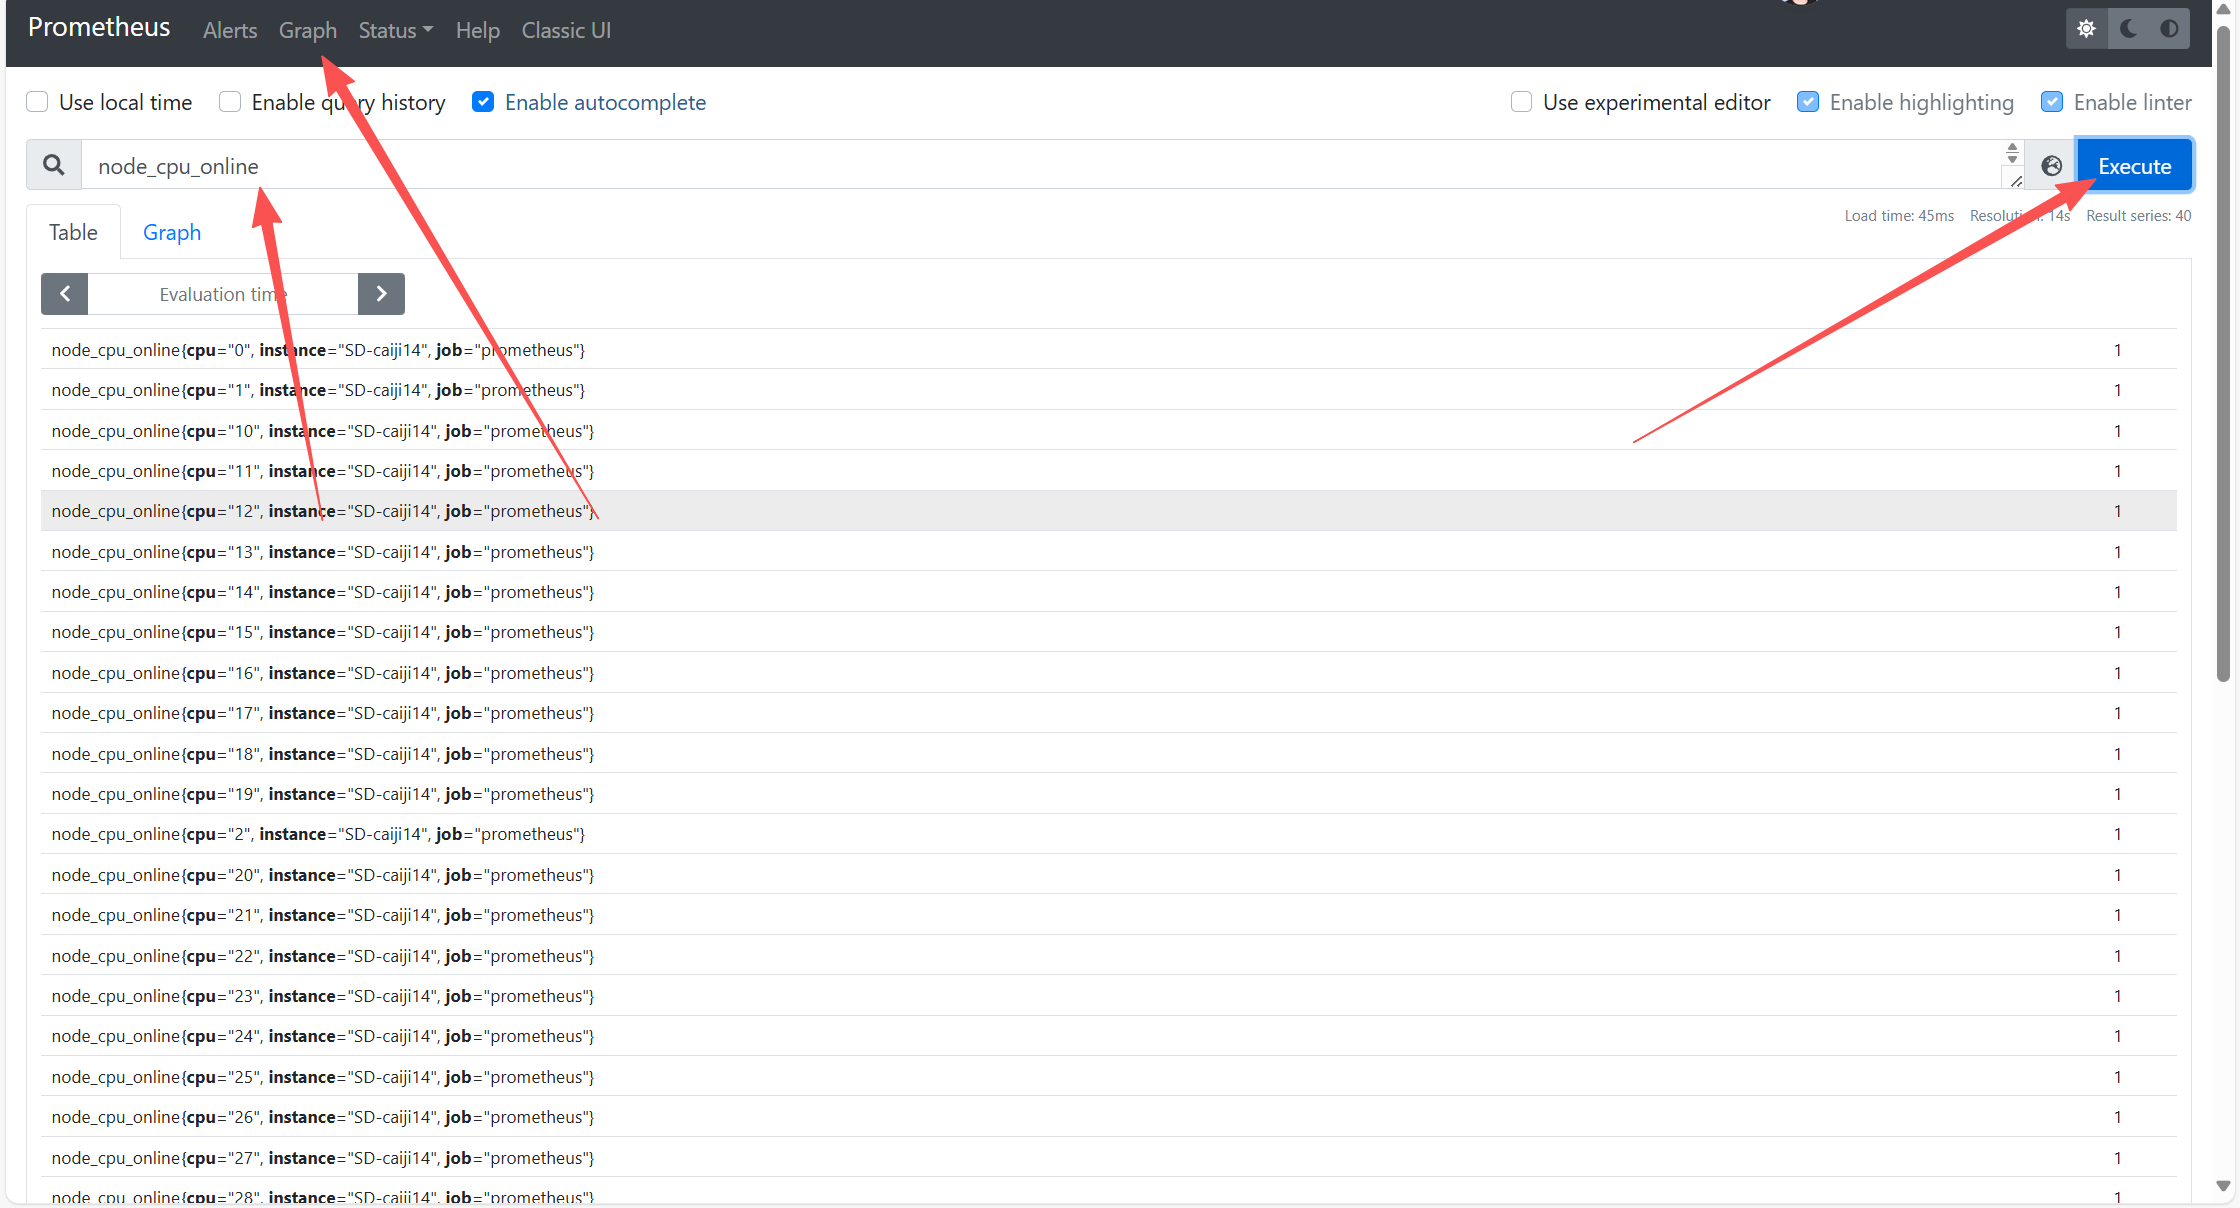
通过Grapth下的关键参数来搜索,可以查看到有相关主机的数据,如果没有数据,查看是否有防火墙阻挡,如果有,放行策略。最小化放行
二 Grafana部署
由于grafana是一个rpm包,所以我们通过rpm的方式来安装
rpm -ivh grafana-6.7.3-1.x86_64.rpm
启动方式:
systemctl start grafana-server
systemctl enable grafana-server #设置为开机自启
查看是否正常启动
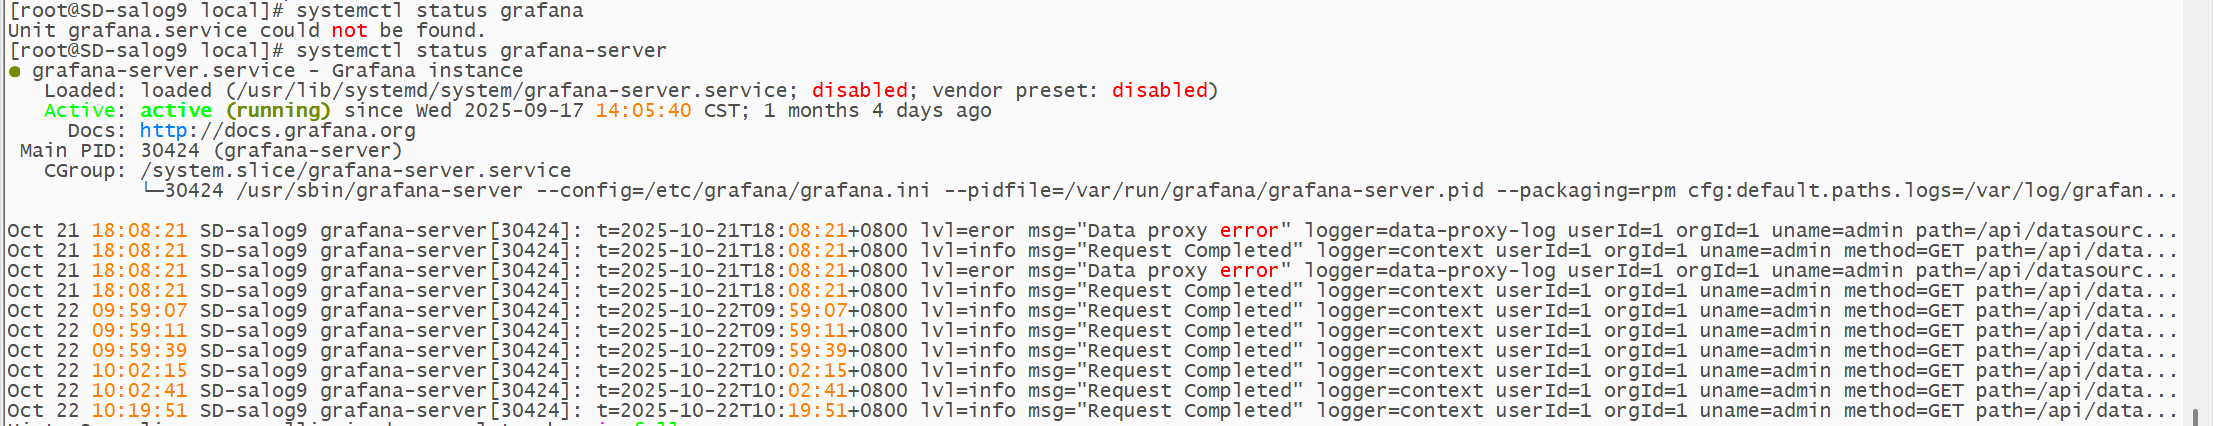
查看端口是否正常监听

同Prometheus一样,通过ip+端口来访问grafana
192.168.10.1:3000
初次登录的账号密码都是admin,首次登录必须修改密码。
搭建中文包
解压中文包放在一个位置
tar -xvf Grafana-Chinese-master.tar -C /usr/local/
进入目录发现有几个文件
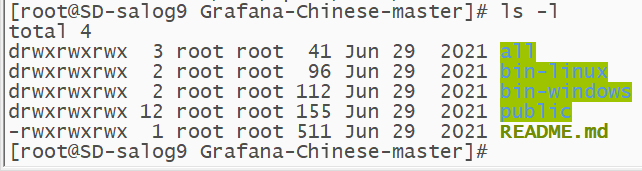
这里是已经编译好的直接下载后替换掉对应的bin和public文件即可
grafana的默认位置在/usr/share/grafana,如果没有,find找一下
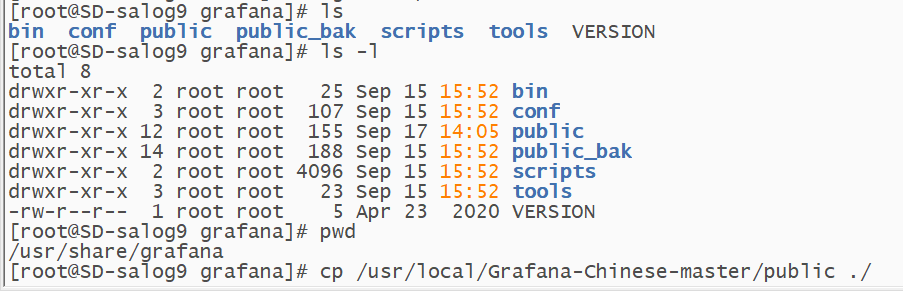
替换掉之后,再去web查看grafana的界面就变成中文的了,如果没变,考虑重启grafana或者兼容性问题。
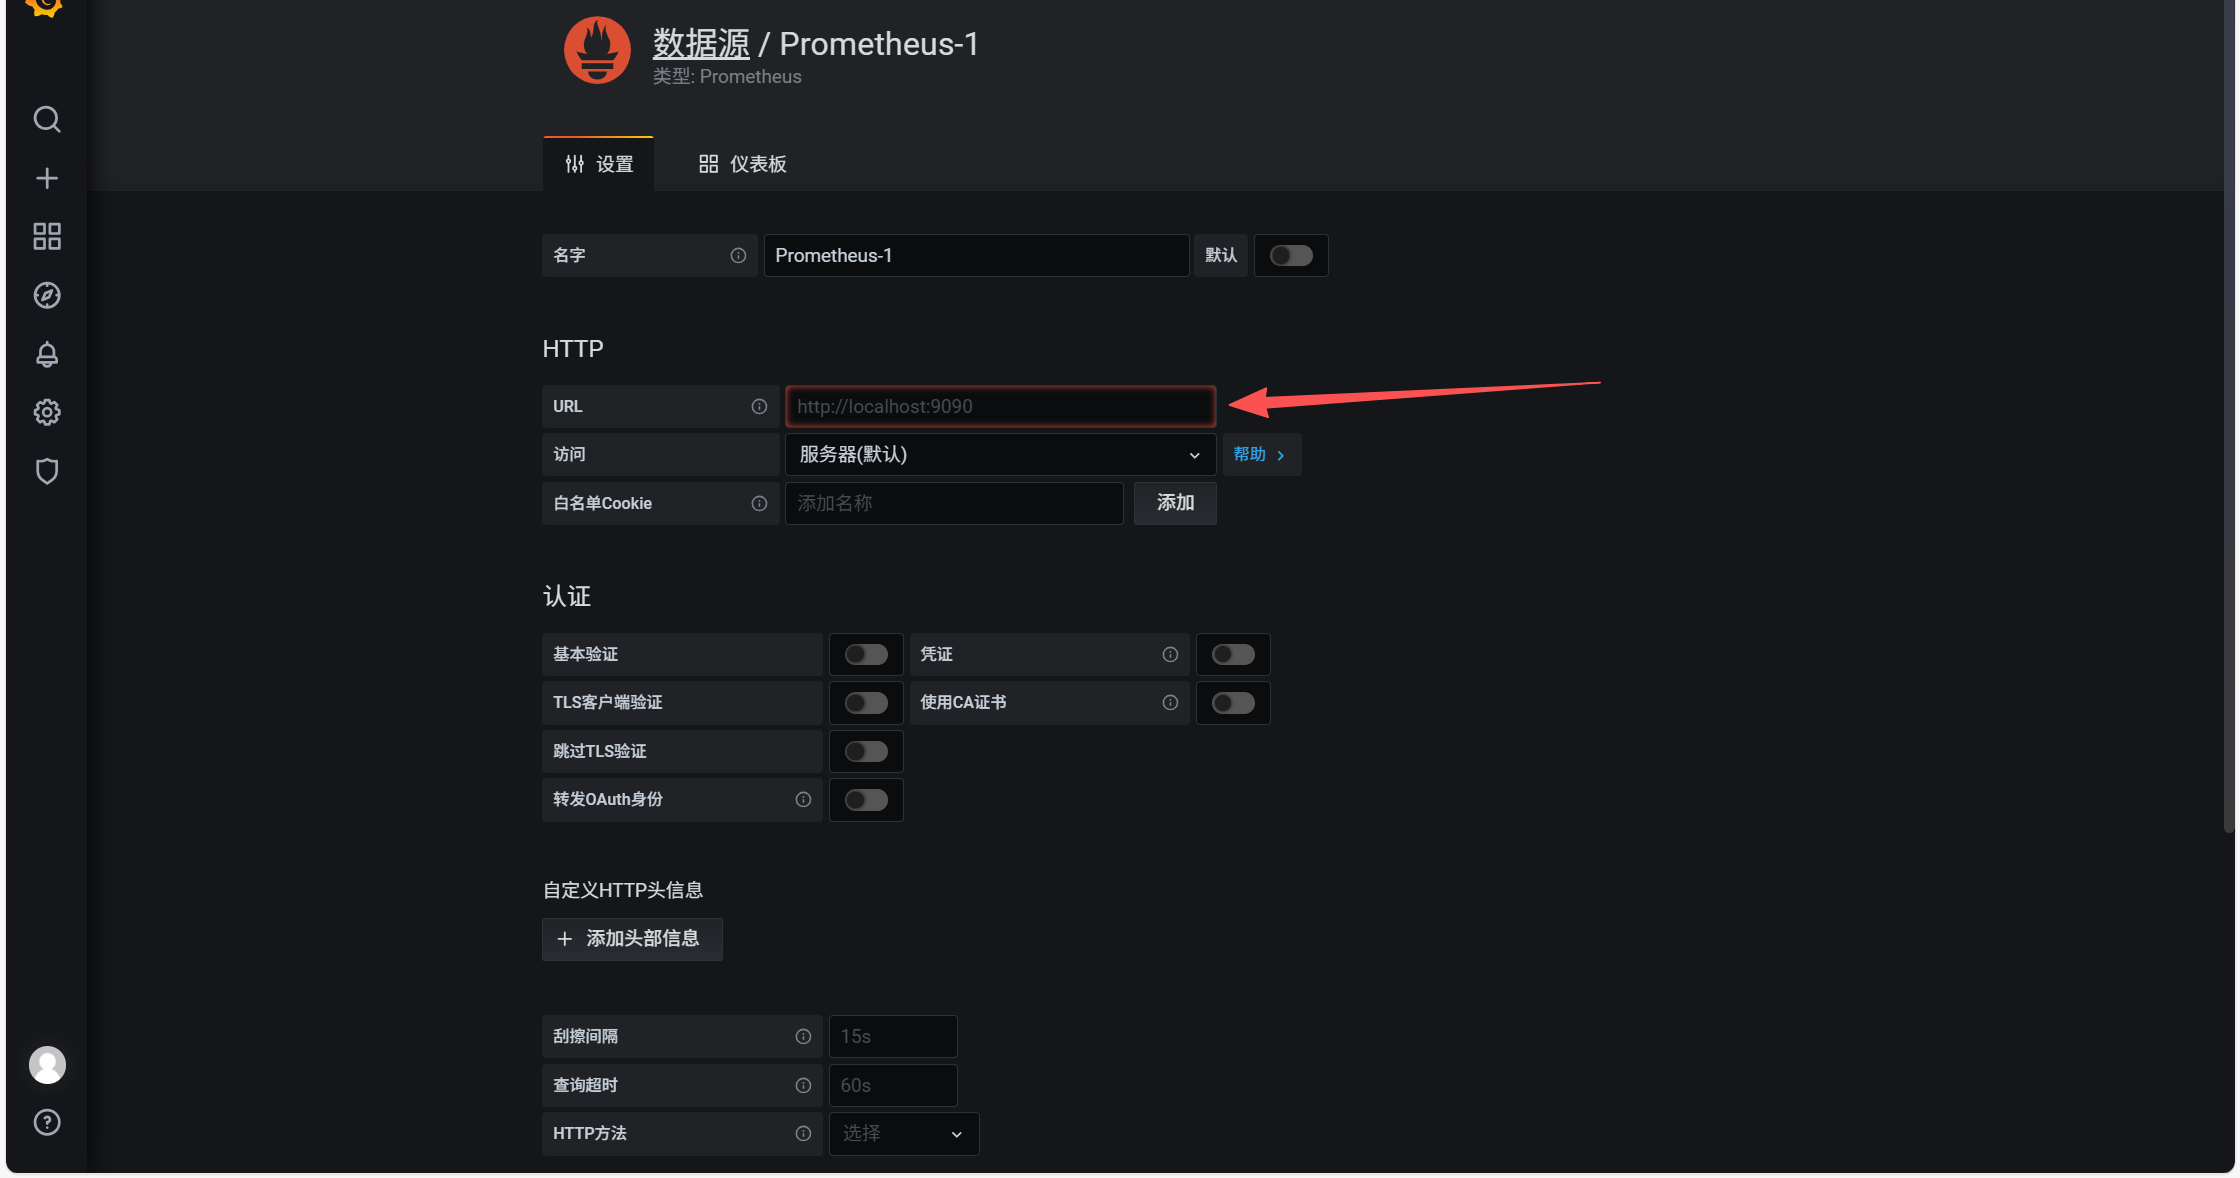
grafana添加Prometheus数据源
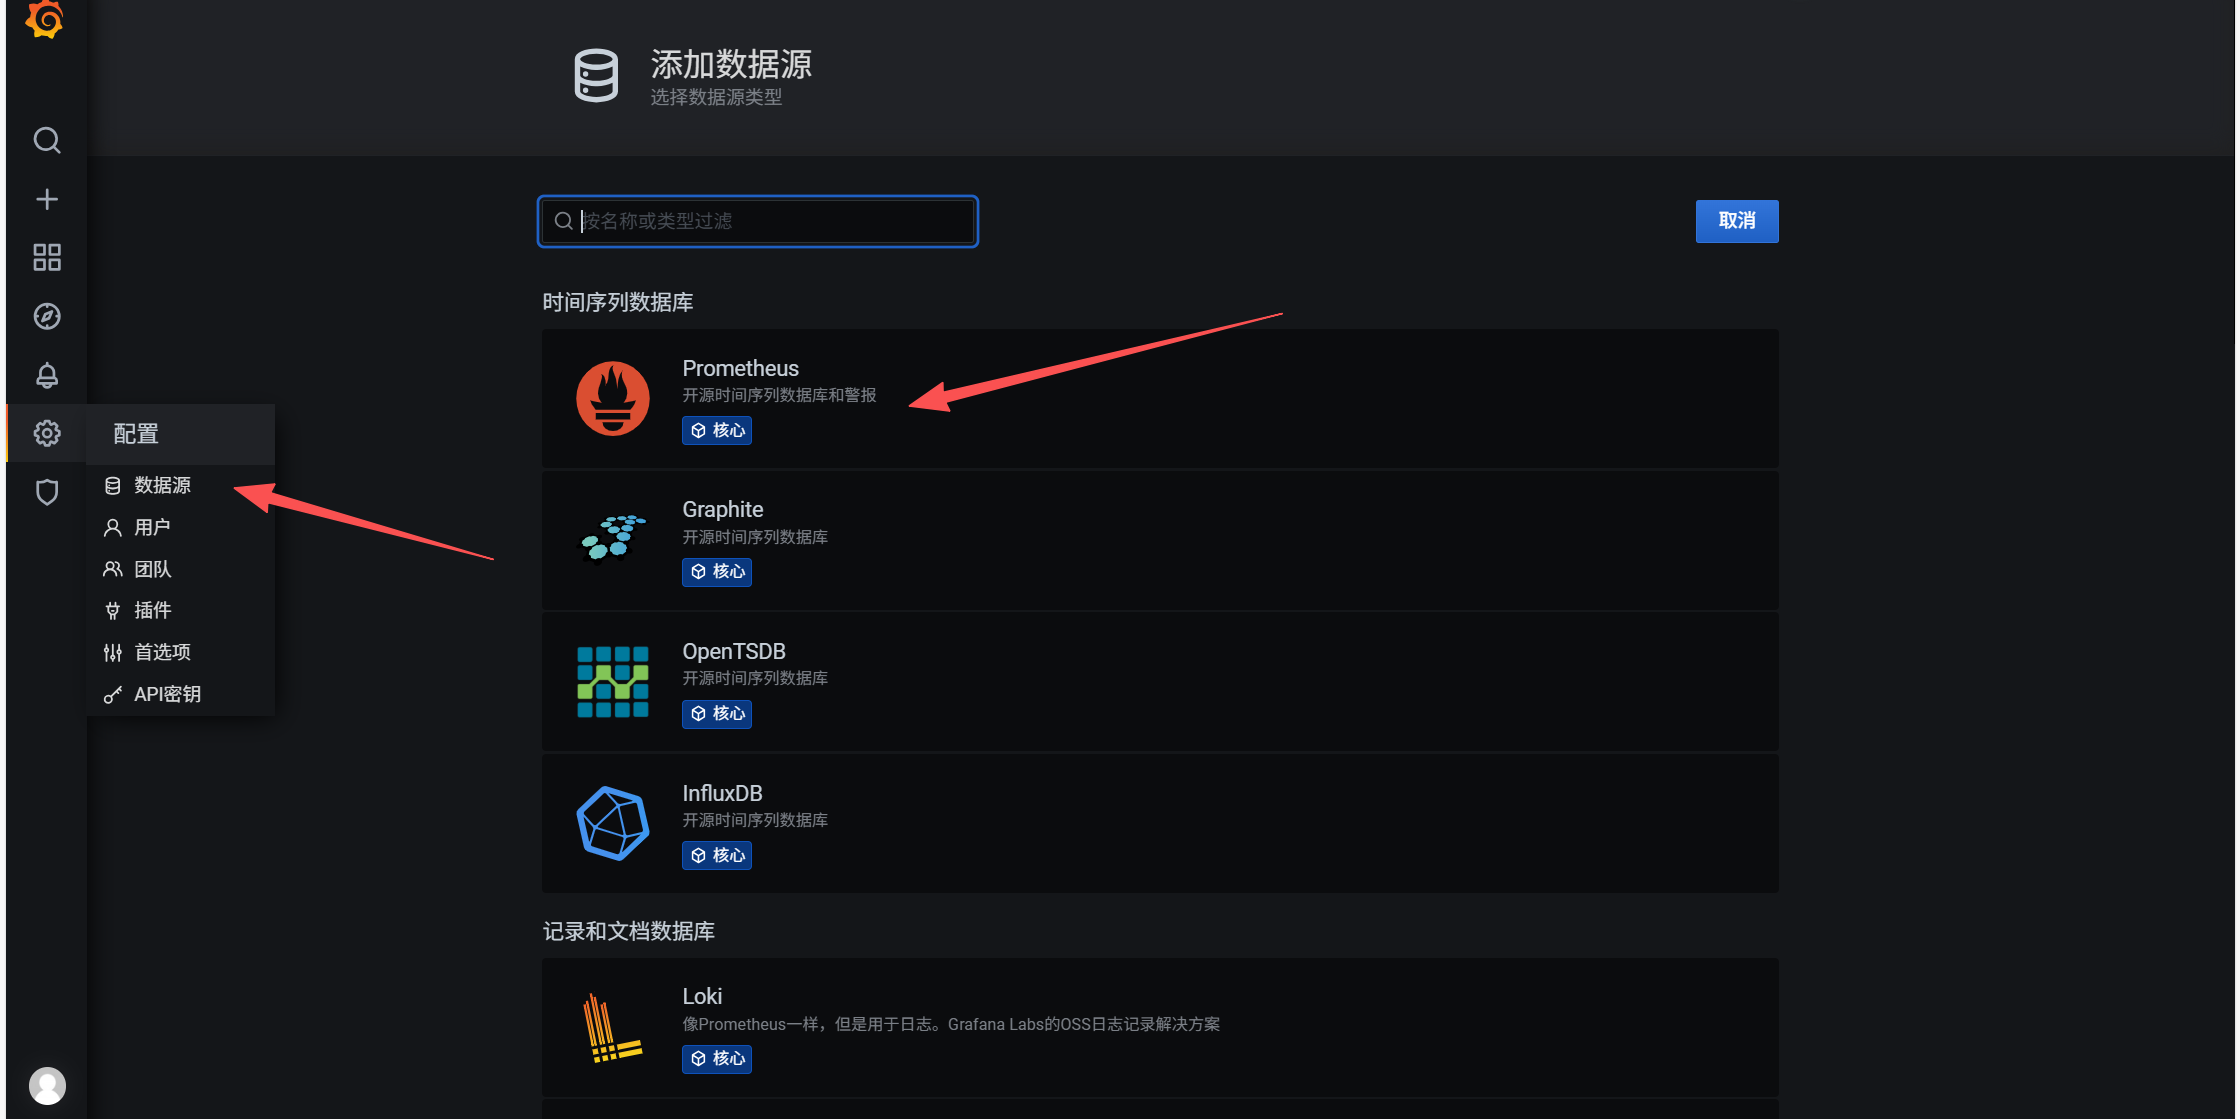
url选择你Prometheus的url地址,然后最下方有保存测试按钮,绿色就没问题。
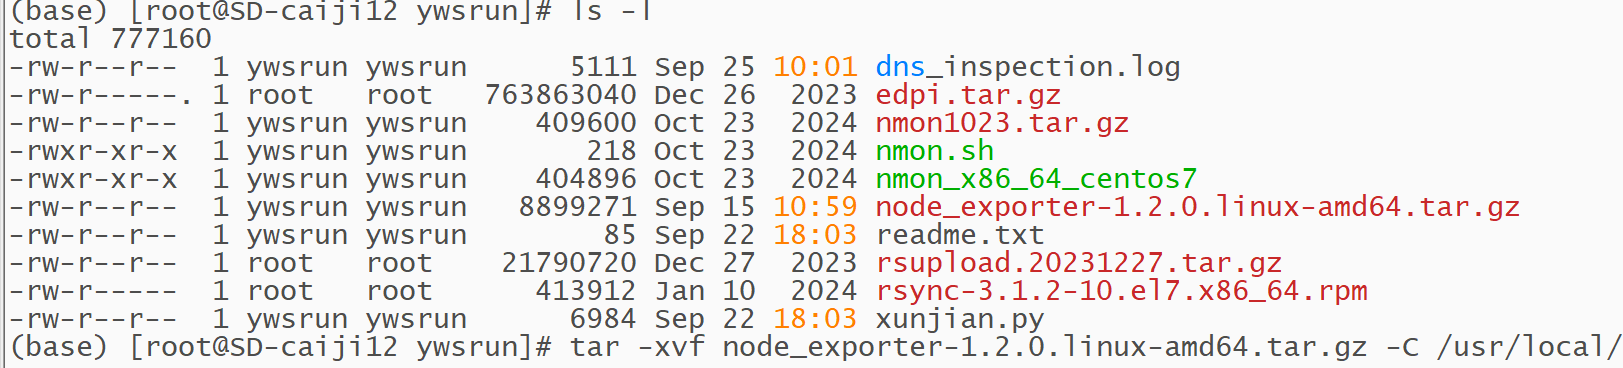
三 node_exporter
这个没什么好说的,解压完启动就行
搭建采集指标在被监控主机上


然后测试联通性,通过telnet访问9100端口,查看是否正常
用我的pro+gra的服务器访问被监控服务器的9100端口,可以成功访问。
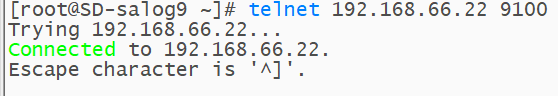
如果无法访问,查看防火墙或者网络问题排查,这里不再详细说明。
添加策略:
firewall-cmd --permanent --zone=public --add-rich-rule='rule family="ipv4" source address="192.168.10.1" port port="9100" protocol="tcp" accept'
firewall-cmd --reload
表示给我的pro+gra服务器放开我的9100端口,然后重新读取配置。保持最小化放行原则,尽量不要关闭防火墙。
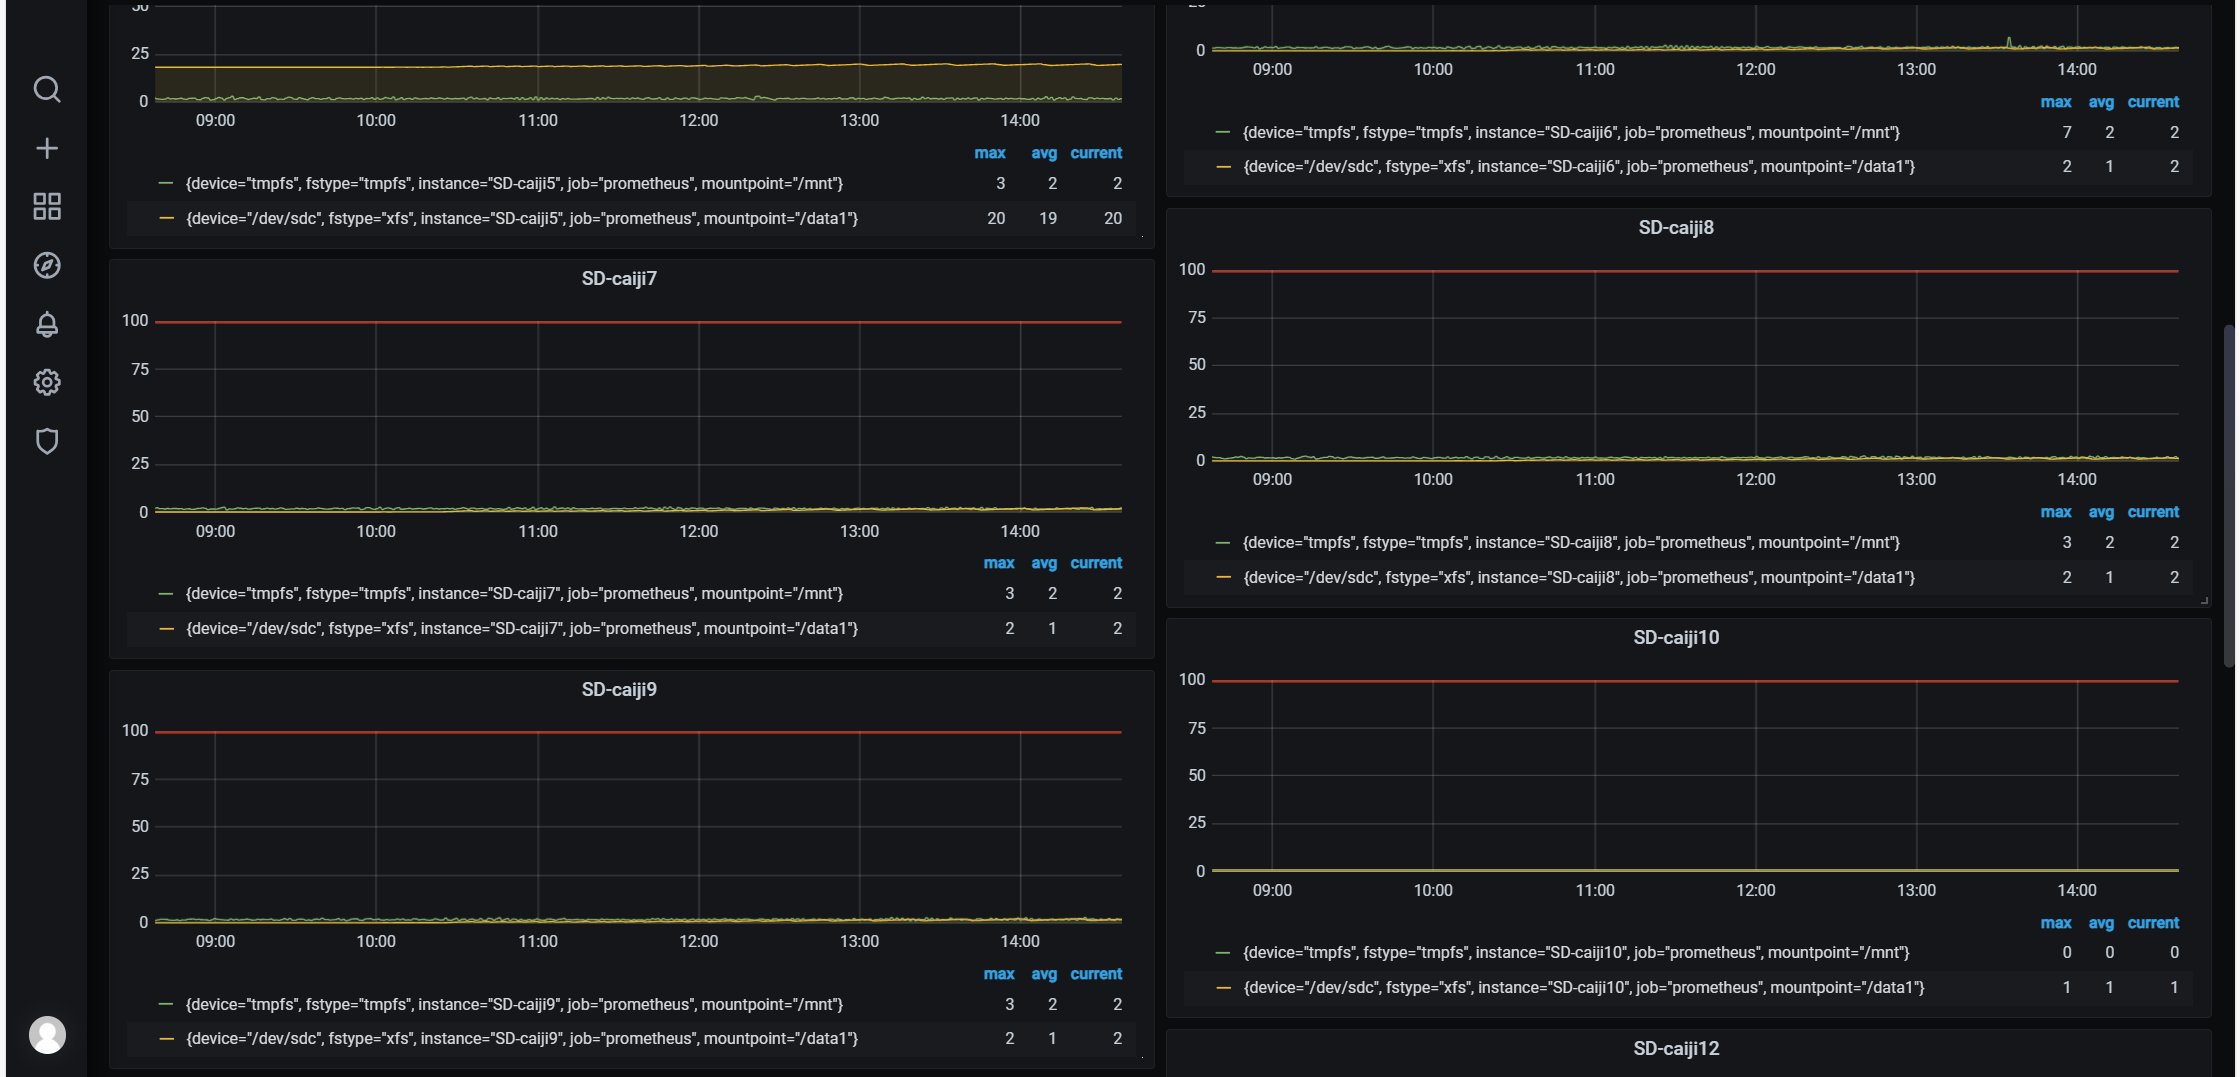
四 绘图
新建仪表盘
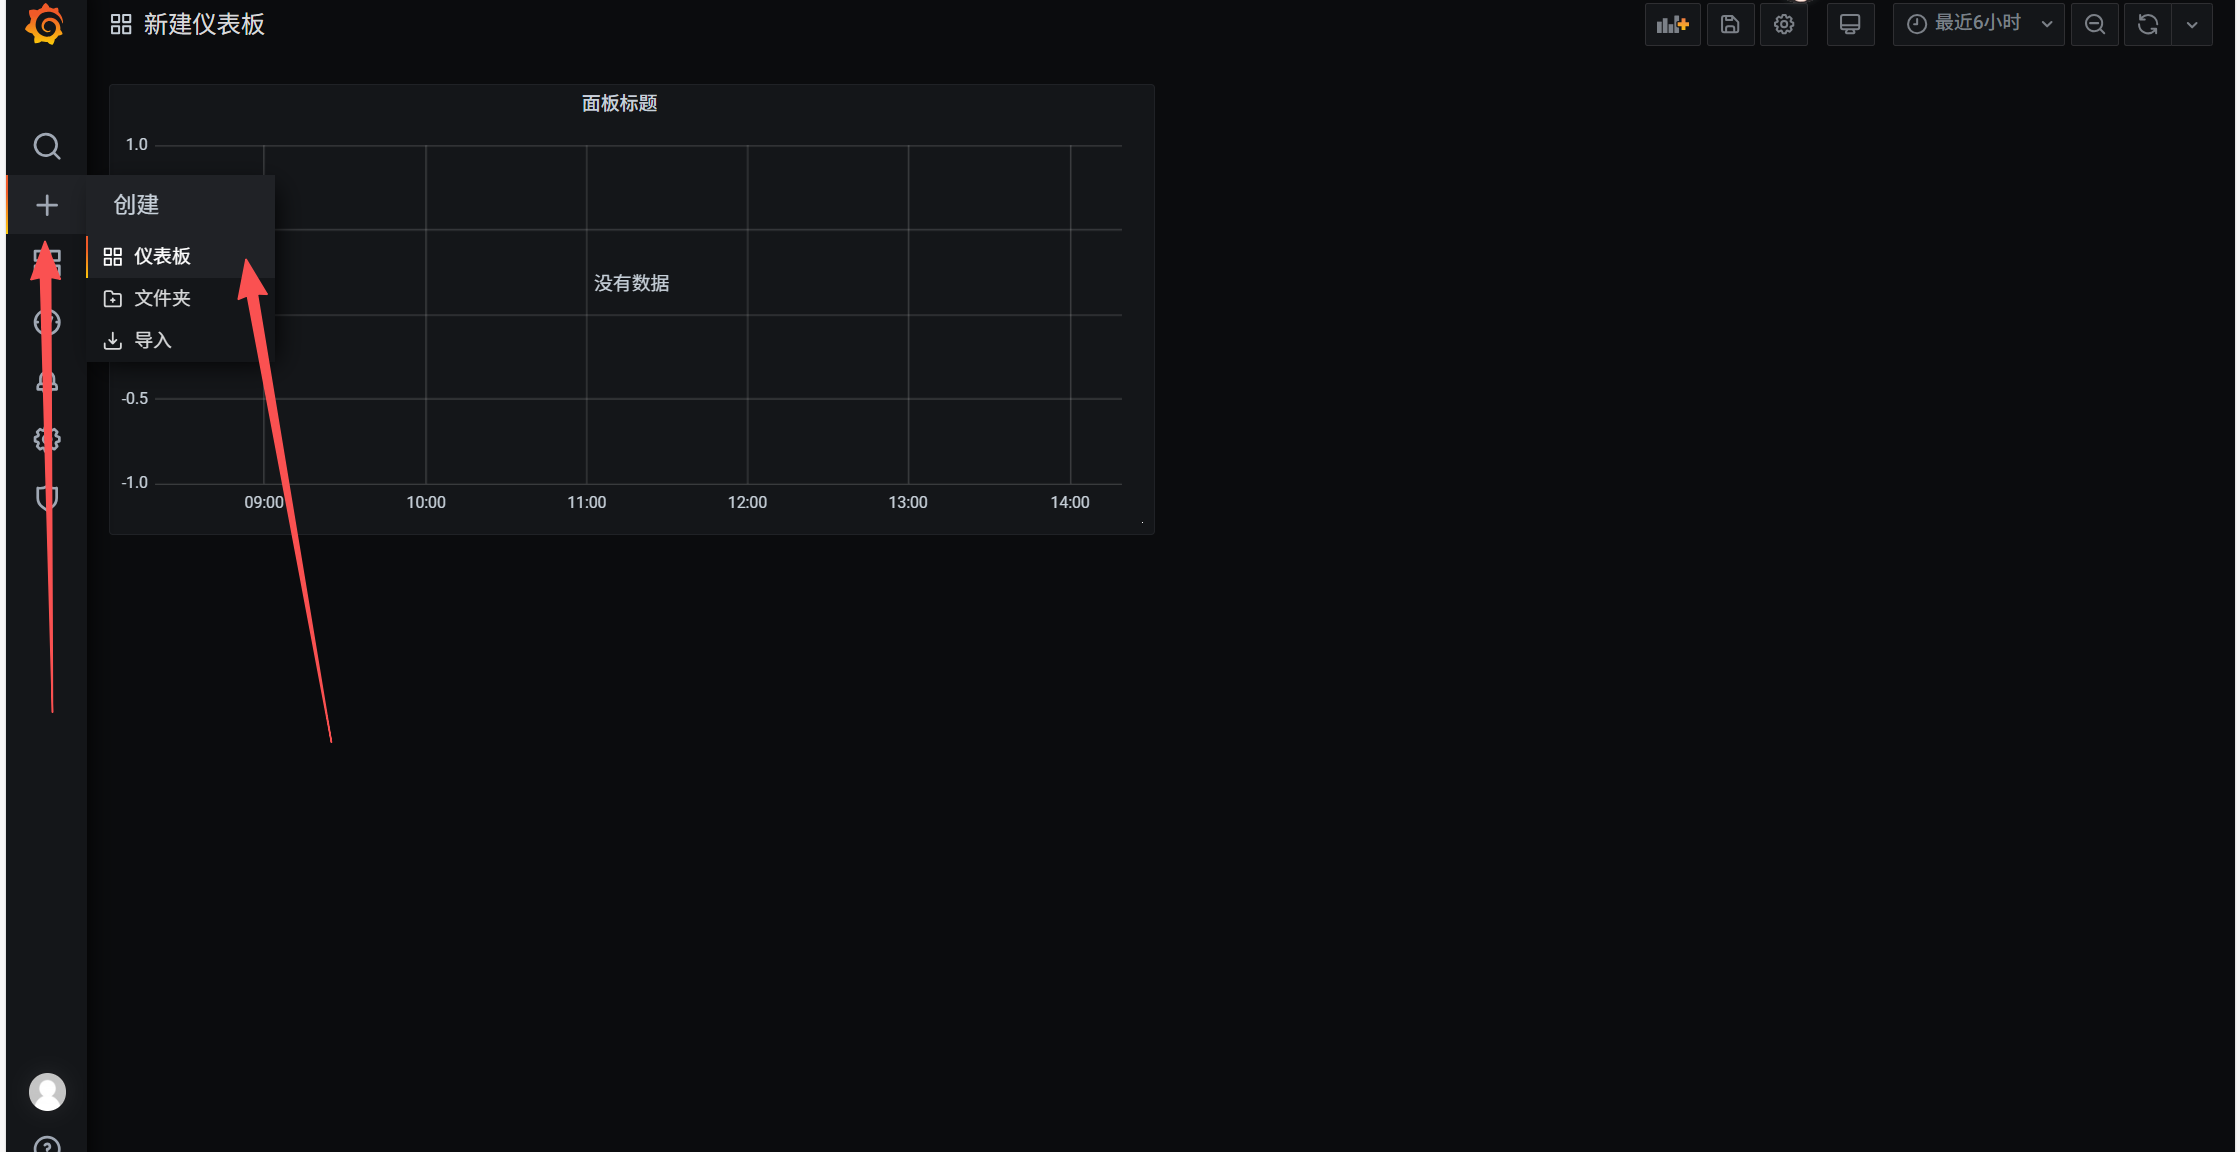
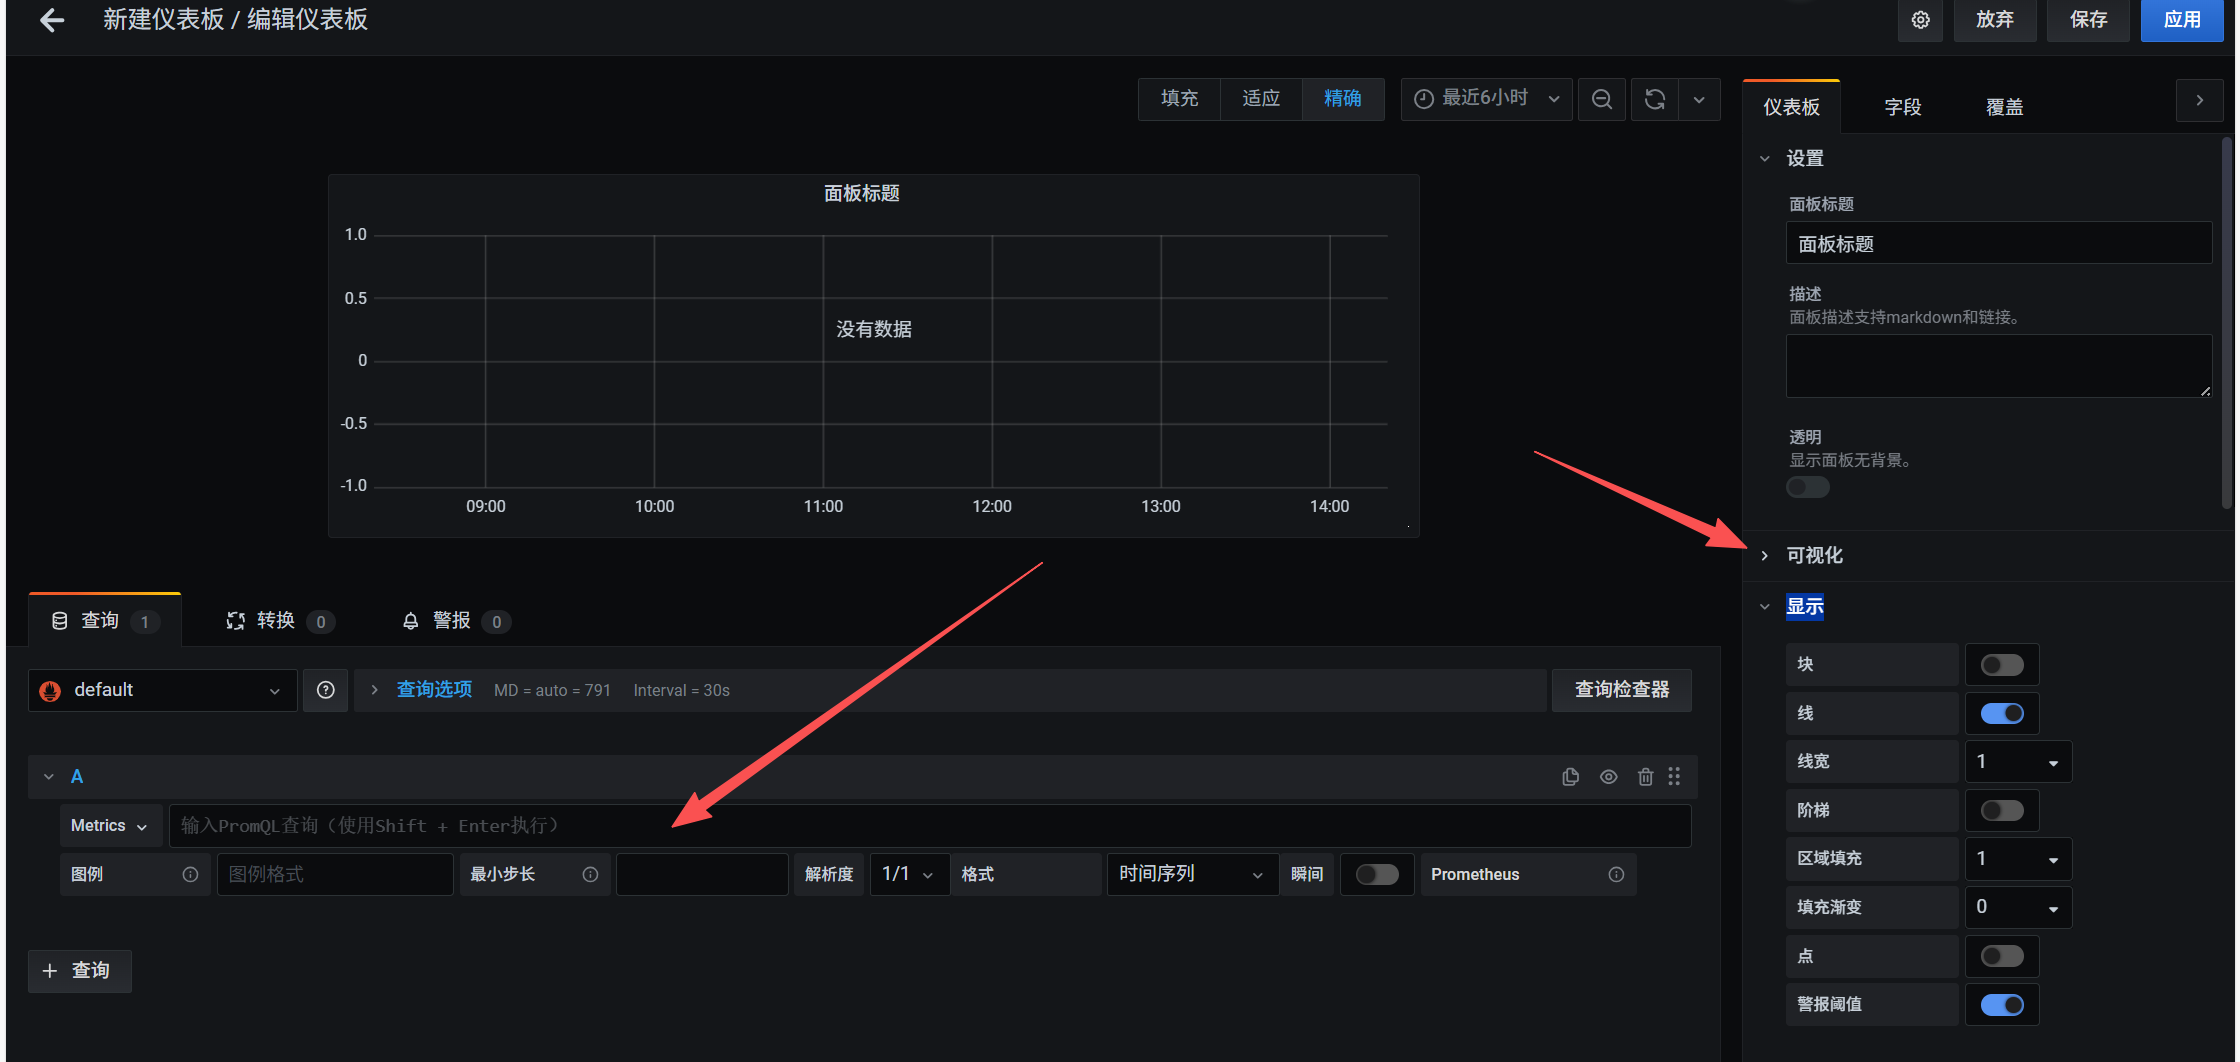
查询表达式写你想要查询的数据
比如我这里想看服务器的/mnt占用信息,右边丰富自己的仪表盘,很多功能,自己去研究吧。额外注意一点,查询表达式里的instance一定要和prometheus.yml里一致才可以查询到。如果没有数据,拿着表达式去Prometheus里去查,一步步排查问题。
查看硬盘占用
100 - (
node_filesystem_avail_bytes{
instance="SD-caiji3",
mountpoint="/mnt"
}
/
node_filesystem_size_bytes{
instance="SD-caiji3",
mountpoint="/mnt"
}
* 100
)
查看一分钟负载
node_load1{instance="SD-fxlog3"}
cpu使用率
100 - ( avg(irate(node_cpu_seconds_total{ instance="SD-caiji3", mode="idle" }[5m])) * 100 )
带宽使用率
( irate(node_network_receive_bytes_total{ instance="SD-caiji3", device="eth0" }[5m]) / node_network_speed_bytes{ instance="SD-caiji3", device="eth0" } * 100 )
等等,自己去研究。
五 告警
同理,把alertmanager的包解压出来放在/usr/local下,也可以放在其它位置
创建yml文件
/usr/local/alertmanager/alertmanager.yml
global:
smtp_smarthost: 'smtp.qq.com:587'
smtp_from: 'xxx监控告警系统'
smtp_auth_username: 'xxx@qq.com' #发件人邮箱,我这里是qq
smtp_auth_password: 'xxx' #发件人邮箱码,需要在邮箱里开启pop3
smtp_require_tls: true
smtp_hello: 'qq.com'route:
group_by: ['alertname', 'server_group', 'instance']
group_wait: 10s
group_interval: 30m
repeat_interval: 2h
receiver: 'foxmail'receivers:
- name: 'foxmail'
email_configs:
- to: 'xxx@.com' #收件人
send_resolved: true
headers:
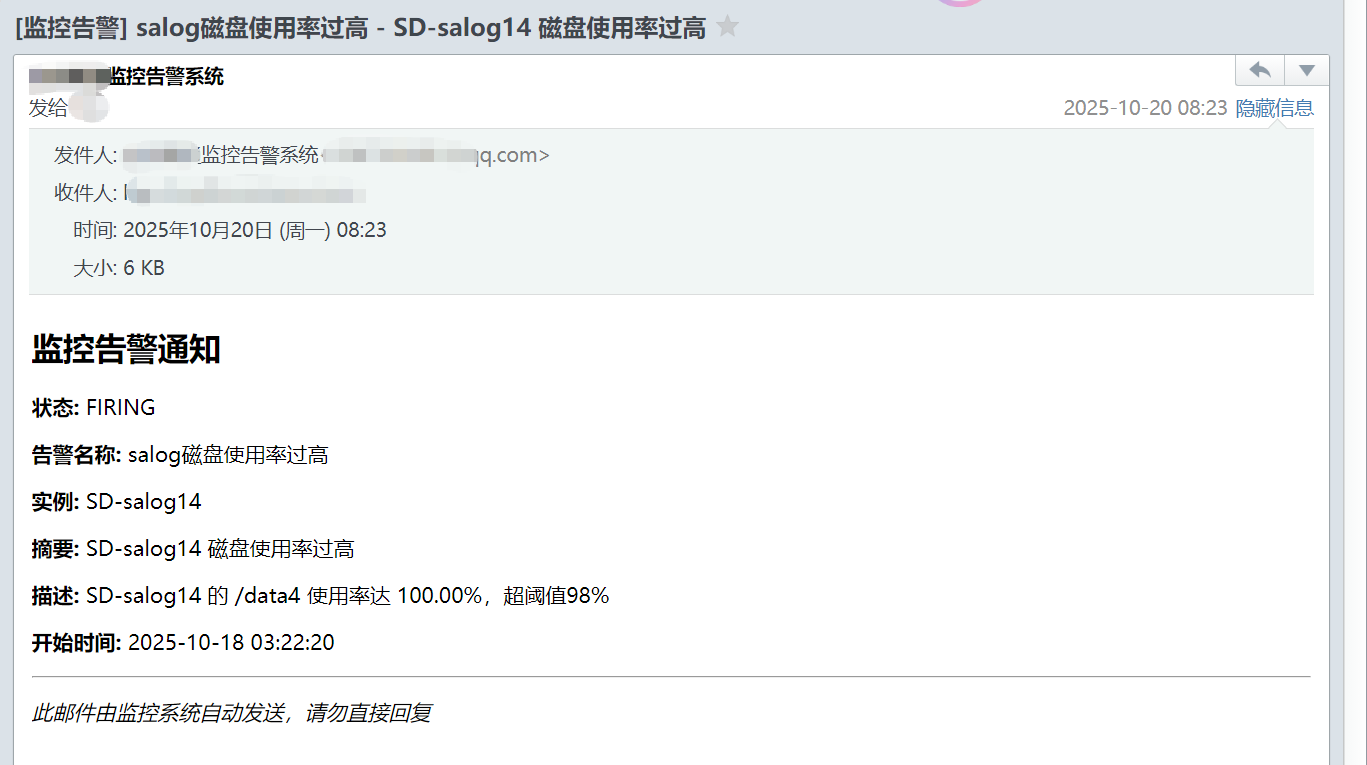
Subject: '[监控告警] {{ .GroupLabels.alertname }} - {{ .CommonAnnotations.summary }}'
html: |
<!DOCTYPE html>
<html>
<body>
<h2>监控告警通知</h2>
<p><strong>状态:</strong> {{ .Status | toUpper }}</p>
<p><strong>告警名称:</strong> {{ .GroupLabels.alertname }}</p>
<p><strong>实例:</strong> {{ .GroupLabels.instance }}</p>
<p><strong>摘要:</strong> {{ .CommonAnnotations.summary }}</p>
<p><strong>描述:</strong> {{ .CommonAnnotations.description }}</p>
<p><strong>开始时间:</strong> {{ (index .Alerts 0).StartsAt.Format "2006-01-02 15:04:05" }}</p>
{{ if eq .Status "resolved" }}
<p><strong>解决时间:</strong> {{ (index .Alerts 0).EndsAt.Format "2006-01-02 15:04:05" }}</p>
{{ end }}
<hr>
<p><em>此邮件由监控系统自动发送,请勿直接回复</em></p>
</body>
</html>- to: 'xxx@xxx.com' #收件人2,如果有多个,照着往下复制即可
send_resolved: true
headers:
Subject: '[监控告警] {{ .GroupLabels.alertname }} - {{ .CommonAnnotations.summary }}'
html: |
<!DOCTYPE html>
<html>
<body>
<h2>监控告警通知</h2>
<p><strong>状态:</strong> {{ .Status | toUpper }}</p>
<p><strong>告警名称:</strong> {{ .GroupLabels.alertname }}</p>
<p><strong>实例:</strong> {{ .GroupLabels.instance }}</p>
<p><strong>摘要:</strong> {{ .CommonAnnotations.summary }}</p>
<p><strong>描述:</strong> {{ .CommonAnnotations.description }}</p>
<p><strong>开始时间:</strong> {{ (index .Alerts 0).StartsAt.Format "2006-01-02 15:04:05" }}</p>
{{ if eq .Status "resolved" }}
<p><strong>解决时间:</strong> {{ (index .Alerts 0).EndsAt.Format "2006-01-02 15:04:05" }}</p>
{{ end }}
<hr>
<p><em>此邮件由监控系统自动发送,请勿直接回复</em></p>
</body>
</html>
# 抑制规则
inhibit_rules:
- source_match:
severity: critical
target_match:
severity: warning
equal:
- instance
- mountpoint
- server_group
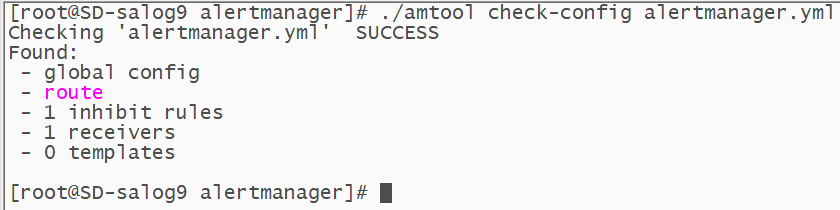
同理,配置完查看配置是否有错误
nohup ./prometheus --config.file=/usr/local/prometheus/prometheus.yml &

查看端口
可以测试发送邮件,这里不在说明。
另外,process_exporter一样,只不过查询表达式不通,比如可以查询当前rsync进程数。这里不在详细说明。


 3万+
3万+

 被折叠的 条评论
为什么被折叠?
被折叠的 条评论
为什么被折叠?
 到【灌水乐园】发言


