


 这篇博客展示了如何利用Echarts库创建一个带有动态效果的饼状图,包括设置图表大小、位置、颜色渐变等细节。通过调整数据值,实现了圆环的30%与70%比例展示,并提供了详细的代码示例。
效果图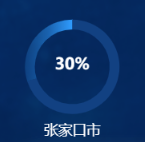
setcharts(box){
            var chartDom = document.getElementById(box);
            var myChart = echarts.init(chartDom);
            var option;
            var option = {
            title: {
                text: '30%',
                subtext:'张家口市',
                x: 'center',
                y: 'center',
                textStyle: {
                    fontSize: 16,
                    color: '#fff',
                    fontFamily: 'Microsoft YaHei',
                    fontWeight: 'bold'
                }, // 标题
                subtextStyle: {
                    fontSize: 14,
                    fontFamily: 'Microsoft YaHei',
                    fontWeight: '400',
                    color: '#FFFFFF',
                    lineHeight: "49",
                }, // 副标题
                itemGap: 50,
            },
            tooltip: {
                trigger: 'item',
                // formatter: "{a} <br/>{b} : {c} ({d}%)"
            },
            series: [{
                name: '访问来源',
                type: 'pie',
                radius: ['42%', '53%'], // 半径
                center: ['50%', '51%'], // 位置
                label: {
                    show: false,
                    position: 'center',
                    color: "#124182"
                },
              data: [{
                value: 70,
                name: '',
                itemStyle: {
                  normal: {
                    color: '#124182',
                    label: {
                      show: false
                    },
                    labelLine: {
                      show: false
                    }
                  }
                }
              }, {
                name: '',
                value: 30,
                 itemStyle: {
                  normal: {
                    color: { // 完成的圆环的颜色
                        colorStops:[{
                            offset: 0,
                            color: 'rgba(47, 156, 255, 0.2)' // 0% 处的颜色
                            }, {
                            offset: 0.5,
                            color: 'rgba(47, 156, 255, 0.5)' // 100% 处的颜色
                            }, {
                            offset: 1,
                            color: 'rgba(47, 156, 255, 1)' // 100% 处的颜色
                        }]
                    },
                    label: {
                      show: false
                    },
                    labelLine: {
                      show: false
                    }
                  }
                }
                }],
                itemStyle: {
                    emphasis: {
                        shadowBlur: 10,
                        shadowOffsetX: 0,
                        shadowColor: 'rgba(0, 0, 0, 0.5)'
                    }
                }
            }]
        };
        // 使用刚指定的配置项和数据显示图表。
        myChart.setOption(option);

        }


 1059
1059

 被折叠的 条评论
为什么被折叠?
被折叠的 条评论
为什么被折叠?
 到【灌水乐园】发言


