


 本文介绍了如何在ECharts的dataZoom组件中设置endValue,以实现折线图显示固定长度的数据。通过设置endValue,可以限制数据展示范围,优化过多数据的展示效果。
写了一个折线图,但是数据太多,所以加了dataZoom,之后又要一个页面显示固定长度,所以endValue要加限制。
官方文档:https://echarts.apache.org/zh/option.html#dataZoom-inside.endValue
放代码:
setChartOptions (charts) {
option = {
tooltip: {
show: true,
trigger: 'axis',
confine: true
},
legend: {
show: false
},
grid: {
left: '2%',
right: '10%',
bottom: '5%',
containLabel: true,
top: '20',
},
xAxis: {
type: 'category',
boundaryGap: false,
data: this.data.lineData.category,
splitLine: {
lineStyle: {
type: 'dashed'
}
}
},
yAxis: {
type: 'value'
},
dataZoom: [{
show: true,
type: 'inside',
xAxisIndex: [0],
startValue: 0,
endValue: this.data.dateTab == '0' ? 8 : 6,
rangeMode: ["value", "value"]
}, {
show: true,
type: 'inside',
xAxisIndex: [0],
startValue: 0,
endValue: this.data.dateTab == '0' ? 8 : 6,
rangeMode: ["value", "value"]
}],
color: this.data.barColor,
series: this.data.lineData.series
};
charts.setOption(option, true);
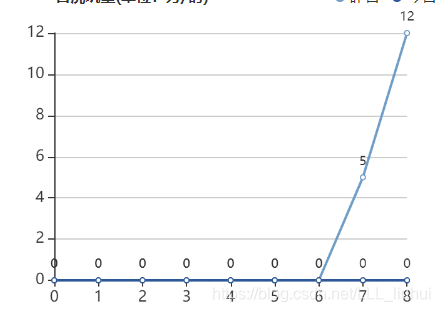
},注意: 添加
rangeMode: ["value", "value"]效果如下:


 6193
6193

 被折叠的 条评论
为什么被折叠?
被折叠的 条评论
为什么被折叠?
 到【灌水乐园】发言


