


 博客主要讲述在tabs页签下使用e-charts折线图时,切换tab页签无法自适应外层div大小的问题。给出的解决方案是添加监听器监听浏览窗口变化,同时使用watch监听父组件中tab页签的值,切换页签时触发resize()方法更新视图。
问题描述:
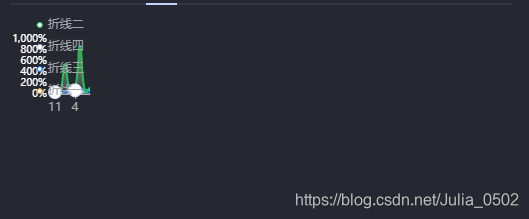
在tabs页签下使用e-charts折线图,切换tab页签e-charts折线图无法自适应外层div大小:
解决方案:
- 添加监听器监听浏览窗口变化,两种监听方法
window.addEventListener('resize', function() { self.myChart1.resize() })
2.window.οnresize = this.myChart1.resize
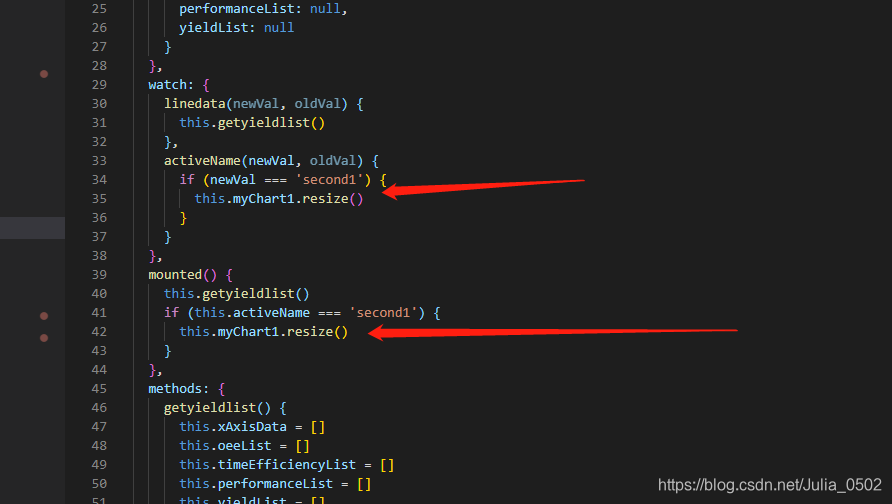
添加了监听事件之后我发现浏览器窗口变化时e-charts折线图会跟着变化,但是在初始页面不改变浏览器窗口,切换tab页签并不会变化,所以我使用了watch监听父组件中tab页签的值,当切换页签的时候,触发一下resize()方法,从而更新e-charts视图
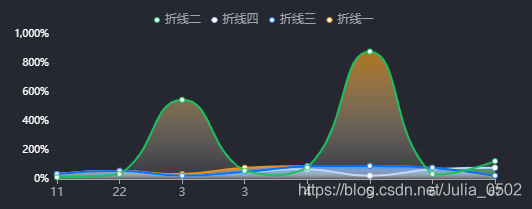
效果图:
<template>
  <div class="line-box">
    <div id="oee-charts" />
  </div>
</template>
<script>
export default {
  name: 'OeeLineCharts',
  props: {
    linedata: {
      type: Object,
      default: null
    },
    activeName: {
      type: String,
      default: ''
    }
  },

  data() {
    return {
      xAxisData: null,
      oeeList: null,
      timeEfficiencyList: null,
      performanceList: null,
      yieldList: null
    }
  },
  watch: {
    linedata(newVal, oldVal) {
      this.getyieldlist()
    },
    activeName(newVal, oldVal) {
      if (newVal === 'second1') {
         this.myChart1.resize()
      }
    }
  },
  mounted() {
    this.getyieldlist()
    if (this.activeName === 'second1') {
      this.myChart1.resize()
    }
  },
  methods: {
    getyieldlist() {
      this.xAxisData = []
      this.oeeList = []
      this.timeEfficiencyList = []
      this.performanceList = []
      this.yieldList = []
      for (const key in this.linedata) {
        this.xAxisData.push(key)
        this.oeeList.push({
          key: key,
          name: '折线一',
          value: this.linedata[key].oee
        })
        this.timeEfficiencyList.push({
          key: key,
          name: '折线二',
          value: this.linedata[key].timeEfficiency
        })
        this.performanceList.push({
          key: key,
          name: '折线三',
          value: this.linedata[key].performance
        })
        this.yieldList.push({
          key: key,
          name: '折线四',
          value: this.linedata[key].yield
        })
      }
      this.LineChart()
    },
    LineChart() {
      this.myChart1 = this.$echarts.init(document.getElementById('oee-charts'))
      const option1 = {
        tooltip: {
          trigger: 'axis',
          backgroundColor: 'rgba(0,0,0,0.5)',
          textStyle: {
            color: '#FFFFFF', // 设置文字颜色
            fontWeight: 400,
            fontFamily: 'Source Han Sans CN',
            fontSize: '12px',
            lineHeight: '18px'
          },
          formatter: function(params) {
            let str = ''
            params.forEach(item => {
              str +=
                item.value !== null
                  ? `${item.name}:${item.value}%<br/>`
                  : `${item.name}:--<br/>`
            })
            return str
          }
        },
        color: ['#19C25F', '#C4D5FF', '#0072FF', '#E99415'],
        legend: {
          data: ['折线二', '折线四', '折线三', '折线一'],
          //   right: 0
          textStyle: {
            color: '#A3A6B0',
            'font-size': '11px',
            'font-family': 'Source Han Sans CN',
            'font-weight': 300
          },
          itemWidth: 6,
          itemHeight: 6
        },
        grid: {
          x: 45,
          y: 25,
          x2: 20,
          y2: 20
        },
        xAxis: [
          {
            type: 'category',
            // data: this.xAxisData || [11, 22, 3, 3, 4, 5, 6, 67],
            data: [11, 22, 3, 3, 4, 5, 6, 67],
            boundaryGap: false,
            axisLine: {
              show: true,
              lineStyle: {
                color: '#A9AAAB'
              }
            },
            axisPointer: {
              snap: true,
              lineStyle: {
                color: '#44D6A4',
                width: 2
              }
            }
          }
        ],
        yAxis: [
          {
            type: 'value',
            axisLabel: {
              formatter: '{value}%',
              fontSize: '12px',
              fontFamily: 'Source Han Sans CN',
              fontWeight: 300,
              color: '#FFFFFF'
            },
            axisLine: {
              show: false
            },
            splitLine: {
              show: true,
              lineStyle: {
                color: ['rgba(41, 44, 51, 1)'],
                width: 1,
                type: 'solid'
              }
            }
          }
        ],
        series: [
          {
            name: '折线二',
            type: 'line',
            data: [34, 56, 23, 45, 67, 23, 67, 78, 23],
            symbolSize: 5,
            symbol: 'emptyCircle',
            smooth: true,
            lineStyle: {
              width: 2,
              color: '#C4D5FF'
            },
            itemStyle: {
              normal: {
                borderColor: '#C4D5FF'
              }
            },
            // 区域填充样式
            areaStyle: {
              color: {
                type: 'linear',
                x: 0,
                y: 0,
                x2: 0,
                y2: 1,
                colorStops: [
                  {
                    offset: 0,
                    color: 'rgba(25, 194, 95, 1)' // 0% 处的颜色
                  },
                  {
                    offset: 1,
                    color: 'rgba(255, 255, 255, 0.1)' // 100% 处的颜色
                  }
                ],
                global: false // 缺省为 false
              }
            }
          },
          {
            name: '折线四',
            type: 'line',

            // data: this.yieldList || [34, 56, 34, 78, 89, 90, 78, 23],
            data: [34, 56, 34, 78, 89, 90, 78, 23],
            symbolSize: 5,
            symbol: 'emptyCircle',
            smooth: true,
            lineStyle: {
              width: 2,
              color: '#E99415'
            },
            itemStyle: {
              normal: {
                borderColor: '#E99415'
              }
            },
            // 区域填充样式
            areaStyle: {
              color: {
                type: 'linear',
                x: 0,
                y: 0,
                x2: 0,
                y2: 1,
                colorStops: [
                  {
                    offset: 0,
                    color: 'rgba(196, 213, 255, 1)' // 0% 处的颜色
                  },
                  {
                    offset: 1,
                    color: 'rgba(255, 255, 255, 0.1)' // 100% 处的颜色
                  }
                ],
                global: false // 缺省为 false
              }
            }
          },
          {
            name: '折线三',
            type: 'line',
            data: [34, 56, 23, 48, 89, 90, 78, 23],
            symbolSize: 5,
            symbol: 'emptyCircle',
            smooth: true,
            lineStyle: {
              width: 2,
              color: '#0072FF'
            },
            itemStyle: {
              normal: {
                borderColor: '#0072FF'
              }
            },
            // 区域填充样式
            areaStyle: {
              color: {
                type: 'linear',
                x: 0,
                y: 0,
                x2: 0,
                y2: 1,
                colorStops: [
                  {
                    offset: 0,
                    color: 'rgba(0, 114, 255, 1)' // 0% 处的颜色
                  },
                  {
                    offset: 1,
                    color: 'rgba(255, 255, 255, 0.1)' // 100% 处的颜色
                  }
                ],
                global: false // 缺省为 false
              }
            }
          },
          {
            name: '折线一',
            type: 'line',
            data: [12, 34, 546, 57, 78, 879, 34, 123],
            symbolSize: 5,
            symbol: 'emptyCircle',
            smooth: true,
            lineStyle: {
              width: 2,
              color: '#19C25F'
            },
            itemStyle: {
              normal: {
                borderColor: '#19C25F'
              }
            },

            // 区域填充样式
            areaStyle: {
              color: {
                type: 'linear',
                x: 0,
                y: 0,
                x2: 0,
                y2: 1,
                colorStops: [
                  {
                    offset: 0,
                    color: 'rgba(233, 148, 21, 1)' // 0% 处的颜色
                  },
                  {
                    offset: 1,
                    color: 'rgba(255, 255, 255, 0.1)' // 100% 处的颜色
                  }
                ],
                global: false // 缺省为 false
              }
            }
          }
        ]
      }

      // 使用刚指定的配置项和数据显示图表。
      this.myChart1.setOption(option1)
      const self = this
      window.addEventListener('resize', function() {
        self.myChart1.resize()
      })
      // window.οnresize = this.myChart1.resize
    }
  }
}
</script>
<style lang="scss" scoped>
.line-box {
  width: 100%;
  //   height: calc(100% - 54px);
  height: 200px;
  display: flex;
  justify-content: center;
  padding-top: 10px;
  #oee-charts {
    width: 100%;
    height: 100%;
  }
}
</style>


 339
339

 被折叠的 条评论
为什么被折叠?
被折叠的 条评论
为什么被折叠?
 到【灌水乐园】发言


