


JuliaPro learning notes( Day 1, 2019 Jun 17)
I am using JuliaPro 1.1.1.1 on atom on Mac Mojave, and JuliaBox.
Reminder for using atom: according to http://docs.juliaplots.org/latest/install/
To use Plot, we need to install some packages:
Pkg.add("Plots")
Pkg.add("PyPlot")
Pkg.add("GR")
Pkg.add("UnicodePlots")
Pkg.add("PlotlyJS")?This may fail but it doesn’t really matter.
The thing is, even after we install packages, we cannot plot on the Plot Pane?
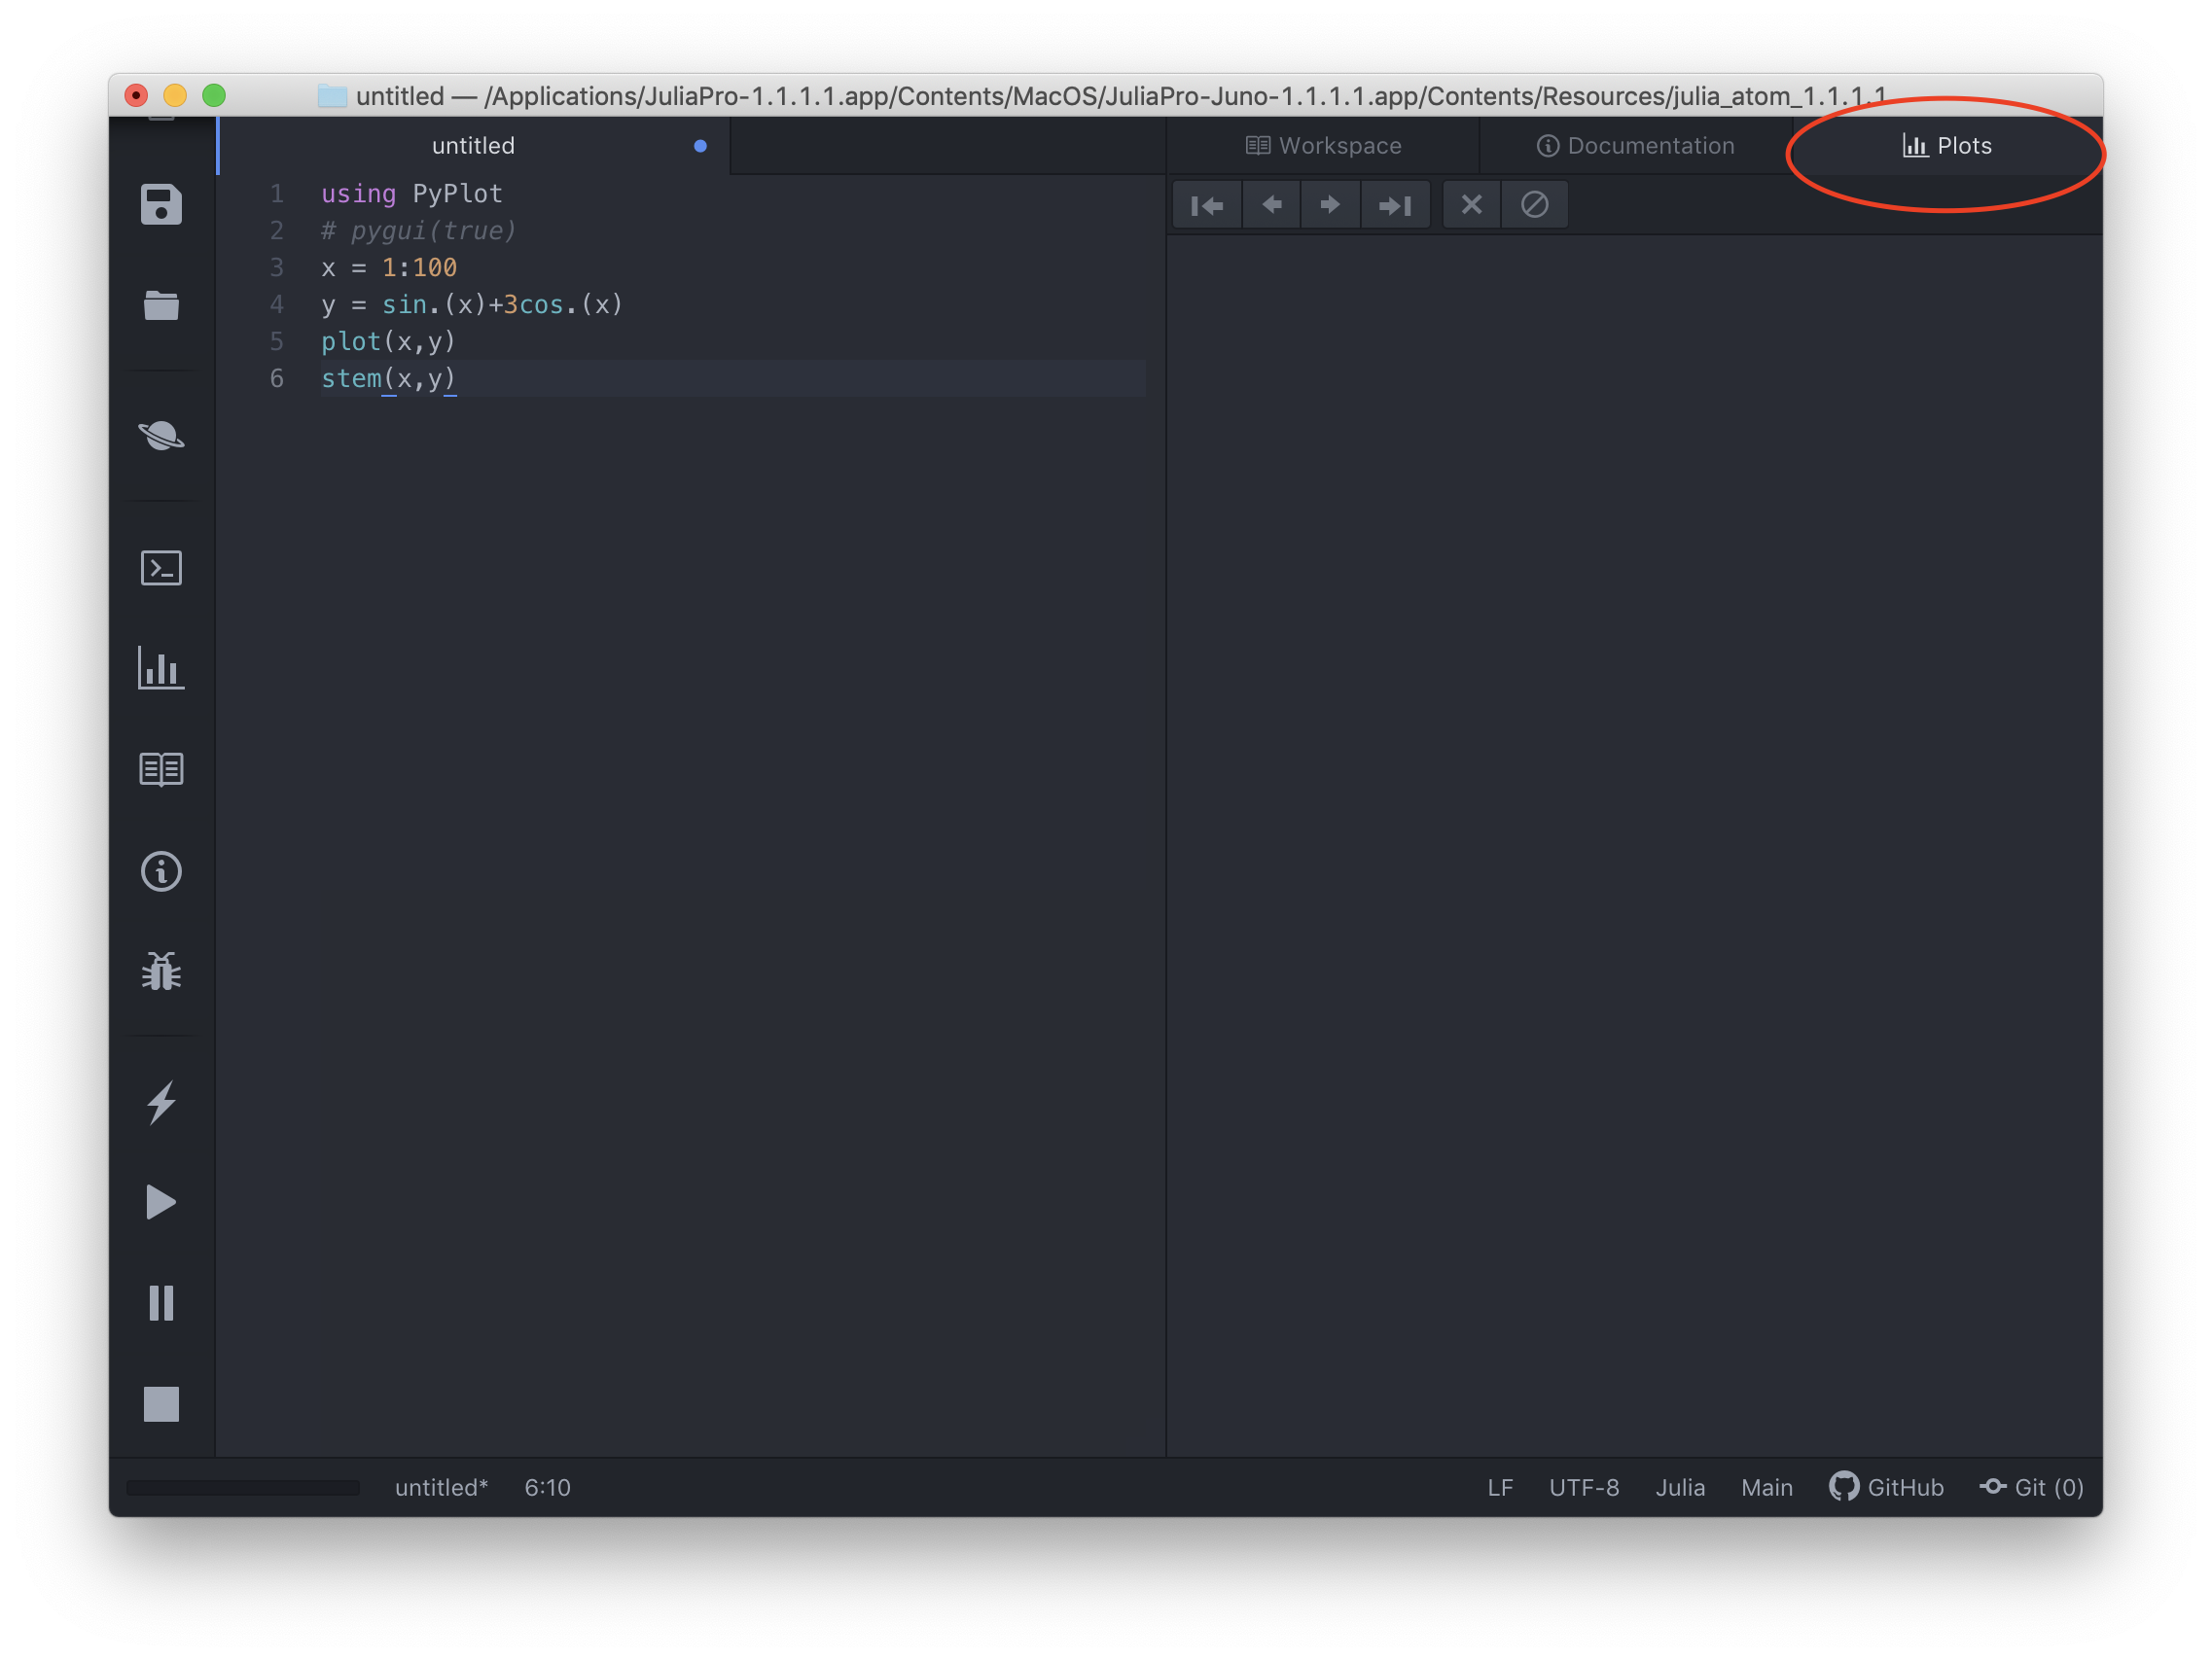
To solve this, we need to add pygui(true) in the code file or REPL panel. Then we press Run File on the left bar, boom: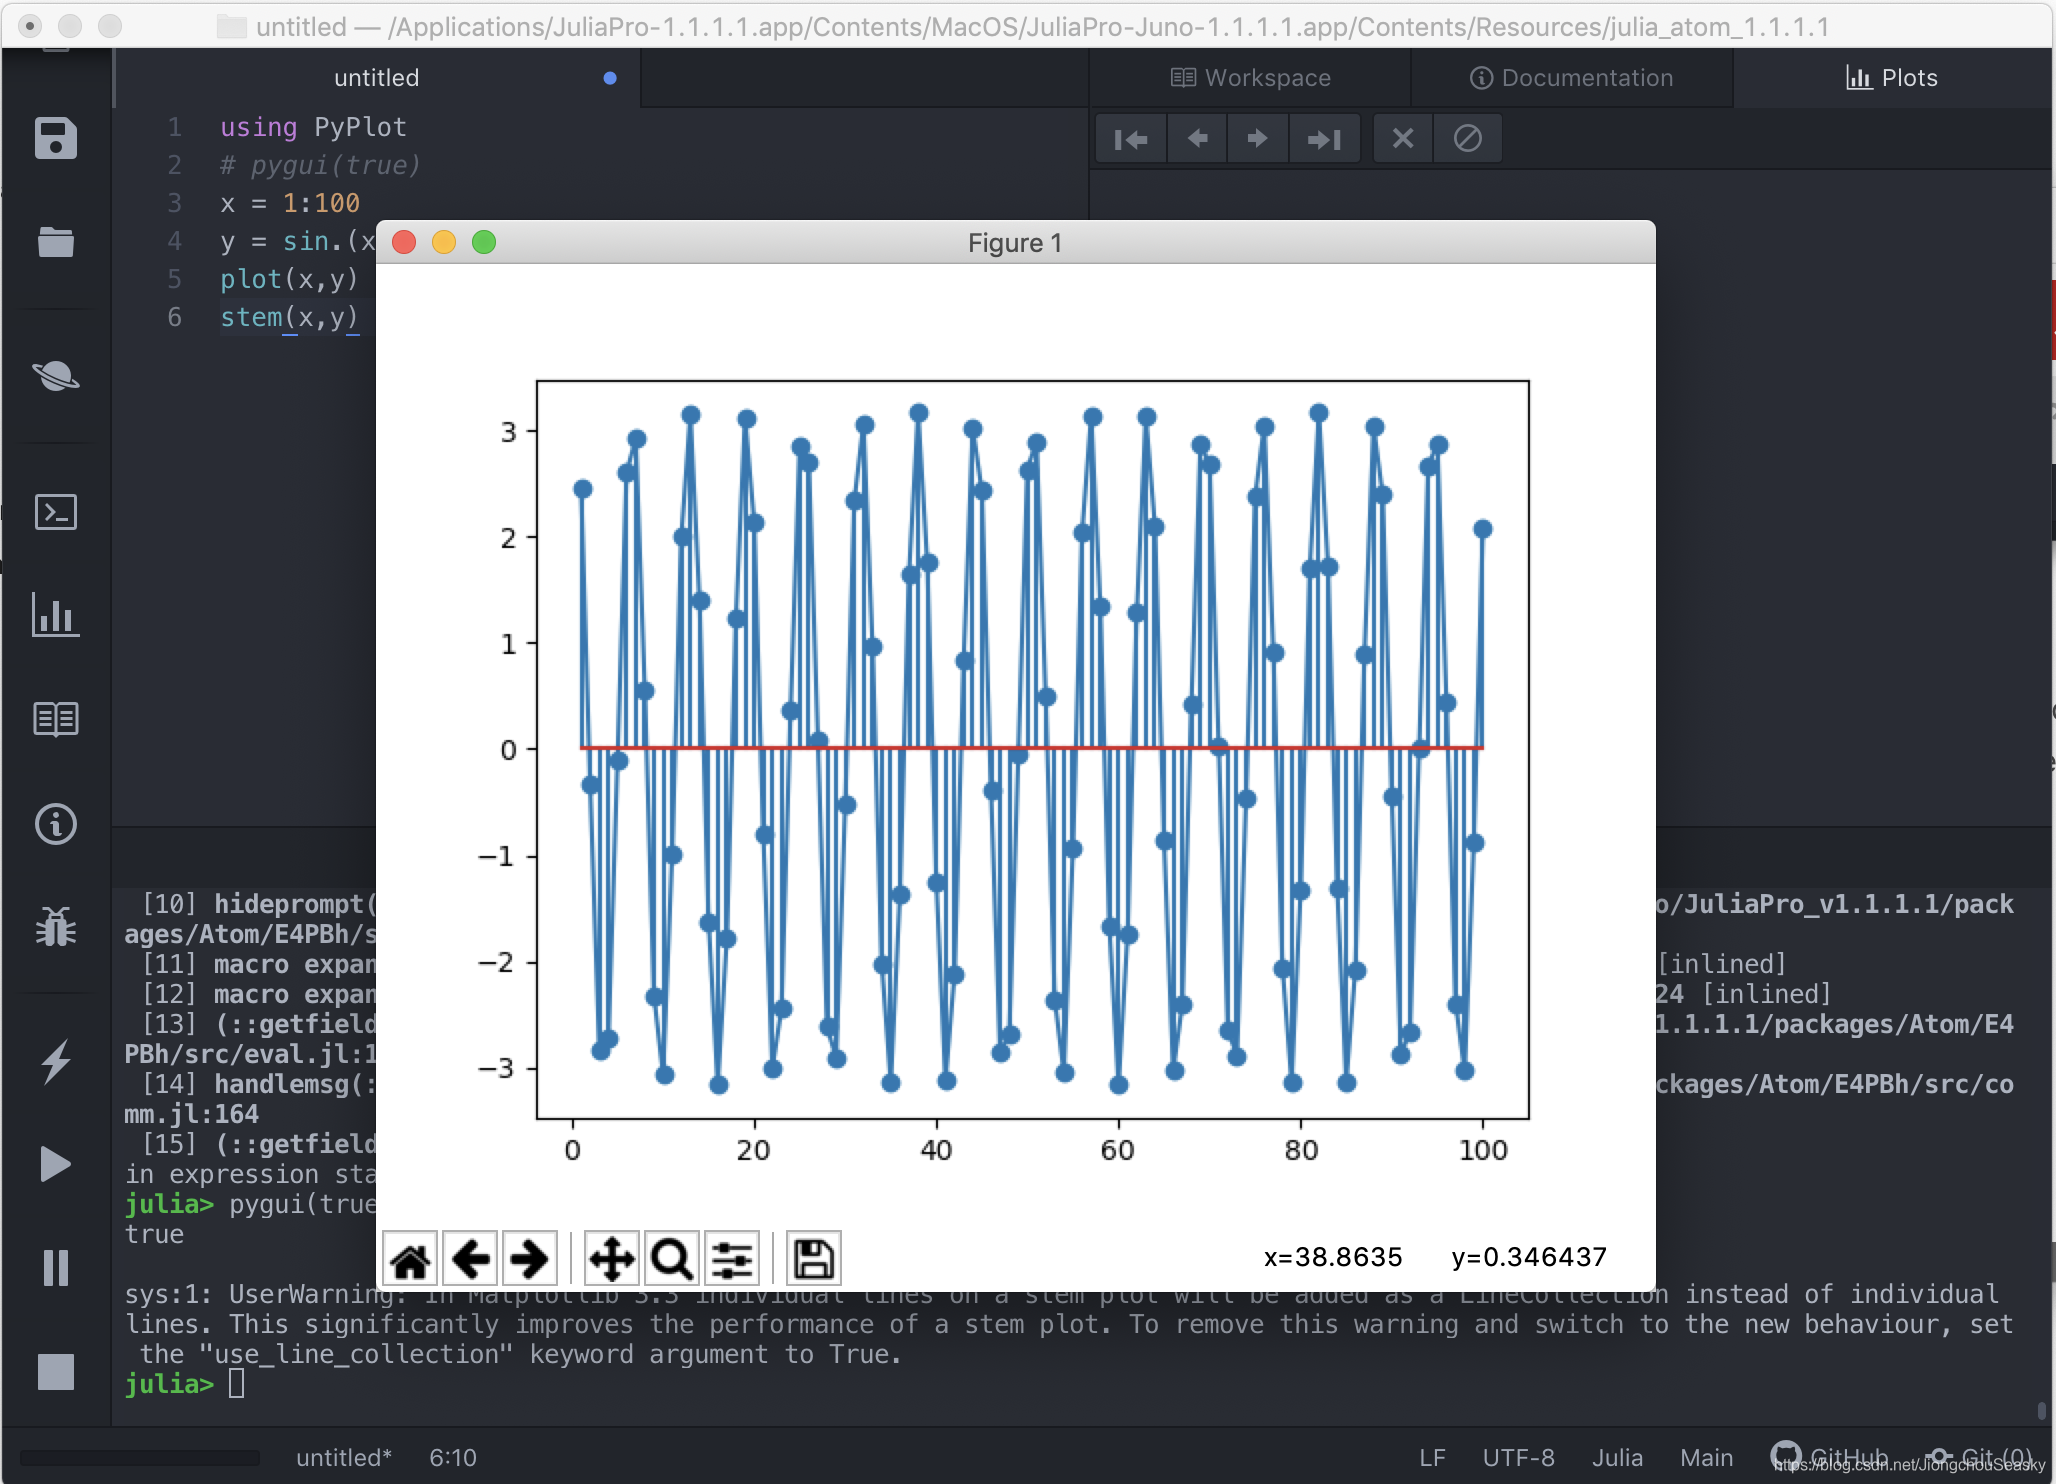
by the way my code is:
using PyPlot
pygui(true)
x = 1:100
y = sin.(x)+3cos.(x)
plot(x,y)
stem(x,y)
Here you may notice something. Yes, I am learning Linear Algebra using Julia as programming language. It is quite handy since the language is more like human tone and it has many characteristics of Matlab, which is great.
So here, the usage of x.^# and sin.(x) is to assign all the value of x (an array) to y. And stem is to show the points used to plot the figure.
Now that I am just starting to learn LA, about the Gaussian Elimination, I need to mention that:
A = [1 1 1; 2 5 1; 13 5 3]
b = [1, 3. 66]
x = A\b
A is a matrix and b is a vector (pay attention to how to write code). Then we can find x with it.
Cool cool ?


 被折叠的 条评论
为什么被折叠?
被折叠的 条评论
为什么被折叠?
 到【灌水乐园】发言


