


Prometheus 是一个开源的系统监控和告警工具包,特点:
数据模型基于时序数据库(Time Series)
查询语言 PromQL 强大灵活
无需依赖外部存储,内置数据存储引擎
与 Grafana 配合使用极为广泛
一、安装部署
crontab -e

#1. sync time xiaop
*/2 * * * * /sbin/ntpdate ntp1.aliyun.com
&>/dev/null

#如果服务器时间不准,启用 NTP 同步时间
yum install -y chrony
systemctl enable chronyd --now
chronyc sources
chronyc tracking
mkdir -p /app/ ##创建安装目录 tar xf prometheus-2.33.3.linux-amd64.tar.gz -C/app/ #自己准备好的包 ln -s /app/prometheus-2.33.3.linux-amd64/ /app/prometheus ##软链接 prometheus prometheus ##服务端的命令 prometheus.yml ##配置文件。 global: scrape_interval: 15s scrape_configs: - job_name: "prometheus" static_configs: - targets: ["localhost:9090"] ##scrape_interval:采集间隔 ##scrape_configs:定义采集目标(Job)
二、启动
#前台启动
cd /app/tools/prometheus
 ./prometheus

[root@prome ~]# ps -ef |grep prome
root       1699   1533  2 22:19 pts/0    00:00:00 ./prometheus
root       1728   1710  0 22:19 pts/1    00:00:00 grep --color=auto prome

[root@prome ~]# ss -lntup |grep prome
tcp    LISTEN     0      128      :::9090                 :::*                   users:((prometheus",pid=1699,fd=7))

#后台启动
nohup /app/prometheus/prometheus &>>/var/log/prometheus.log &

##访问
192.168.200.151:9090
三、systemctl管理
vim /usr/lib/systemd/system/prometheus.service

[Unit]
Description=xaiop Prometheus Server
After=network.target

[Service]
Type=simple
User=prometheus
Group=prometheus
ExecStart=/app/prometheus/prometheus --config.file=/app/prometheus/prometheus.yml
Restart=on-failure
RestartSec=5
KillMode=process

[Install]
WantedBy=multi-user.target


#加载配置文件
systemctl daemon-reload
四、Prometheus的exporter
1、常见 Exporter 列表
Exporter 用途 默认端口 Node Exporter 服务器资源监控 9100 Blackbox Exporter 网络探测 9115 MySQL Exporter 数据库监控 9104 Nginx Exporter Nginx 连接数等 9113 cAdvisor 容器监控 8080 kube-state-metrics K8s 状态监控 8080
2、部署node_exporter
##解压到 /app/tools/

tar xf node_exporter-1.3.1.linux-amd64.tar.gz -C  /app/tools/

##软链接
ln -s /app/tools/node_exporter-1.3.1.linux-amd64/ /app/tools/node_exporter

ln -s /app/tools/node_exporter/node_exporter /bin/

##仓库版本
node_exporter --version
配置systemctl
vim /usr/lib/systemd/system/nodeexporter.service

[Unit]
Description=prometheus node_exporter
After=network.target
[Service]
Type=simple
ExecStart=/bin/node_exporter
KillMode=process
[Install]
WantedBy=multi-user.target

systemctl daemon-reload
systemctl enable --now node-exporter
3、配置prometheus服务端
[root@prome prometheus]# cat prometheus.yml
# my global config
global:
  scrape_interval: 15s # Set the scrape interval to every 15 seconds. Default is every 1 minute.
  evaluation_interval: 15s # Evaluate rules every 15 seconds. The default is every 1 minute.
  # scrape_timeout is set to the global default (10s).

# Alertmanager configuration
alerting:
  alertmanagers:
    - static_configs:
        - targets:
          # - alertmanager:9093

# Load rules once and periodically evaluate them according to the global 'evaluation_interval'.
rule_files:
  # - "first_rules.yml"
  # - "second_rules.yml"

# A scrape configuration containing exactly one endpoint to scrape:
# Here it's Prometheus itself.
scrape_configs:
  # The job name is added as a label `job=<job_name>` to any timeseries scraped from this config.
  - job_name: "prometheus"

    # metrics_path defaults to '/metrics'
    # scheme defaults to 'http'.

    static_configs:
      - targets: ["localhost:9090"]

  - job_name: 'linux-server1'
    static_configs:
      - targets: ['192.168.200.181:9100']

  - job_name: 'linux-server2'
    static_configs:
      - targets: ['192.168.200.183:9100']

[root@prome prometheus]#
4、检查结果
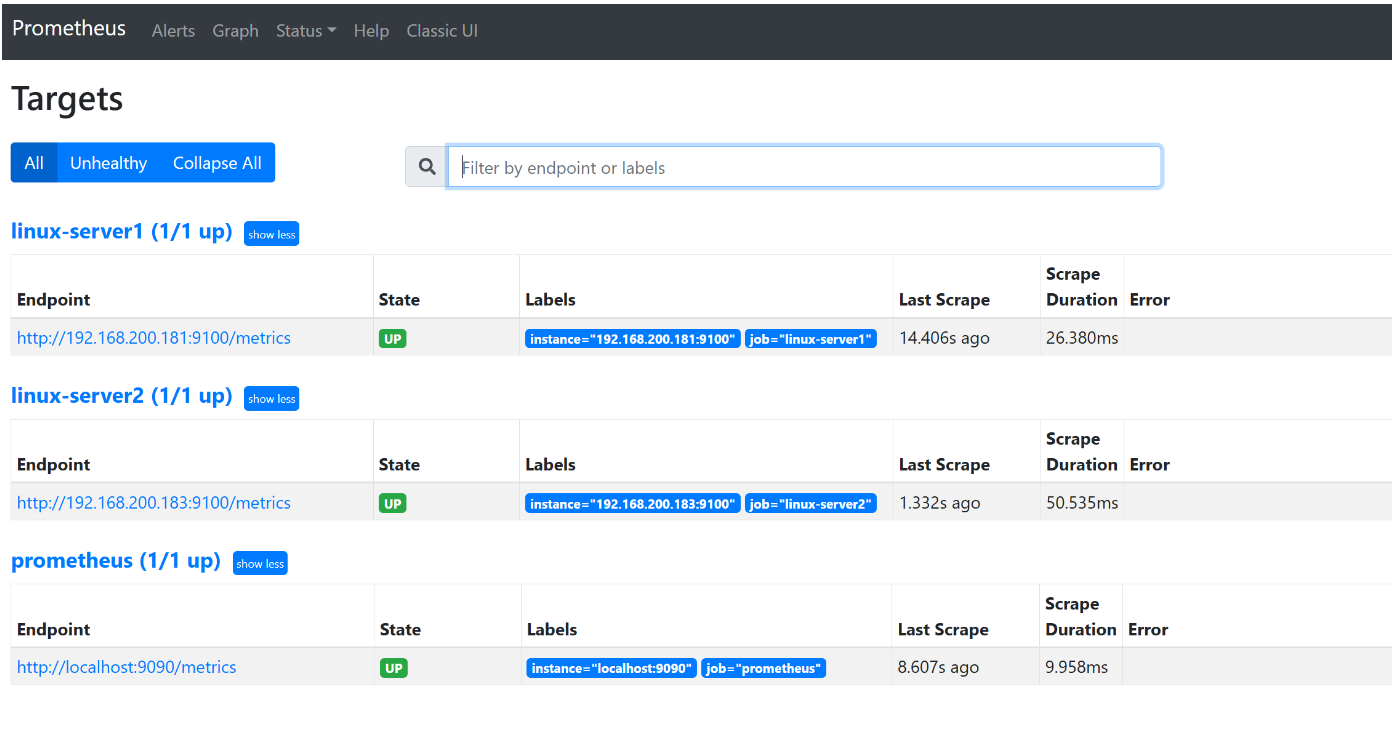
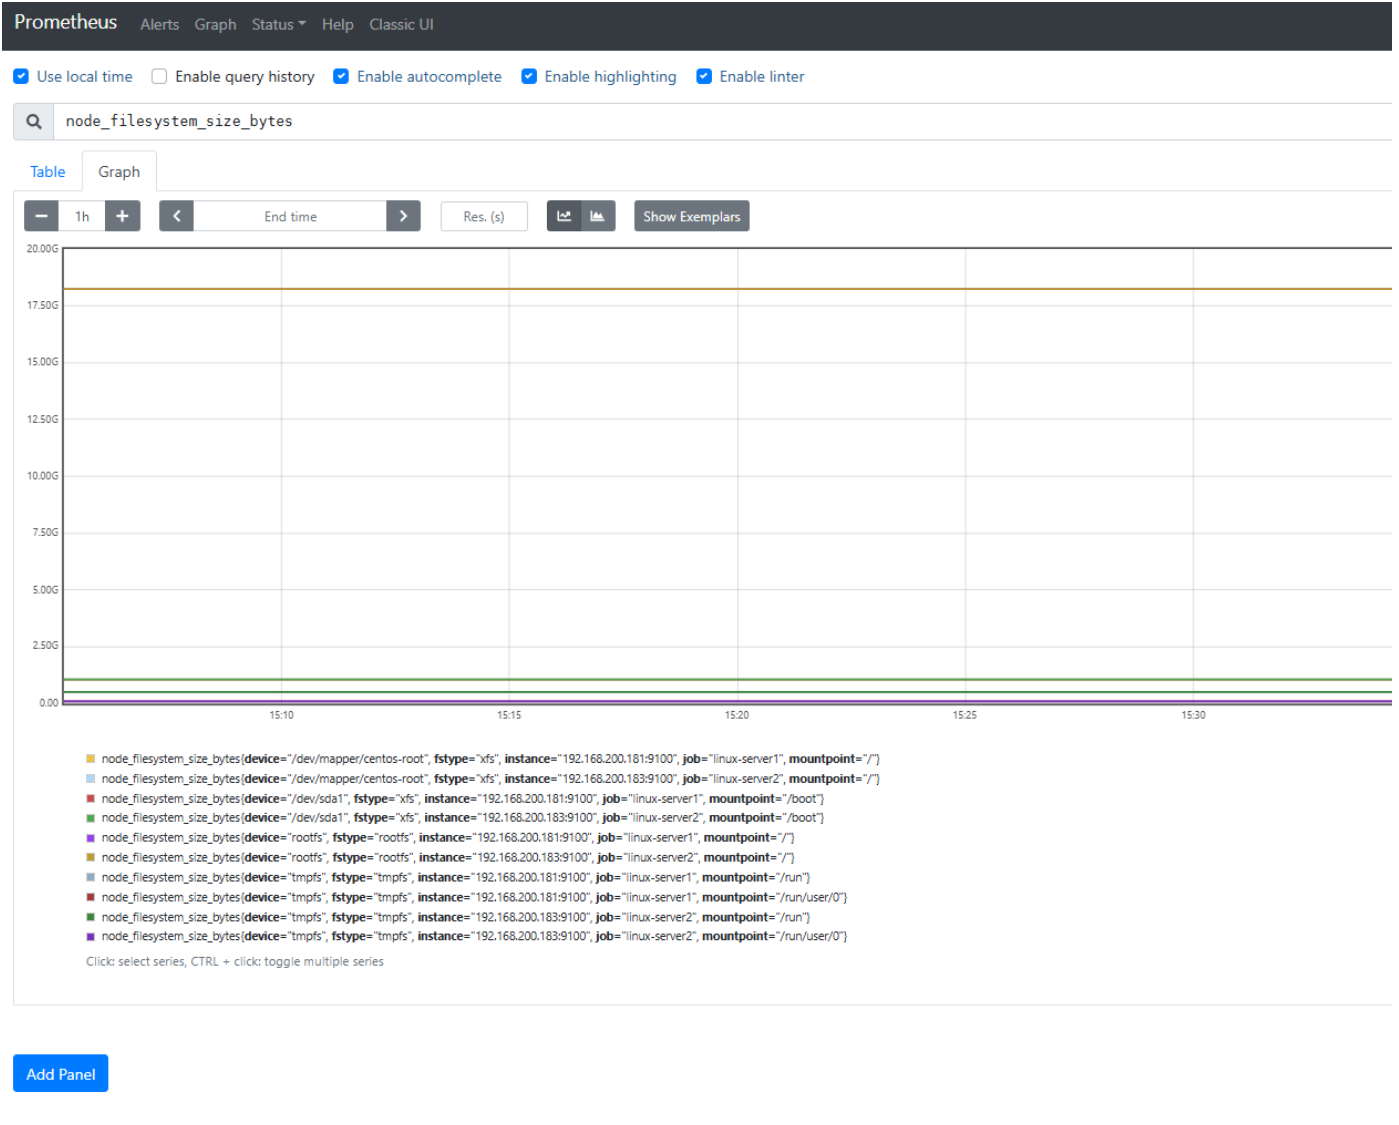
5、过滤数据
五、prometheus动态配置文件
获取的exporter域名+端口,写入配置文件,prometheus可以定时读取并加入到prometheus中。
用于解决,大量主机添加、删除的操作。
cat prometheus.yml

rule_files:
scrape_configs:
  - job_name: "xiaop_prometheus_server"
   static_configs:
    - targets: ["localhost:9090"]

  - job_name: "xiaop_basic_info_node_exporter_discovery"
   file_sd_configs:
    - files:
      - /app/tools/prometheus/discovery_node_exporter.json
     refresh_interval: 5s


#动态加载的配置文件格式
cat discovery_node_exporter.json
[
 {
    "targets": [
                 "prom.linux.cn:9100",
                 "gra.linux.cn:9100"
               ]
 }
]


##说明
file_sd_configs: 动态读取与加载配置文件。
files: 指定要加载的配置文件.
refresh_interval 读取间隔.
六、PromQL 查询语法
直接写上prometheus的键值(key)
比如通过node_exporter获取所有主机可用内存输入 node_memory_MemFree_bytes
node_memory_MemFree_bytes

#加入运算符后
node_memory_MemFree_bytes/1024^2

#过滤负载:
node_load1

#查看所有键值
1、包含条件的过滤
过滤指定主机的数据
node_cpu_seconds_total{instance="192.168.200:9100"}过滤出指定主机cpu信息只要iowait信息
node_cpu_seconds_total{instance="web.com:9100",mode="iowait"}
2. 聚合操作
avg(rate(node_cpu_seconds_total{mode="idle"}[1m])) by (instance)
3.计算主机 CPU 使用率
1 - avg(rate(node_cpu_seconds_total{mode="idle"}[5m])) by (instance)
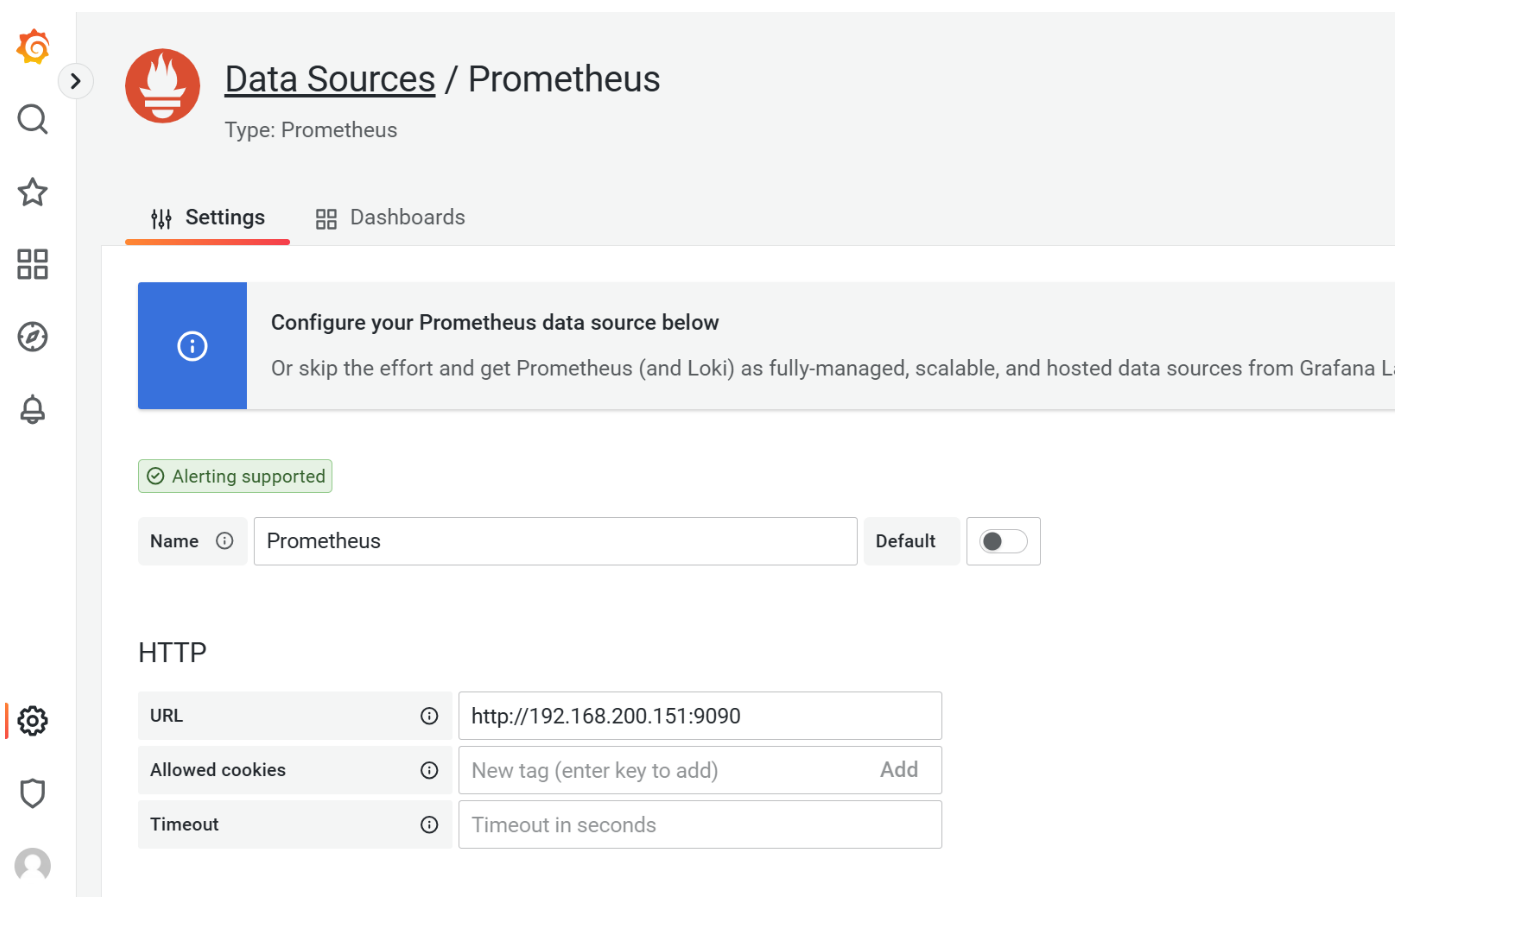
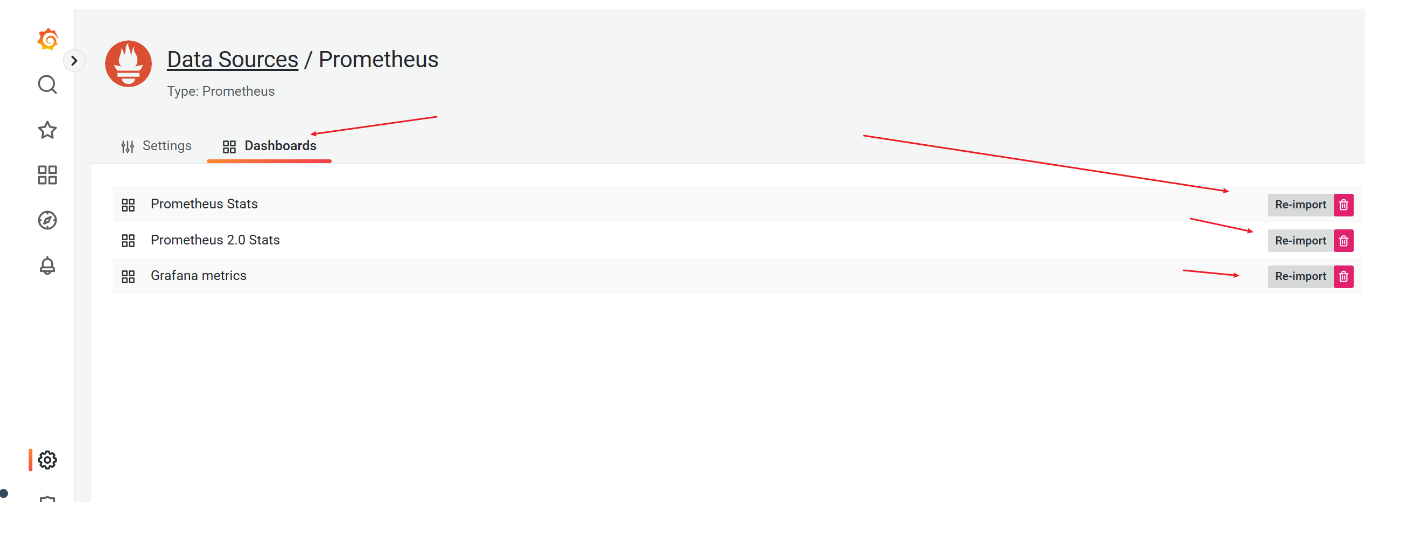
七、Grafana可视化
八、告警配置(Alertmanager)
##使用流程:
部署alertermanager(prometheus服务端)
修改alertmanger配置
配置告警规则rules与修改服务端配置1
1、Alertmanager部署
#下载
wget -P /server/tools/ https://github.com/prometheus/alertmanager/releases/download/v0.24.0/alertmanager-0.24.0.linux-amd64.tar.gz


tar xf alertmanager-0.24.0.linux-amd64.tar.gz  -C /app/prometheus

ln -s /app/prometheus/alertmanager-0.24.0.linux-amd64/alertmanager /bin/

ln -s /app/prometheus/alertmanager-0.24.0.linux-amd64/ /app/prometheus/alertmanager

#启动参数
--config.file="alertmanager.yml"
--web.listen-address=":9093"

##前台启动测试
alertmanager --config.file=/app/prometheus/alertmanager/alertmanager.yml


##二方法(提前准备好包)
#1. 解压
 tar xf alertmanager-0.24.0.linux-amd64.tar.gz -C /app/tools/
#2. 软连接
 ln -s /app/tools/alertmanager-0.24.0.linux-amd64/ /app/tools/alertmanager
 ln -s /app/tools/alertmanager/alertmanager /bin/
#3. 检查
 alertmanager --version
#4. 启动
 alertmanager --config.file=/app/tools/alertmanager/alertmanager.yml
2、Prometheus 中配置告警规则
rule_files:
  - "alert.rules.yml"
示例
alert.rules.yml:groups: - name: node-alerts rules: - alert: InstanceDown expr: up == 0 for: 1m labels: severity: critical annotations: summary: "Instance {{ $labels.instance }} down"Prometheus 指向 Alertmanager
alerting:
  alertmanagers:
    - static_configs:
        - targets:
          - localhost:9093  ##Alertmanager地址
rule_files:
  - "/app/prometheus/prometheus_alert_rules.yml"
scrape_configs:
  - job_name: "prometheus-server"
   static_configs:
      - targets: ["localhost:9090"]
       - job_name: "prometheus-all-node_exporter-two"
   file_sd_configs:
    - files:
      - /app/prometheus/discovery_node_exporter.yml
     refresh_interval: 5s
  - job_name: "pushgateway"
   static_configs:
      - targets:
        - "gra.linux.cn:9091"
#####有待补充


 568
568

 被折叠的 条评论
为什么被折叠?
被折叠的 条评论
为什么被折叠?
 到【灌水乐园】发言


